Abstract
In recent years, to improve the fuel efficiency of automobiles by reducing their weight while maintaining their strength, smaller-thickness and higher-strength steel sheets tends to be used as automobiles’ construction materials. For stable and accurate production of these sheets, it is crucial for them to be flattened through the hot strip rolling process. Therefore, to realize accurate automatic flatness control (AFC), a new shape meter that employed the light-emitting diode (LED) dot pattern projection method was developed. This consists of an LED dot pattern projector that can project the staggered periodic dot pattern, made of 1200 power LED chips, on the rolled strip and area camera that captures the image of the projected pattern. Then, instantaneous strip flatness is measured to analyze the pattern pitch correlative with inclination angle. The shape meter was installed at the hot strip finishing mill’s exit, and its measurement accuracy and stability were evaluated. As a result, its inclination angle measurement error was within 0.45 degrees (two sigma) when compared to the set angle of the standard target, and the measured flatness of the rolling strip was consistent with the visually observed one. Its measurement success rate per entire coil was above 98.5%. These results indicated that the developed shape meter could be applied to the AFC. In addition, applying the measured flatness to the AFC of the work roll bender and leveling, it was confirmed that the strip flatness was improved in a short time.
1. Introduction
In recent years, to improve the fuel efficiency of automobiles by reducing their weight while maintaining their strength, smaller-thickness and higher-strength steel sheets tends to be used as automobiles’ construction materials. These steel sheets are manufactured by a hot strip finishing mill consisting of six to seven rolling stands. The finishing mill reduces a thickness of a rough bar down to the hot-rolled strip with the thickness required by a customer or the next process. This hot-rolled strip is cooled in a cooling zone to achieve its mechanical properties and then wound up by a coiler.
For production of these strips, it is crucial that they are stably passed through the finishing mill and that their thickness and cooling temperature are accurately controlled. To meet these requirements, instrumentation techniques, which can newly measure unknown or inaccurate process information in a harsh environment at hot rolling process, and control techniques using them have been researched and developed. The interstand strip velocimeter, which measures the strip velocity, was aimed to be applied to the mass-flow control between rolling stands for improving strip thickness accuracy and optimizing the tension of the strip head.1) The interstand strip position sensor, which measures the sudden rotation of the strip tail end, was applied to the leveling control of the rolling stand to reduce the strip walking trouble.2) The fountain pyrometer, which measures the strip temperature in the cooling zone, was applied to cooling pattern control to improve the temperature accuracy and mechanical properties of the strip.3,4)
For further improvement of these productivity and quality, it is effective to control the strip to be accurately flattened at hot rolling. The rolled material, which becomes thinner and stronger, tends to increase a rolling load and deformation of the work rolls and thus causes deterioration of the strip shape. The deterioration of the strip shape is followed further deterioration of the strip shape and cooling temperature unevenness of the strip in the cooling zone and makes the strip difficult to be stably wound on the coiler.5) Therefore, some methods have been proposed for flattening the strip at hot rolling using a shape meter installed at the exit of the hot strip finishing mill. These are automatic flatness control (AFC) that controls the work roll bender and setup function that sets the initial conditions such as shift position of the work roll and load distribution of rolling stands by learning control.6,7)
As to a conventional flatness measurement method for a hot-rolled strip, the laser twin-beam method8,9,10) and the multiple line pattern projection method11,12) are well known. As to the laser twin-beam method, two laser rangefinders are installed at a distance in the rolling direction and measure the inclination angles of the strip from moment to moment, and the surface length and elongation rate of the strip are calculated by line integration of these. Because the inclination angle is measured at one fixed point in the rolling direction, measurement accuracy becomes worse in the state at which a standing wave is formed on the strip. As to the multiple line pattern projection method, line patterns are projected onto a large area of the strip, and their three-dimensional shape is measured at a moment. In this method, deterioration of measurement accuracy in a state where a standing wave formed on the strip can be suppressed. To realize this method, there were challenges at a light source that projected multiple lines onto the strip at high temperature. The shape meter, which employed the projector using a high-power laser beam, had a limit to the number of line patterns that could be projected at the time of development and could not measure the strip shape accurately. By contrast, the shape meter, which employed the projector using a high-power lump that projects the stripe pattern through the slide, had a problem of short service life of the lump. In addition, this projector could not adjust the illuminance distribution of the projected pattern. Therefore, when a specular reflection from a strip surface was partially observed, it had a problem of measurement stability.
To solve these problems, the new shape meter employing the light-emitting diode (LED) dot pattern projector, which was characterized by long service life and high brightness, had been developed and evaluated in real hot strip finishing mill. In this paper, the measurement principle of the new shape meter, configuration of the LED dot pattern projector and the shape meter, evaluation results and effectiveness of AFC are described.
2. Required Specification
Generally, as an index to represent the flatness, values such as the elongation rate ε and steepness λ are used. The elongation rate ε and the steepness λ are defined by following Eqs. (1) and (2) with a height h and wavelength L of sheet wave formed of the strip, as illustrated in Fig. 1.
By approximating the shape of the sheet wave with a sine wave, a well-known relationship represented by the following Eq. (3) exists between the elongation rate ε and the steepness λ:
Figure 2 illustrates relationships between strip shape variations, which are often observed in the hot-rolling process, and elongation rate distributions, εCENT and εEDGE, in the strip width direction. When the center elongation rate εCENT is greater than the edge elongation rate εEDGE, the strip buckles at its center. Conversely, when the edge elongation rate εEDGE is greater than the center elongation rate εCENT, the strip shape is an edge wave.

Table 1 lists specifications of the shape meter. The desired installation place is the exit of the hot strip finishing mill, and the measuring target is a hot-rolled strip that has the maximum width of 1650 mm, the maximum rolling temperature of 950°C and the maximum traveling velocity of 25 m/s. Steepness must be measured at five evaluation points in the width direction of the strip. These are Center that is positioned at width center, WS_edge and DS_edge that are positioned near the inner edge of the strip, WS_quarter and DS_quarter that are positioned at the middle point of edge and the Center, respectively. For it to be applied to AFC, it is better that the measurement result is outputted as the differential elongation rate referenced to the center elongation rate. The differential elongation rate is calculated by Eq. (4), where εCENT is the elongation rate at a width center of the strip, εk is the elongation rate at evaluation point (k is any one of WS_edge, DS_edge, WS_quarter and DS_quarter). The differential elongation rate is translated to steepness by Eq. (5) and is outputted to the controller of the hot strip finishing mill.
|
Δ
ε
k
=
ε
k
-
ε
CENT
ε
CENT
| (4) |
|
λ
k
={
2
π
|
Δ
ε
k
|
(if Δ
ε
k
≥0),
-
2
π
|
Δ
ε
k
|
(if Δ
ε
k
<0).
| (5) |
Table 1. Required specification of the shape meter.
| Item | Required specification |
|---|
| Installation place | Exit of the hot-strip finishing mill |
| Strip width | 650–1650 mm |
| Strip velocity | Max. 25 m/s |
| Strip temperature | 700–950°C |
| Steepness measuring point | Width direction: five points
(WS_edge, WS_quarter, Center, DS_quarter, DS_edge) |
| Steepness measuring accuracy | 2σ = 0.2% for steepness range ±5% |
| Response | Within 1000 ms |
Steepness, the ratio of the sheet wave height to the sheet wave length, makes it is easy to recognize the height of the sheet wave of the strip and can be transmitted to the controller at a smaller number of digits. The steepness measurement range is within ±5% by considering the maximum steepness observed at the hot-rolling process. The target measurement accuracy of 0.2% (2 sigma) was determined by an inspection accuracy of the strip at room temperature.
3. Measurement Principle
3.1. Shape Measurement
In the pattern projection method, a stripe pattern is normally projected onto the strip surface from a diagonal angle β above by a projector with a light source. From a direction different angle α, an image of the pattern projected onto the surface is captured into the PC by a camera. The pattern pitch distribution is measured from periodic intensity distribution. Then, inclination angle distribution and the strip shape in the rolling direction are calculated from pattern pitch distribution. Figure 3 illustrates the inclination angle measurement principle by the pattern projection method. Here, the rolling direction is defined as the x-axis, Pr(x) is pattern pitch distribution of flat strip as illustrated in Fig. 3(a), and Ps(x) is pattern pitch distribution of a non-flat strip with inclination angle distribution. The observed pattern pitch is wider when the surface inclines toward the camera, as illustrated in Fig. 3(b) and is narrower when the surface inclines toward the projector, as illustrated in Fig. 3(c). The inclination angle distribution of the strip θ(x) is geometrically calculated from the ratio of Ps(x) to Pr(x) by Eq. (6). In other words, by measuring Pr(x), the pattern pitch distribution of the reference flat plate in advance, θ(x), is calculated from measured Ps(x), the pattern pitch of the target strip. Then, the strip shape y(x) is calculated by line integration of θ(x) in the rolling direction by Eq. (7). Even if the standing wave is formed on the strip traveling at high speed, the flatness, steepness distribution of the width direction can be accurately measured from the image without blurring that is captured with short exposure time.
|
θ(x)=
tan
-1
{
(
P
s
(x)/
P
r
(x)
)
-1
tanα+(
P
s
(x)/
P
r
(x)
)
tanβ
}
| (6) |
|
y(x)=
∫
0
x
tanθ(x)dx
| (7) |
To calculate steepness distribution in the width direction, surface length Sm along the surface shape in the rolling direction and straight line length Lm at evaluation point of the width position are calculated from strip shape, and the elongation rate εm is then calculated by Eq. (1) and translated to steepness λm by Eq. (3). However, when the measurement area length in the rolling direction is shorter than the wavelength of the sheet wave, measured steepness is influenced because the measured surface shape cannot reflect the entire sheet wave. Where the x-axis is the rolling direction and the shape of the sheet wave y(x) is assumed to be a sine wave, which has wave height h and wavelength L and expressed by Eq. (8), the strip surface inclination angle dy/dx can be expressed by Eq. (9). Then, the difference between maximum inclination angle and the minimum one is proportional to the steepness as expressed by Eq. (10).
|
y(x)=
h
2
{
1-cos(
2πx
L
)
}
| (8) |
|
dy
dx
=tanθ(x)=
πh
L
sin(
2πx
L
)
=πλsin(
2πx
L
)
| (9) |
|
θ
max
-
θ
min
=
tan
-1
(2πλ)≒2πλ
| (10) |
When the elongation rate and steepness are calculated from the measured strip shape on the measurement area that has its area length R and center position X (x coordinates range from X−R/2 to X+R/2), the surface length Sm and the straight line length Lm at the evaluation point of the width position are calculated by Eqs. (11) and (12).
|
S
m
=
∫
X-
R
2
X+
R
2
1+
(
dy
dx
)
2
dx
| (11) |
|
L
m
=
R
2
+
{
y(
X+
R
2
)
-y(
X-
R
2
)
}
2
| (12) |
Figure 4 illustrates the influence of the measurement position X and area length R on measured steepness λm calculated by these equations, where the wavelength of the sheet wave is 1000 mm, and steepness is 2%. When the measurement length R is shorter than the wavelength of the sheet wave L of 1000 mm, the measured steepness λm is smaller and varies with the measurement position X. To calculate accurate steepness, the measurement length R must be determined as these errors become geometrically within acceptable range. When the measurement target is the traveling strip at hot rolling, plural measured steepness values should be averaged to minimize the influence of measurement position variation.

Figure 5 illustrates the influence of the L/R, ratio of wavelength of sheet wave L to measurement area length R, on λm,mean/λ, ratio of mean measured steepness λm,mean (which was the average of measured steepness values on plural measurement positions) to true steepness λ. When L/R is greater than 1, i.e., the wavelength of the sheet wave L is longer than the measurement area length R, mean measured steepness λm,mean is calculated to be smaller. By contrast, when the installation space for the shape meter at the exit of the finishing mill was confirmed, the possible measurement area length was approximately 1000 mm at maximum, and the wavelength of sheet wave ranged from 500 mm to 1500 mm. When the sheet wave has a wavelength of 1500 mm, i.e., L/R = 1.5, the mean measured steepness has an error of 10% at maximum, as illustrated in Fig. 5. Although the required steepness measurement accuracy is within 0.2% (two sigma) in steepness ranging from 0% to 5%, the steepness of mainly occurring sheet wave ranges from 0% to 3%. Therefore, if the measurement area length R is above 1000 mm at least, it can be concluded that measurement accuracy satisfies the requirement to be applied to the AFC.

4. LED Dot Pattern Projector
4.1. Realization of a Pattern Projector with an LED
To realize the shape meter employing the pattern projection method mentioned above, the pattern projector that can project an accurate periodic pattern on a large area, over 1000 mm in the rolling direction and over 1650 mm in the width direction, with high brightness is needed. The projected pattern must have higher brightness than the thermal radiation from the strip with the maximum temperature of 950°C. In addition, as the picked image of the strip traveling at a maximum speed of 25 m/s is not blurred, the pattern must be observed clearly using electrical exposure within few milliseconds. Furthermore, the illuminance distribution of the projected pattern must be adjustable as the image of the strip can be observed clearly without collapse of pattern by specular reflection light. The projector must meet these requirements and have long service life and durability to be used in the hot strip rolling process. However, such a projector did not exist.
In recent years, a high-brightness LED chip, called power LED, which could be supplied with an electrical current of over 1 hundred milliamperes, has been developed, and its luminous efficiency exceeds 100 lm/W.13) Because the power LED chip has the size from 0.5 mm to a few millimeters square, periodic light dot pattern can be realized by aligning many power LED chips in a grid on substrate and projecting them onto the strip surface using a projection lens. Today, to downsize electronic equipment, miniaturization of electronic substrates and high-density mounting of electronic components are allowed to progress. The small LED chip can be preciously aligned on the substrate with position accuracy of few tens of microns. By using blue power LED chips, the projected pattern is observed clearly with an exposure time of approximately 5 ms without an influence of thermal radiation ranging from red to infrared. Because this light source consists of many LED chips, reduction of the power supplied for LED chips on the portion that is observed through the specular reflection light from the strip, and collapse of the pattern is prevented.
As to the pattern projection method, the stripe pattern made of equally spaced bright line patterns are generally used as the projected pattern. Table 2 presents comparison of projected patterns; a narrow pitch strip and a wide pitch stripe whose pitch is three times wider than the narrow one, a staggered pattern employed in the developed shape meter. When hot strip surface having high specularity is measured by using the narrow pitch stripe pattern, a stripe pattern of the captured image tends to saturate and collapse at a portion where the specular reflected light of the projected pattern is observed and unstable measurement occurs. Although it is difficult for the wide pitch stripe pattern to collapse, the measurement resolution and accuracy tend to worsen. Here, a staggered pattern is proposed as a new projection pattern. It is shifted a half constant pitch of the wide pitch stripe pattern in the rolling direction with every constant pitch in the width direction. In this pattern, an average pixel density, which is averaged over twice the pattern pitch in the width direction along the shape measurement line, has the same pitch as average pixel density of the narrow pitch strip pattern. Accordingly, the staggered pattern is difficult to collapse and achieves high measurement accuracy. Furthermore, it can be realized by less LED chips because its bright area to dark area ratio is half of the narrow stripe pattern’s one.
Table 2. Comparison of the projected pattern.
Figure 6 illustrates configuration of the developed LED dot pattern projector that contains an LED light source consisting of five substrates. The light dot pattern emitted from the LED light source is enlarged and projected on the surface of the hot-rolled strip by a projection lens located in front of the light source. The area size of the projected staggered pattern is 1000 mm in the rolling direction and 1800 mm in the width direction. Illuminance distribution in width direction is adjustable by setting each substrate’s input power. Two hundred forty blue power LED chips that have a size of 0.6 mm square and a maximum output of 0.6 W/chip are aligned on each substrate in a staggered manner and are electrically wired in the rolling direction of the strip. By setting two LED chips aligned as a pair in the width direction, even when any of the LED chips fails and the LED chips connected in series cannot light up, it is possible to continue measurement as long as the adjacent LED chips are in series and without failure.

Because the maximum power of 720 W is supplied to the LED light source, it is expected that the LED chip raises its temperature by Joule heating and is broken by overheating. As a countermeasure against this, the Joule heating is radiated by a fan-cooled heat sink and minimized by intermittent lighting synchronizing an exposure of a camera with an emission of LED light source. Figure 7 illustrates reached temperatures of an LED light source operating with intermittent lighting whose condition is maximum exposure time of 8 ms and maximum frame rate of the camera of 40 Hz, as assumed on practice use, and one with continuous lighting. With continuous lighting, the temperature of the LED light source reached as high as 100°C or more even when the low input power of about 0.3 W/chip was supplied. By contrast, with intermittent lighting, the temperature reached as low as about 50°C even when a maximum power of 0.6 W (instantaneous value) was supplied; thus, failure of the LED light source due to overheating was prevented.

5. Shape Measurement System
5.1. Experimental Setup
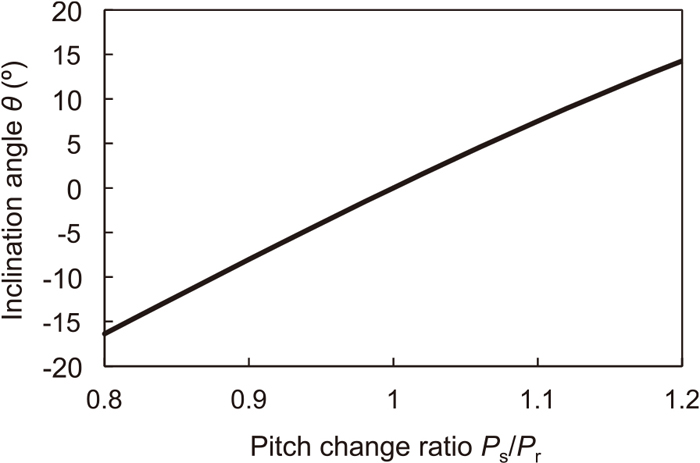
To evaluate measurement performance of the new shape meter and flatness control performance, the shape meter employing the LED dot pattern projector was installed at the exit of the hot strip finishing mill. Figure 8 illustrates the layout of the hot strip finishing mill and configuration of AFC. Figure 9 demonstrates configuration of developed shape meter. The shape meter consists of an LED dot pattern projector and two cameras. The projector projects the staggered pattern made of 1200 bright blue dots onto the hot-rolled strip surface. The charge-coupled device (CCD) cameras are placed side by side such that the field of view of each has a mutually overlapped portion, and their sensitivities is set at the ratio of 1:4 by the adjustment of the lens aperture and the gain of each camera. When a higher-sensitivity camera is partially saturated by the condition of a target strip surface, a lower-sensitivity camera’s image on the saturated portion is used for flatness analysis to ensure stable measurement. Considering the installation space at the exit of hot strip finishing mills and inclination angle measurement sensitivity, measurement geometric configuration, the pattern projection angle β of 15° and the image capture angle of 25° are decided. Figure 10 illustrates the relationship between pitch change ratio Ps/Pm and inclination angle θ (°) in this geometric configuration calculated by Eq. (6). The pitch change ratio variation of 1% corresponds to inclination angle variation of about 0.8°. The alignment accuracy of LED chips on the substrate is a few tens of microns, which is equal to 1% of the LED chip’s pitch in the rolling direction; it is assumed that the shape meter has inclination angle measurement accuracy of about 0.8°. This value can be converted into steepness of approximately 0.2% by Eq. (10), which expresses the relationship between inclination angle and steepness. A two-dimensional CCD camera with an electronic shutter, which has image pickup device with 788 pixels × 580 pixels and captures 40 images every second, is used, and its resolution is approximately 2.5 mm/pixel. The exposure time is set at 4 ms, and it captures the dot pattern images projected onto the strip through the band-pass filter that transmits only blue light with a wavelength around that of LED emission. An image-analyzing PC analyses the flatness and outputs five steepness measurements of evaluation points in the width direction to the rolling controller. This flatness analysis processing is done 15 times per second in real time. The flatness analysis processing procedure is as follows: (1) calculation of average pixel density along measurement lines; (2) pattern pitch analysis for shape calculation; (3) steepness calculation of five evaluation points in the width direction.

When it is judged that the hot-rolled strip has entered into the field of view of camera, 23 shape measurement lines (straight lines that are depicted as No. 1 to No. 23 as shown in Fig. 11) are defined. These extend along the rolling direction at 75 mm pitch in the width direction. The average pixel densities along the shape measurement lines are calculated, by averaging pixel densities over twice the pitch of the staggered pattern pitch in the width direction. In this processing, in the shape measurement line, in which the pixel density of high-sensitivity camera is regarded as saturation, the average pixel density distribution is calculated in the pattern image captured by the low-sensitivity camera. Then, the obtained averaged pixel density in the rolling direction is translated to 512 data points at equal intervals by re-sampling for Fast Fourier Transform (FFT) processing. By FFT and inverse FFT processing, the signal of the projected pattern pitch frequency is extracted. In this processing, because the reference space frequency of reference flat plate was approximately 0.05, the extract frequency range was determined as from 0.04 to 0.06 to an measure inclination angle range of within ±15°, as illustrated in Fig. 10. Figure 12 illustrates example of extraction of pattern pitch pixel density distribution of the center line from the captured image, as illustrated in Fig. 11. Figure 12(a) illustrates the pixel density along the shape measurement line, and Fig. 12(b) illustrates an FFT power spectrum of the pixel density distribution and an extraction space frequency range.

Then, the pattern pitch distributions along measurement lines are calculated by analyzing each average pixel density distributions. The average pixel density distribution fS(x) extracted within a space frequency range is represented by the following Eq. (13), since fS(x) is the pixel density composed of only a periodic dot pattern that has the phase component of ϕ(x) and the amplitude of A(x):
For the analysis of phase component ϕ(x) and amplitude A(x), a Hilbert transform can be used. The Hilbert transform is transformation from an original waveform fS(x) to a waveform fH(x) that has the same amplitude and whose phase is shifted by π/2 and represented by Eq. (14). The Hilbert transformation fH(x) from fS(x) is calculated as follows: first, calculating the space frequency density FS(k) by FFT processing of fS(x); secondly, replacing the density of the negative frequency part of FS(k) with zero; finally, obtaining the calculation result fS(x)+ifH(x) by inverse FFT processing of the space frequency density FS(k) whose negative frequency part is replaced with zero.14)
|
f
H
(x)=A(x)sin{
ϕ(x)-
π
2
}=-A(x)cosϕ(x)
| (14) |
Therefore, it is possible to determine the amplitude A(x) and phase component ϕ(x), which are as expressed in the following Formulas (15) and (16):
|
ϕ(x)=
tan
-1
{
A(x)sinϕ(x)
A(x)cosϕ(x)
}=-
tan
-1
{
f
S
(x)
f
H
(x)
}
| (15) |
|
A(x)=
{
A(x)sinϕ(x)
}
2
+
{
A(x)cosϕ(x)
}
2
=
f
S
(x)
2
+
f
H
(x)
2
| (16) |
Here, since dϕ(x)/dx, which is a differential of the phase component ϕ(x), equals a spatial frequency distribution multiplied by 2π, the pattern pitch ps(x) can be determined by the following Eq. (17):
|
P
s
(x)=2π
(
dϕ(x)
dx
)
-1
| (17) |
The inclination angle distributions along measurement lines is calculated by Eq. (6), and surface shapes of the strip are calculated by Eq. (7). In this calculation, the reference pitch pr(x), which was calculated by the same analysis as that described above on the average pixel density distribution obtained for a flat plate placed horizontally, is used.
Figure 13 illustrates an example of a calculation result of strip shape from pixel density distribution of the center line, as illustrated in Fig. 12. Figure 13(a) illustrates the pattern pitch pixel density extraction of the pattern pitch’s pixel density, and Fig. 13(b) illustrates a calculation result of pattern pitch distribution, Fig. 13(c) exhibits the strip shape.
5.2.3. Steepness Calculation of Five Evaluation Points in Width Direction
For each of 23 measurement lines, the shape measurement results are judged as either success (OK) or failure (NG). The conditions for a line to be judged as success are that the amplitude of signal calculated by Eq. (16) is higher than the threshold and that the inclination angles calculated by Eq. (6) are within appropriate range. The shape measurement lines placed outside of strip edge are obviously judged as NG. Therefore, two measurement lines, which are judged as OK and placed at most outer side, can be estimated as both edge lines of the hot-rolled strip. Then, five evaluation measurement lines, on which shape meter output steepness measurements, are decided on the basis of these edge lines, as illustrated in Fig. 12. Five evaluation measurement lines are decided as follows: two measurement lines placed at one inside of edge lines as DS_edge and WS_edge, one measurement line placed at the middle of DS_edge and WS_edge as Center, two measurement lines placed at the middle of both edge lines and Center as DS_quarter and WS_quarter. When all five measurement results at these measurement lines are judged as OK, the shape measurement processing is judged as success.
Next, strip surface length Sm and straight line length Lm along each of the five evaluation measurement lines are calculated; then, the elongation rate εm is calculated by Eq. (18). The strip surface length is calculated as the total length of poly-line with 16 segments, which approximate the strip shape, as illustrated in Fig. 13(c), to decrease the influence of noise. Since one or two points on both sides of the shape graph are discontinuity points on FFT processing and inaccurate, these points are removed. From these five elongation rates, differential elongation rates are calculated by Eq. (4) and translated to steepness by Eq. (5).
|
ε=
∑
i=1
14
P
i
P
i+1
¯
P
1
P
15
¯
-1
| (18) |
To improve reliability of the measurement, a moving average of measured steepness is calculated, and its validity is judged. For the moving average calculation, steepness measurement that was judged as success is only averaged. When a number of averaged measurements is greater than the threshold, the moving average is judged as valid. By this processing, inaccurate shape measurements that were not judged as success are removed to prevent outputting of inaccurate measurements with a lack of successful measurements. For the developed shape meter, considering the required response, moving average targets are 10 sequential measurements, and when more than 5 out of 10 measurements can be averaged, the moving average is judged as valid. The validity is transmitted to the controller of the finishing mill and the moving averaged steepness and used to prevent a wrong flatness control.
6. Experimental Results
6.1. Measurement Accuracy
After installation of the shape meter at the exit of the hot strip finishing mill, measurement accuracy of the inclination angle was evaluated by using a standard angle sample placed on the roller table. As illustrated in Fig. 14, the standard angle sample is made of a plastic sheet and has two portions in the rolling direction, A and B, at which the plastic sheet angles can be adjustable. The inclination angles set at two portions were measured with an inclinometer (measurement accuracy is 0.05°), and the difference angle between angles A and angle B was compared to the one measured by the shape meter. The steepness measurement accuracy can be evaluated from difference angle measurement accuracy because the developed shape meter calculates steepness from inclination angle distribution in the rolling direction. Figure 14 illustrates the difference between the difference angle measurement of the shape meter and the set angle values on the width center of the roller table. It is confirmed that the difference angle measurement accuracy is 0.45° with two sigma. When the strip shape is assumed as a sine wave, the difference between maximum and minimum inclination angles is proportional to the steepness, as indicated by Eq. (10). By this equation, the difference angle of 0.45° (two sigma) can be converted into the steepness of 0.13% (two sigma). Therefore, the measurement accuracy of 0.45° is better than the measurement accuracy of 0.8° that is assumed from LED chips’ alignment accuracy. It could be considered that an alignment error of LED chips and distortion of a projection lens were corrected by using the reference pitch measured for a flat plate. These results indicated that the shape meter had good measurement accuracy within required steepness measurement accuracy of 0.2% (two sigma).

The LED light source consists of five substrates. The pattern projected onto the strip surface can be adjusted as the illuminance distribution in the width direction by supplying power to each substrate. Figure 15 presents pattern images captured by the high-sensitivity camera for the hot-rolling strip that have the same material and dimension under tension. Figure 15(a) presents an pattern image when the same power is supplied to all the substrates of the LED light source. Figure 15(b) presents an pattern image when the power supplied is decreased on three substrates placed around center. The shape meter could capture the pattern image clearly without collapse by reducing the illuminance around center portion saturated with specular reflection light. By the way, because the LED light source was synchronized to two cameras with a frame rate of 40 Hz and exposure time of 5 ms, total mean power supplied to the light source is only 91.2 W (= (0.5 × 480 + 0.35 × 480 + 0.2 × 240) × 40 × 0.005). Although the shape meter can measure the strip shape on a large area, over 1000 mm in the rolling direction and over 1650 mm in width direction, this power is much lower than the power of a conventional shape meter using a brightness lump or a laser beam. It is the advantage of this method that safety measures like for a shape meter employing high-power laser equipment are not required.

Figure 16 shows evaluation result of measurement stability. The measurement success rate per coil is defined as the ratio of time length judged as valid to time length of the entire coil. For 15000 coils rolled between 3 weeks, the mean measurement success rate was 99.994%, and it was not below 98.5% in any coils. After confirming the captured images of the strips, those measurement success rates decreased; two causes were found. One of the causes was that pattern projection area was out from the view of the camera when the thin strip with the thickness of 1 mm to 2 mm unstably looped and floated at the head of the strip. The other is that saturation of intensity or lack of intensity in the captured images happened with a high-specularity surface of the strip through scale forming. Such threading of the strip and surface conditions depend on the process conditions such as rolling velocity and strip thickness and material properties. These conditions might be different for different installation hot strip mills. At the hot strip finishing mill where the shape meter installed for this evaluation test, because measurement failure was for short time duration within 1 s, the AFC is able to be resumed and continued after resumption of measurement.

Figure 8 illustrates configuration of the developed AFC. The measured steepness distribution in width direction is separated into a symmetry component and an asymmetry one. Then, the symmetry component is used for feedback control of the work roll bending, and the asymmetry component is used for feedback control of the work roll leveling. Figure 17 illustrates improvement of strip shape by F7 bender feedback control. Without control, the center buckle has been occurring until the strip head’s end reaches the coiler and the strip is held under tension. With control, the strip shape is corrected and is flattened early before stating coiling. In addition, the control result example of F7 leveling feedback control is illustrated in Fig. 18. By controlling the leveling of the F7 work rolls based on measured asymmetry components of steepness in the strip width direction, a single edge wave is also corrected and is flattened automatically. Thus, the flatness measurement results are qualitatively in agreement with the strip shape judged by visual observation. Furthermore, when dot patterns are clearly observed on captured image, the shape meter can measure the flatness of the strip. These indicated that the developed shape meter had high measurement accuracy for the hot-rolling strip at high temperature. In addition, the operation amount of feedback control by the AFC is reasonable compared with the operator’s experiences.

7. Conclusion
In recent years, to improve the fuel efficiency of automobiles by reducing their weight while maintaining their strength, the smaller-thickness and higher-strength steel sheets tend to be used as automobiles’ construction materials. For stable and accurate production of these sheets, it is crucial for these to be flattened through the hot strip rolling process. A new shape meter that employs the LED dot pattern projection method had been developed. This consists of LED dot pattern projector that can project the staggered periodic dot pattern, made of 1200 power LED chips, on the rolled strip and area camera that captures the image of a projected pattern. Then, instantaneous strip flatness is measured by analyzing the pattern pitch correlative with the inclination angle. The shape meter was installed at the hot strip finishing mill’s exit, and its measurement accuracy and stability were evaluated. As a result, its inclination angle measurement error was within 0.45 degrees (two sigma) by comparing with the set angle of a standard target, and the measured flatness of the rolling strip was consistent with the visually observed one. Its measurement success rate per entire coil was exceeded 98.5%. These results indicated that the developed shape meter would apply to the AFC. In addition, applying the measured flatness to the AFC of the work roll bender and leveling, it was confirmed that the strip flatness was improved in a short time. The developed shape meter and the AFC based on these measurements have been implemented in a real hot strip finishing mill and have contributed to improving the productivity and quality of these steel sheets.
References
- 1) Y. Isei, T. Honda, K. Kimura, Y. Yakita and Y. Buei: Tetsu-to-Hagané, 90 (2004), 902 (in Japanese). https://doi.org/10.2355/tetsutohagane1955.90.11_902
- 2) Y. Washikita, Y. Isei, Y. Buei and N. Saito: Tetsu-to-Hagané, 95 (2009), 43 (in Japanese). https://doi.org/10.2355/tetsutohagane.95.43
- 3) T. Honda, C. Uematsu, H. Tachibana, S. Nakagawa, Y. Buei, K. Sakagami, K. Kimura and H. Takahashi: ISIJ Int., 52 (2012), 841. https://doi.org/10.2355/isijinternational.52.841
- 4) S. Nakagawa, H. Tachibana, T. Honda and C. Uematsu: Trans. Soc. Instrum. Control Eng., 46 (2010), 463 (in Japanese). https://doi.org/10.9746/sicetr.46.463
- 5) S. Yanagi, A. Yamaguchi, T. Okuno and M. Kobayashi: Kobe Steel Eng. Rep., 61 (2011), No. 2, 69 (in Japanese).
- 6) R. Takahashi, T. Nunokawa and E. Takeda: Tetsu-to-Hagané, 74 (1988), 1402 (in Japanese). https://doi.org/10.2355/tetsutohagane1955.74.7_1402
- 7) N. Yamada, M. Kitahama and H. Nikaido: Kawasaki Steel Giho, 31 (1999), 155 (in Japanese).
- 8) T. Yamane, M. Saito, T. Kikuchi, R. Shimizu, K. Ueki and M. Sugiyama: CAMP-ISIJ, 2 (1989), 1540 (in Japanese).
- 9) T. Toyota, A. Ogasawara, T. Matsubara and S. Nakamura: Tetsu-to-Hagané, 70 (1984), 1071 (in Japanese). https://doi.org/10.2355/tetsutohagane1955.70.9_1071
- 10) P. Kierkegaard and L.-Å. Classon: Iron Steel Technol., 12 (2015), No. 12, 76.
- 11) K. Matsui, A. Yamamoto and H. Tachibana: Tetsu-to-Hagané, 74 (1988), 1817 (in Japanese). https://doi.org/10.2355/tetsutohagane1955.74.9_1817
- 12) M. Degner, H.-C. Mentrup, N. Holzknecht, U. Müller, G. Thiemann and D. Winter: MPT Int., 21 (1998), No. 6, 60.
- 13) K. Tsukamoto and T. Nobuhara: Koukido/Pawa LED no Katsuyou Tekunikku, CQ Publishing, Tokyo, (2008), 9 (in Japanese).
- 14) N. Mikami: Hajimete Manabu Dejitaru Firuta to Kousoku Furiehenkan, (Learning Digital Filters and Fast Fourier Transform for the Beginners) CQ Publishing, Tokyo, (2005), 171 (in Japanese).


;%0A%09%09%09newWindow.document.open();%0A%09%09%09newWindow.document.write('<img src=%22./Graphics/60_2876_tbl_2.jpg%22>');%0A%09%09%09newWindow.document.close();%0A%09%09)