Fundamentals of High Temperature Processes
Structural Evolution of Molten Slag during the Early Stage of Basic Oxygen Steelmaking
2020 Volume 60 Issue 2 Pages 212-219
Details
2020 Volume 60 Issue 2 Pages 212-219
The better understanding of structural effect of composition is of primary importance in the design of converter slag and for rationalizing the foaming performance of smelting process. In the present work, the CaO–SiO2–FexO samples with different compositions were prepared to simulate the converter slag of initial smelting stage. The compositions and structural units of slag samples were investigated by combining X-ray fluorescence spectroscopy and Raman spectroscopy. According to the results, the transformation behaviors of structural units and the degree of polymerization (DOP) of molten slag were further analyzed. The results of Raman spectra showed that when basicity increased from 0.38 to 0.97 and total iron content decreased from 32.77 to 13.26 mass%, increasing O2− led to the depolymerization of [SiO4]4− tetrahedrons from Q3 to Q0 units and the increasing [FeO4]5−/[FeO6]9− ratio. With further increasing basicity from 0.97 to 1.25, Q3 units disappeared and more O2− reacted with [FeO4]5− tetrahedrons to form [FeO6]9− octahedrons. Meanwhile, Fe3+ could probably form Si–O–Fe bond by replacing Si4+ cations in Q3 units. Overall, the depolymerization of [SiO4]4− tetrahedrons from Q3 to Q0 units was the main reason for the decreasing DOP of molten slag during the early stage of basic oxygen steelmaking.
Basic oxygen steelmaking is the most important manufacturing method used as steel primary smelting with satisfactory metallurgical quality and productivity in the world. During the primary steelmaking process, converter slag plays a crucial role in the elimination of impurity elements (desiliconization, dephosphorization and decarbonization), controlling of reaction efficiency and the smelting stability related to the active multiphase reaction among molten slag, liquid steel and gas.1,2,3) As far as the early smelting stage is concerned, the moderate foaming of converter slag is encouraged to facilitate the reaction of molten slag and improve the metallurgical safety by preventing molten slag from overflowing or splashing.4,5)
In order to modify the foaming behavior of metallurgical slag, numerous studies have been carried out. Cooper and Kitchener6) first proposed that the foam stability of molten slag could be described in terms of “foam life”. For iron-free CaO–SiO2–P2O5 slags, the research6) showed that foam life increased with increasing P2O5 content and basicity. For iron-bearing CaO–SiO2–FeO slags, Ito et al.7) showed that foam life decreased with increasing basicity, but foam life could increase when basicity was greater than 1.2. Hara et al.8) reported that the addition of P2O5, Na2O and CaF2 also contributed to increase in foam life of CaO–SiO2–FeO slags, but addition of 10 mass% MgO had no effect on foam stability. Whereas Fruehan et al.9) thought that foam life increased with increasing MgO. Although foam stability of molten slag is susceptible to be affected by its composition, the foaming behavior of molten slag is determined by melt structure in essence.
In the previous studies, the foaming behavior of molten slag was only described qualitatively on the basis of varying compositions. In order to design the converter slag with a suitable foaming capacity, structural behaviors of molten slag must be further analyzed. At present, the structural behaviors of alkali and alkaline earth metals in converter slag are explicit, e.g., calcium and magnesium mainly serve as network modifiers.10) And the structural behavior of silicon is also clear, which acts as a network former.11) However, other important components of converter slag (Fe, P and Al) perform more complicated structure behaviors. For example, the valence values of iron ions are not fixed. Even though the valence values of iron ions are identical, different structural types are formed by iron. Mysen12) and Virgo13) thought that ferric ions behaved as network formers as well as network modifiers in the SiO2–Al2O3–Fe2O3–CaO–MgO–Na2O system, and ferrous ions only existed as network modifiers. However, Cooney14) and Waychunas15) considered that, for the Na2O–FeO–SiO2 and K2O–FeO–SiO2 systems, ferrous ions were chiefly regarded as network formers, and only when divalent cations were absent, would a little ferrous ions fill the larger gaps caused by ferrous ions merging into the sites of silicate tetrahedrons.
Consequently, there is no consensus on the structures of converter slag containing Fe2+ and Fe3+. In particular, researches on the structural evolution of forming slag in the early stage of basic oxygen steelmaking have not been paid attention yet. In this study, focusing on the evolution of slag composition during the early stage of basic oxygen steelmaking process, the structural transformation behaviors in the simplified slag system of CaO–SiO2–FexO were investigated via Raman spectroscopy. The results will contribute to understand the macroscopic properties of converter slag and control metallurgical behavior.
In order to simulate componential transformation, referring to the composition of industrial converter slag during the initial smelting period and relevant literature,16,17) five sets of samples with increasing basicity and decreasing total iron content were designed. The compositions of samples are as listed in Table 1 and its distribution is shown in Fig. 1. Although FeO initially substitutes total iron content, part of FeO will be oxidized to Fe2O3 by controlling the oxygen partial pressure.18,19)
| Sample | Designed composition/Analyzed composition | Fe2O3 | Fe2+/∑Fe | Fe3+/∑Fe | Total iron | |||
|---|---|---|---|---|---|---|---|---|
| Basicity | CaO | SiO2 | FeO | |||||
| No. 1 | 0.33/0.38 | 15.00/15.41 | 40.00/40.66 | 45.00/25.57 | 18.40 | 0.65 | 0.35 | 32.77 |
| No. 2 | 0.65/0.63 | 25.00/26.37 | 40.00/41.95 | 35.00/20.02 | 12.02 | 0.69 | 0.31 | 23.98 |
| No. 3 | 0.85/0.87 | 35.00/36.94 | 40.00/42.24 | 25.00/13.71 | 7.11 | 0.72 | 0.28 | 15.64 |
| No. 4 | 1.00/0.97 | 40.00/40.56 | 40.00/41.83 | 20.00/11.99 | 5.62 | 0.74 | 0.26 | 13.26 |
| No. 5 | 1.25/1.25 | 45.00/46.27 | 35.00/37.11 | 20.00/11.51 | 5.11 | 0.75 | 0.25 | 12.53 |

Composition distribution of synthetic samples. (Online version in color.)
For the converter slag in early smelting stage, the ratio of Fe3+ to Fe2+ in FexO content ranges from 0.20 to 0.45.18) In order to make the value of Fe3+/Fe2+ within this range, a suitable oxygen partial pressure must be taken into account. Based on previous study,20) it is found that when the value of Fe3+/Fe2+ was between 0.13 and 0.16 at 1773 K in the R–Si–Fe–O system (R = K or Na), oxygen partial pressure was approximately 10−10 atm. The Ca–Si–Fe–O system in this study is similar to the above system, so the oxygen partial pressure in our experiment can be designed in terms of R–Si–Fe–O system.
The researches indicated that the iron redox state was as a function of pressure, temperature and bulk composition.13,20) Under the same condition of other factors, the Fe3+/Fe2+ ratio decreased with increasing ionic potential (Z/r) of non-framework cations and had positive correlation with oxygen partial pressure.13,18) The Z/r of K+, Na+ and Ca2+ is 0.75, 1.02, 2.00, respectively. Obviously, the Z/r of Ca2+ is larger than that of K+ and Na+, so the Fe3+/Fe2+ ratio of Ca–Si–Fe–O melt is lower than that of K–Si–Fe–O melt (namely, the Fe3+/Fe2+ ratio in the experimental sample is smaller than 0.13). Consequently, through slightly elevating the oxygen partial pressure, the Fe3+/Fe2+ ratio will increase and thereby will be controlled within the composition range of industrial slag. Therefore, the oxygen partial pressure during the preparation of sample is selected around 10−9 atm.
2.2. Samples PreparationThe samples of CaO–SiO2–FexO slag were prepared with the analytical reagents of CaO, SiO2 and Fe2C2O4∙2H2O. The FeO content was completely converted from the Fe2C2O4∙2H2O content. Before the experiment, CaO and SiO2 were calcined at 1273 K for 12 h to remove the traces of moisture and impurities. Then, the sample of 15 g was placed in platinum crucibles, which was suspended with Mo wire in the constant temperature zone of high temperature quenching furnace, as shown in Fig. 2. Thereafter, samples were heated up to a temperature of 1773 K and held at that temperature for 3 h to reach homogenization.21) During the preparation of sample, a constant flow rate of argon (0.8 L∙min−1, purity >99.9999%) was maintained. The oxygen partial pressure of gas was monitored by a ZrO2–CaO oxygen probe and was controlled about 10−9 atm. After that, crucible fell into ice water within 0.5 s by opening removable cap and loosening Mo wire.

Schematic representation of high temperature quenching furnace. (Online version in color.)
The compositions of quenched samples were analyzed by X-ray fluorescence spectrometer (S4 explorer, Germany). Yet, the iron ions in FexO were not specified as Fe2+ or Fe3+, so the values of Fe2+/∑Fe and Fe3+/∑Fe were ascertained by the direct analysis of Fe2+ using the K2Cr2O7 titration method (JIS M 8212:2005). Besides, X-ray diffraction (XRD) patterns over the range of 2θ = 0–90° were performed by X’pert PRO diffractometer (PANalytiical, Holland), which determined whether the amorphous solid state was achieved.
The quenched slags were optically analyzed using Raman spectroscopy. The Raman spectra were recorded by a multichannel modular triple Raman system (JY-HR800, France) with the excitation wave-length of 488 nm and a 1 mW semiconductor laser as light source. The measured range of frequency band was from 100 to 4000 cm−1 and the resolution of spectrum was 0.65 cm−1.
2.4 Data Processing of Raman SpectraAfter the measurement of Raman spectroscopy, raw curves were not smooth due to the presence of noise signal, and the ends of curves were not on the same horizontal line due to the fluorescence effect of Raman test. Therefore, curves should be firstly smoothed to remove the influence of noise on the accuracy of spectra, and then the baselines of curves were subtracted. The above treatment procedure is shown in Figs. 3(a)–3(c).

Data processing of Raman spectroscopy. (Online version in color.)
The processed curves were fitted using the Gaussing-Deconvolution function in the Origin 9.0 software. In our fits, band position, width and intensity were treated as independent variables. The individual deconvoluted peaks were fitted consecutively until the minimum correlation coefficient R2 > 0.99, which could be considered that the fitting result is comparatively accurate. What’s more, the characteristic peaks obtained from the Gaussian-Deconvolution result could be used to calculate the corresponding area by the integral method, as shown in Fig. 3(d). The ratio of integrated area of a characteristic peak to the sum of all the characteristic peaks could give the fraction of a specific structural unit in the molten slag. Currently, this method has been widely used by scholars in the deconvolution of Raman spectroscopy.22,23,24,25)
The analyzed compositions of quenched samples are also listed in Table 1. It shows that the compositions of SiO2 and CaO slightly deviate from the designed values. It also shows that bivalent iron and trivalent iron co-exist in slag samples. With increasing order of samples from No. 1 to No. 5, the mole ratio of Fe3+/∑Fe decreases from 0.35 to 0.26. The reason for decreasing Fe3+/∑Fe is possibly related to the varying basicity and total iron content.
There have been many studies on redox state for iron ions, and studies showed that increasing basicity could increase the value of Fe3+/Fe2+.19,21) These studies discussed the effect of basicity on iron redox state on the condition of fixing total iron content. However, in our experimental slags, both basicity and total iron content changes. Basicity increases from 0.38 to 1.25 and FeO content simultaneously decreases from 45 to 20 mass%. Mysen et al.18,26,27,28) reported that Fe3+/Fe2+ decreased with decreasing total iron content regardless of the form in which iron was added. Therefore, we thought that the decreasing addition of total iron is the main reason for the decreasing Fe3+/∑Fe ratio. Although Fe3+/∑Fe ratio has a little change, its value is still within the range of designed composition. Hence, the composition evolution of converter slags during the early stage can be represented by synthetic samples.
The phase analyses of quenched samples are shown in Fig. 4. All the XRD profiles only showed a broad peak around the diffraction angle 2θ of 30°. This is so-called hola pattern confirming that samples are amorphous.18) Hence, these glassy samples could be considered to maintain the high temperature state of melt structure, and thereby substituted the high-temperature molten slag for analyzing the microscopic structures.29,30)

X-ray diffraction pattern of the samples quenching at 1773 K. (Online version in color.)
Figure 5 presents the Raman spectra of all the investigated slags and the spectra of five slags exhibit similar spectral features. There is a weak peak at low-frequency region (LF: 400–500 cm−1) and two broad envelope peaks at intermediate-frequency region (MF: 500–780 cm−1) and high-frequency region (HF: 780–1150 cm−1), respectively.

Raman spectra of quenched samples. (Online version in color.)
In the silicate glasses, the MF envelope peak is traditionally interpreted as the convolution of the delocalized modes of vibration related to Si–O stretching and the breathing modes of four- and three-membered ring structures of [SiO4]4− tetrahedrons.31,32,33,34) The HF envelope peak is typical of NBO-bearing slags and is the most sensitive to compositions. It has been interpreted as the convolution of bands related to symmetric Si–O stretching vibrations of units with variable numbers of bridging oxygen (Qn: n being the number of BO).31,32,35,36) In addition, some studies revealed that the vibration involving Fe3+ could exist in these regions. Based on Mössbauer spectra, Mysen et al.37) suggested that Fe3+ were four-fold and six-fold coordinated cations and could form [FeO4]5− tetrahedron and [FeO6]9− octahedron in molten slag. Lucazeau et al.38) and Iordanova et al.39) showed that the bands at ~550 and ~670 cm−1 were assigned to the Fe–O stretching vibration of [FeO6]9− octahedron and [FeO4]5− tetrahedron, respectively. Genova et al.40,41) revealed that Fe–O vibration appeared in the HF envelope peak and named the band at ~970 cm−1 as “Fe3+ band”. Muro et al.42) reported that the band at ~980 cm−1 was attributed to anti-symmetric coupled mode of FeO4–SiO4 tetrahedrons.
In the present studied spectra, the MF region exhibits one broad band composed of four different peaks located at ~545, ~590, ~670 and ~710 cm−1, respectively. As the chemical composition of slags varies, the intensity of MF envelope peak gradually decreases, coinciding with the decreasing tendency of Fe2O3 from 18.40 to 5.11 mass%. Accordingly, the MF envelope peak is speculated to be associated with the Fe–O vibration aside from being related to the Si–O vibration aforementioned. According to the above investigations,37,38,39,43) the bands at ~590 and ~670 cm−1 of measured spectra can represent the [FeO4]5− tetrahedron and [FeO6]9− octahedron, respectively. The vibrational bands of Fe3+ in the MF region also have been verified in our previous studies by comparing the Raman spectra of Fe2O3-bearing glass with Fe2O3-free glass.44,45) Meanwhile, the peak width of [FeO4]5− tetrahedron and [FeO6]9− octahedron has an obvious change, indicating that the structural behavior of Fe3+ is apt to be affected by slag composition. The detailed reason will be discussed in the following section 3.4.
Furthermore, the MF envelope peak is also affected by basicity. With increasing basicity from 0.38 to 1.25, the peak intensity at ~545 cm−1 increases and the peak at ~710 cm−1 gradually disappears. The possible reason is that O2− ions dissociated from CaO can cut off the BO bond of [SiO4]4− tetrahedron, resulting in the increasing number of non-bridging oxygen (NBO). It is manifested in the gradual intense vibration of NBO bond and the gradual weakened vibration of BO bond. According to the previous researches,31,32,33,34,46) the peaks at ~545 and ~710 cm−1 are assigned to the Si–O− stretching vibration and the O–Si–O vibration of four- or three-membered [SiO4]4− ring (Q2), respectively. These assignments of Raman bands are listed in Table 2.
| Raman shift/cm−1 | Raman assignment | Reference |
|---|---|---|
| 460 | Bending vibrations of T–O–T, T = Si, Fe | 47,48,49) |
| 532–548 | Stretching vibrations of Si–O− | 31,32,33,34) |
| 592 | Symmetric stretching vibrations of [FeO6]9− | 37,38,39,43) |
| 654–675 | Symmetric stretching vibrations of [FeO4]4− | 37,38,39,43) |
| 705–729 | Vibration of O–Si–O in four- or three- membered [SiO4]4− rings (Q2) | 31,32,33,34,46) |
| 850–880 | Symmetric stretching vibrations of [SiO4]4− with NBO/Si = 4 (Q0) | 31,32,35,36) |
| 900–920 | Symmetric stretching vibrations of [SiO4]4− with NBO/Si = 3 (Q1) | |
| 950–980 | Symmetric stretching vibrations of [SiO4]4− with NBO/Si = 2 (Q2) | |
| 970–1000 | Anti-symmetric stretching vibrations of Fe–O–Si with NBO/T = 1 (Q3) | |
| 1050–1100 | Symmetric stretching vibrations of [SiO4]4− with NBO/Si = 1 (Q3) |
Concerning the HF region, the spectra show that one broad asymmetric band composed by three different peaks: a main peak located at ~855 cm−1, a shoulder on the left side at ~910 cm−1, and a shoulder on the right side at ~1000 cm−1. Along the order of designed samples, the width of HF envelope peak narrows markedly, and the left shoulder becomes progressively evident, but the right shoulder wears off and shifts toward lower frequency. The possible reason for the variation of shoulder is that inter-tetrahedral vibration mode of polymerized species has altered, which maybe [SiO4]4− tetrahedron or [FeO4]4− tetrahedron.42)
In addition, the weak band at 470 cm−1 is attributed to the bending vibration involving T–O–T bridging oxygen relative to almost stationary 4-fold coordinated cations in the TO4 units, where T refers to fourfold cations (Si4+, Fe3+).47,48,49) With the increasing order of samples, the peak intensity of T–O–T bond becomes less pronounced.
3.3. Structure and Polymerization of SiliconIn order to clarify the existence of structural units, the Raman spectra between 400 and 1200 cm−1 should be treated by the Gaussian-Deconvolution function. The curve-fitting method has been given in section 2.4. During curve-fitting, if it is assumed that the HF region is consisted of [SiO4]4− tetrahedron alone, the line parameters of Raman shift located at 780–1200 cm−1 will be assigned to ~850, ~920, ~970 and ~1050 cm−1.31,32) After the deconvolution, the non-bridging oxygen number (NBO/T) calculated by Raman spectra is slightly higher than the nominal value of NBO/T, deviating from the truth (the methods of obtaining NBO/T are expressed in the following part). Consequently, the hypothesis of line parameters is only not very comprehensive.
In order to find the more accurate line parameters, plenty of literature is further analyzed. Investigations showed that the HF region was the overlapping zone of Fe–O and Si–O vibration, and was difficult to distinguish the vibrational location of Fe3+ from the Si–O vibration of [SiO4]4− tetrahedron.35,36,40,41,42) Nonetheless, some studies42,43,46) showed that the band at ~1000 cm−1 was the vibration of Si–O–Fe bond. Consequently, during the curve-fitting process, the extra line parameters can be added at ~1000 cm−1, which represents the Si–O–Fe bond. All the assignments of Raman bands listed in Table 2 provide a straightforward reference for deconvolution. Moreover, all the Raman spectra were deconvoluted with R2 > 0.999, as shown in Fig. 6. The relative area fractions and Raman shifts of characteristic peaks obtained from deconvolution are shown in Fig. 7 and Table 3, respectively.

Deconvolution of Raman spectra over a wide wavenumber of 400–1200 cm−1. (Online version in color.)

Relative area fraction of structural units. (Online version in color.)
| Sample | Raman shift/cm−1 | ||||||||
|---|---|---|---|---|---|---|---|---|---|
| Si–O− | [FeO4]5− | [FeO6]9− | O–Si–O | Q0 | Q1 | Q2 | Q3 (Si–O–Fe) | Q3 | |
| No.1 | 551 | 586 | 669 | 771 | 862 | 914 | 964 | 1018 | 1069 |
| No.2 | 543 | 606 | 664 | 709 | 859 | 911 | 966 | 1022 | 1076 |
| No.3 | 560 | 606 | 678 | / | 858 | 914 | 958 | 1021 | 1054 |
| No.4 | 552 | 590 | 678 | / | 840 | 903 | 960 | 1007 | 1041 |
| No.5 | 561 | 587 | 672 | / | 842 | 913 | 972 | 1016 | / |
The weak changes in the intensity of Raman bands along with the weak shifts in band position can both reflect minor changes undergone by silicate bonds.46) As can be seen from Table 3, all the Raman shifts of Qn move towards lower frequency, indicating in a decline in strength of Si–O bond. The reason for shifting is that more and more NBO bonds are generated, causing the increase in low-polymerized silica tetrahedrons.
In addition, it is known from the deconvolution result that the Raman shift of Si–O–Fe bond locates at ~1010 cm−1. We speculate that there is a possibility that the Si–O–Fe bond is formed due to Si4+ of Q3 units replaced by Fe4+. Judging from the force constants, the force constant of Fe–O bond (86.3) is smaller than that of Si–O bond (225.6), so the bond length of Fe–O is longer than that of Si–O.50) When Si–O–Si bond is substituted by Si–O–Fe bond, the band of Q3 will shift towards low frequency.51) It is known from the above results that the band of Q3 containing Si–O–Fe indeed locates at lower Raman shift, indicating that our speculation is relatively reasonable.
Through further calculating NBO/T, the DOP of molten slag can be quantitatively described. Equation (1) is the calculation formulas for the experimental NBO/T (NBO/Texp) combining with deconvolution result, and Eq. (2) is the calculation formulas for the nominal NBO/T (NBO/TSi and NBO/TSi+Fe) combining with composition of Table 1.32,52) The calculation results are shown in Fig. 8.
| (1) |
| (2) |
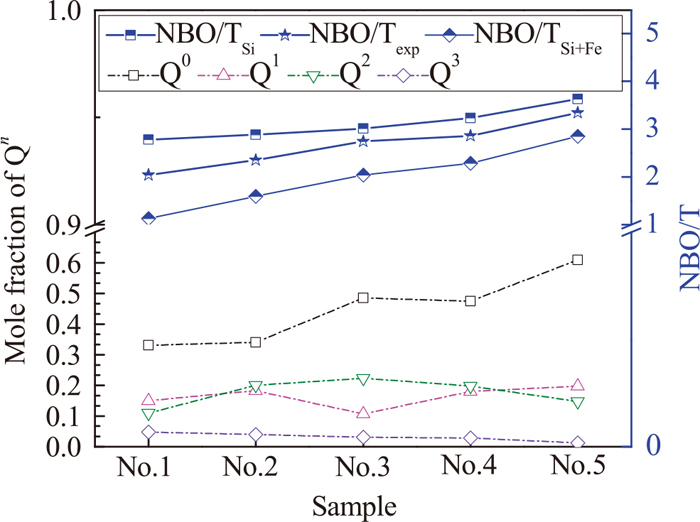
Mole fraction of Qn and NBO/T. (Online version in color.)
In Fig. 8, with the increasing order of samples, the mole fraction of Q0 increases gradually from 0.33 to 0.61 and the mole fraction of Q3 decreases from 0.05 to 0.01. Yet, the mole fraction of Q1 and Q2 fluctuates near 0.17 and 0.19, respectively. Obviously, O2− dissociated from CaO and FeO can cut off Si–O–Si bond, causing that [SiO4]4− units are dissociated.41) The depolymerization process is represented by the Eq. (3),12,53) which coincides with the depolymerization mechanism proposed by Mysen et al.12) In addition, the increasing NBO/T with increasing basicity also indicates the depolymerization of molten slag. Therefore, during the primary steelmaking process, the DOP of molten slag gradually decreases.
 | (3) |
Figure 7 shows the relative area fractions of the ferrite structures with fourfold and sixfold coordination. As basicity increases from 0.38 to 0.97 and total iron decreases from 32.77 to 13.26 mass% simultaneously (being regarded as the stage of low basicity and high iron), the relative area of [FeO4]5− tetrahedron (network former) increases continuously, whereas the relative area of [FeO6]9− tetrahedron (network modifier) decreases steadily. In this stage, the majority of O2− ions enter [SiO4]4− tetrahedron, playing the role of cutting off Si–O–Si bonds. Only a small part of O2− ions surround around Fe3+. With the increasing O2− dissociated from CaO, the ability of forming tetrahedron by Fe3+ enhances gradually, which promoted the increasing ratio of [FeO4]5−/[FeO6]9−. Although the net-like structures formed by Fe3+ increase, the depolymerization of [SiO4]4− tetrahedron is the main process. As a result, the DOP of molten slag in this stage continuously decreases. Similar results were found in the Rüssel’s research19) that larger basicity concentrations led to a better stabilization of [FeO4]5− tetrahedron.
However, with further increasing basicity from 0.97 to 1.25 and decreasing total iron content from 13.26 to 12.53 mass% (being regarded as the stage of high basicity and low iron), the relative ratio of units formed by Fe3+ has great changes. It is observed that the relative area of [FeO4]5− tetrahedron decreases significantly and the relative area of [FeO6]9− octahedron increases obviously. The possible reason for the decreasing [FeO4]5−/[FeO6]9− ratio can be explained as follows. When basicity is 0.97, NBO/Texp is 2.87, indicating that the DOP of molten slag is in the lower state. At this moment, [SiO4]4− units can only accommodate the minority of O2−, forming a circumstance that a small quantity of Fe3+ cations are encompassed by surplus O2−. In order to maintain the balance of melt, O2− will react with [FeO4]5− tetrahedron to form [FeO6]9− octahedron through Eq. (4). It results in the decreasing [FeO4]5−/[FeO6]9− ratio and favors the depolymerization of molten slag. Figure 9 describes the structural behavior of Fe3+ in silicate melt. Similar result has been reported by Bowker et al.54) who found that Fe3+ behaved primarily as a network modifier in very-low iron glasses. Vadász et al.55) also considered that the coordination of central ferric atom might be changed from tetrahedron to octahedron depending on the surplus of free oxygen ions in the complex Fe3+ anions.
| (4) |

Structural evolution of CaO–SiO2–FexO molten slag. (Online version in color.)
Based on the above results, Fe3+ coordinated with four oxygen atoms forms a [FeO4]5− tetrahedron, which acts as network former, and Fe3+ coordinated with six oxygen atoms form a [FeO6]9− octahedron which acts as network modifier. However, the vibration related to Fe2+ is not detected in Raman spectra, so Fe2+ is considered as non-framework cation, which acts as charge compensation in the molten slag.
The experimental results show that, Fe3+ in the silicate melt is ascertained to have a similar role of Al3+, which is the same as the Wang’s research.43) Referring to the role of [AlO6]9− octahedron, [FeO6]9− octahedron can modify the chain-like silicate tetrahedron, as shown in Fig. 10. When the BO bonds of [SiO4]4− tetrahedrons are cut off, NBO bonds formed can be combined with [FeO6]9− octahedrons by linking Ca2+ or Fe2+ cations.

Sketch of modifying silicate structure by [FeO6]9− octahedron. (Online version in color.)
Apart from the above structural units, another type of Fe3+ may exist in the molten slag. In Fig. 7, comparing the experimental NBO/T with the nominal NBO/T, NBO/Texp is between the NBO/TSi+Fe and NBO/TSi, namely NBO/TSi+Fe < NBO/Texp < NBO/TSi. It indicates that all the Si4+ cations form tetrahedrons taking precedence over Fe3+, but the Fe3+ cations do not form tetrahedrons completely. Investigation into NBO/Texp shows that the Fe3+ can form other species except network former. The NBO/Texp also shows that the assumption for Fe–O–Si vibration in the HF region is appropriate and counts in favor of the possible copolymerization of structural units involving Si4+ and Fe3+ cations. The Fe3+ cations can displace Si4+ cations connecting to BO in Q3 units, further forming Si–O–Fe bonds. The reaction can be expressed by Eq. (5).
| (5) |
The results of spectroscopic analysis show that the structure of molten slag can be controlled by compositional variation. Depending on the initial basicity and the addition of total iron, the DOP of molten slag can be altered. The DOP affects physical properties of molten slag, and the foaming performance of molten slag can be further modified. The converter slag designer can use the aforementioned information to produce an appropriate slag that can optimize smelting performance to attain the satisfactory metallurgical effect.
The Raman spectra of CaO–SiO2–FexO system were investigated to identify structural evolution and the DOP of molten slag during the early stage of basic oxygen steelmaking. The typical conclusions are summarized as follows:
(1) When basicity increased from 0.38 to 0.97 and total iron content decreased from 32.77 to 13.26 mass%, increasing O2− led to the depolymerization of [SiO4]4− tetrahedrons from Q3 to Q0 units and the increasing [FeO4]5−/[FeO6]9− ratio. Because the depolymerization of [SiO4]4− tetrahedrons was main reaction, so the DOP of molten slag decreased gradually in this stage.
(2) With further increasing basicity from 0.97 to 1.25, [SiO4]4− tetrahedrons were further depolymerized and Q3 units disappeared. More O2− ions reacted with [FeO4]5− tetrahedrons to form [FeO6]9− octahedrons, resulting in the decreasing [FeO4]5−/[FeO6]9− ratio. The [FeO6]9− octahedrons could play the role of modifying silicate structures, and favored the decreasing DOP of molten slag.
(3) The deconvolution of Raman spectra indicated that the existing forms of Fe3+ consisted of [FeO4]5− tetrahedron, [FeO6]9− octahedron and Si–O–Fe bond of Q3 unit. Fe3+ could act as network former and network modifier, but Fe2+ only acted as charge compensation in the molten slag.
The authors gratefully acknowledge the National key R & D Program of China (Grant No. 2017YFC0805100), the National Natural Science Foundation of China (Grant No. 51674069, 51974075) and the Fundamental Research Funds for the Central Universities of China (Grant No. N182506001).