Mechanical Properties
Strain Rate Sensitivity of Flow Stress Measured by Micropillar Compression Test for Single Crystals of 18Cr Ferritic Stainless Steel
2020 Volume 60 Issue 4 Pages 774-781

Details
2020 Volume 60 Issue 4 Pages 774-781
We have fabricated cylindrical single-crystal micropillars with different diameter (d) ranges of 2–3 µm and 5–6 µm on a specific grain in the 18Cr ferritic stainless steel with a ferrite single-phase microstructure. The initial strain rate at the onset of plastic deformation was controlled by variable loading rate in the used nanoindenter. The strain rate sensitivity of the stress required for the slip initiation were examined using the fabricated micropillars. The present compression tests addressed the shear stress on an activated single slip system of micron-scale single-crystals. Smaller-sized micropillars (d = 2–3 µm) often exhibit intermittent strain bursts. The stress for slip initiation (after an elastic loading) changes depending on the initial strain rate, resulting in a high strain rate sensitivity (m) of 0.12. Larger-sized micropillars (d = 5–6 µm) show a continuous yielding. A slight change in their yield stress depending on the initial strain rate provides a relatively low m of 0.04. It is similar to one of the millimeter-sized specimens measured by conventional tensile tests. These results provide new insights to optimize the specimen size for the micropillar compression test applied for the 18Cr ferritic stainless steels.
18Cr ferritic stainless steels are being widely used across a range of areas including architectural parts and architectural parts, household electric appliances and kitchen utensils.1,2) The stainless steels exhibit superior corrosion resistance and formability, whereas they have relatively low room temperature ductility due to their ductile-brittle transition temperature (DBTT) located around ambient temperature.1) In order to improve their ductility, trace transition metal elements (e.g. Nb and Ti) are often added in a series of the commercial ferritic stainless steels.1,2,3) In general, these transition metal elements would play a role of stabilizing trace solute interstitial elements in the ferrite (α-Fe) matrix by forming carbide and/or nitride precipitates.4,5,6,7) It has been reported that the addition of stabilizing elements often improves mechanical properties8,9) and its associated room temperature ductility.10) These general understandings can provide an assumed mechanism that the scavenging effect by added stabilizing elements might influence DBTT of the steels. DBTT can be considered responsible for varied stress levels controlled by thermally activated process of dislocation glide.11,12,13) In practical terms, 18Cr ferritic stainless steels with added stabilizing elements could contain fine carbide precipitates in the α-Fe matrix,4,5,6,7) whereby the improved ductility appears attributable to various microstructural factors including fine carbide precipitates and α-Fe matrix with reduced solute elements. The microstructural features make it difficult to identify a dominant contributor to controlling the ductility of ferritic stainless steels by using the conventional mechanical testing. Therefore, its detailed mechanism still seems unclear. In order to isolate the effect of each microstructural factor on mechanical properties, it could be required to investigate mechanical responses of the micron-scale specific regions in materials.
Micro-mechanical testing technologies using various micro-scale specimen geometries fabricated by focused ion beam (FIB) milling (including micropillars for compression tests, dog-bone shaped specimens for tensile tests and cantilevers for bending tests) have enabled us to experimentally investigate mechanical properties of small-scale areas identified in various materials.14,15,16,17) In particular, micropillar compression test14,15,16,17) is a promising approach to study the mechanical response of single-crystals of various materials with micrometer-size scale. The applications for α-Fe (bcc) single-crystals can address the determination of required stress level for slip in the α-Fe matrix of ferritic steels. This approach opens an opportunity to experimentally confirm the assumed mechanism of the improved room temperature ductility of the 18Cr ferritic stainless steels by adding the stabilizing elements. However, there are a few reports on micropillar compression tests applied for ferrous materials,18,19,20,21) regardless of various reports on single-crystal micropillars of pure bcc metals (Cr, Nb, W and Ta).22,23,24,25,26,27,28) In micro-mechanical testing, size-dependent strength of micro-scale specimens (smaller is stronger) is generally known in bcc pure metals.22,27) However, the strength of ferrous materials measured by micro-mechanical testing has been scarcely reported.20) Furthermore, the strain rate sensitivity of flow stress of ferritic steels could significantly influence the fracture toughness controlling the room temperature ductility,11,12,13) whereas there is no literature on the effect of strain rate on mechanical response of micro-scale steel specimens.
In the present study, in order to optimize the measurement conditions of micropillar compression tests applied for ferritic steels, we have examined compression responses of cylindrical single-crystal micropillars having different diameters of approximately 2 μm and 5 μm fabricated on the surface of the18Cr ferritic stainless steel. The strain rate dependence of flow stress was systematically investigated by compression tests for single-crystal micropillars at various loading rates. The flow curves of millimeter-sized specimens deformed at a wide range of strain rate was measured as well. These results were utilized to identify any features of mechanical properties of ferritic steels measured by micropillar compression tests.
In this study, an Fe–19Cr (at.%) based alloy was used as a model of conventional 18Cr ferritic stainless steels. The chemical composition of the studied steel is shown in Table 1. The steel ingot was hot-rolled to approximately 4 mm. The rolled sample was annealed at 1573 K for 1.8 ks, followed by water quench. The sample was mechanically polished and then electropolished using a mixture of phosphoric acid and citric acid at a constant current of 10 A for 600 s. The microstructure was observed by using optical microscope and scanning electron microscope (SEM). In order to identify the compression direction of micropillar specimens fabricated on the sample surface, the crystallographic orientations were determined by the electron back-scattered diffraction (EBSD) analyses.
| Cr | C | P | S | Al | N | Fe | |
|---|---|---|---|---|---|---|---|
| atomic% | 19 | 0.046 | 0.009 | 0.002 | 0.06 | 0.04 | Bal. |
| mass% | 18 | 0.01 | 0.005 | 0.001 | 0.03 | 0.01 | Bal. |
Cylindrical single-crystal micropillars with different mean diameters were fabricated within a specific grain by FIB operated at 30 kV. In order to investigate the effect of specimen size on mechanical response measured, we have prepared two series of micropillars with different diameters of 2–3 μm and 5–6 μm. In the present study, the diameter of the micropillar was used as an average value of the top and bottom diameters of the cylinder-shaped specimens fabricated.29) The resulting aspect ratio (height/cylindrical specimen diameter) approximately ranged from 2 to 4. The diameter and height of micropillar specimens were measured using SEM images. The slip traces on the micropillar surfaces after the compression test were observed by a field emission SEM.
Compression tests were performed with a nanoindenter (SHIMADZU DUH-211S) equipped with a flat-punch diamond tip with a diameter of 20 μm in a loading rate-controlled mode at ambient temperature. In the present study, compression tests were performed at different initial strain rates (εi) controlled by changing the loading rate (ΔF). Figure 1 schematically illustrate the process to control the initial strain rate,

(a) Schematic showing the applied compression test for micropillar specimens prepared on the sample surface, (b) the applied load (F) for the specimen, (c) change in the compression depth (displacement, δ) in loading and (d) change in the nominal strain (ε) in loading.
For preparing millimeter-sized specimens for tensile tests, the rolled sample was annealed at 1123 K for 600 s, and then kept at 1023 K for 7.2 ks followed by air cooling, in order to control grain size to approximately 30 μm in the α-Fe single-phase microstructure. Note that Cr-containing carbides were locally observed in the recrystallized microstructure of α-Fe matrix. The millimeter-sized specimens with a gauge length of 10 mm, a width of 2 mm and a thickness of 1 mm were cut from the annealed samples. The uniaxial tensile tests performed at various initial strain rates of 3.3 × 10⁻³, 1.0 × 100, 1.0 × 101, 1.0 × 10² s−1 at ambient temperature by using high speed material testing machine. The test for the specimen at high strain rate of 1.0 × 10³ s−1 was carried out by Hopkinson pressure bar testing machine.
Figure 2 displays optical micrograph, SEM images and EBSD orientation color map for the studied sample of 18Cr ferritic stainless steel. The sample exhibits a fully recrystallized microstructure consisting of equiaxed grains above 1 mm in grain size (Fig. 2(a)). Any precipitates were not observed even at grain boundaries in the SEM resolution level (Figs. 2(b), 2(c)), indicating α-(Fe,Cr) single-phase microstructure applied for the fabrication of single-crystal micropillars. The EBSD analyses for identified areas in low-magnification micrographs determined the orientation along the normal direction of the sample surface (Fig. 2(d)), corresponding to the compression direction for the fabricated cylindrical micropillars (Fig. 2(e)). The compression direction was measured close to a <314> direction as presented in an inverse pole figure of Fig. 2(d).

(a) Optical micrograph and (b, c) SEM images showing microstructure of the studied steel annealed at 1573 K for 1.8 ks, (d) orientation color map showing the orientation along the normal direction (according the color code of unit triangle) and (e) a representative fabricated single-crystal micropillar.
The nominal stress–strain curves of single-crystal micropillars obtained from compression tests at different initial strain rates (

Compressive nominal stress-strain curves of single-crystal micropillars with different diameter (d) ranges of (a) 2–3 μm and (b) 5–6 μm tested at various initial strain rates (
Figure 4 shows SEM images of compressed single-crystal micropillars. These images confirm the presence of macroscopic slip traces on the surface of cylindrical micropillars. The activation of a single slip system was macroscopically observed for all the specimens. On the surface of compressed micropillars with a dimeter of 2–3 μm (Figs. 4(a)–4(d)), the slip trace was localized around the top of cylindrical specimens. Parallel slip traces were observed on the middle portion of micropillars with a dimeter of 5–6 μm (Figs. 4(e)–4(h)). These trends appear independent of initial strain rate. To determine the dominant slip system activated under compression, the geometries of the compressed micropillars were analyzed using the pole figures obtained from the prior EBSD analyses. A representative result is shown in Fig. 5. The top view of the compressed micropillar indicates the displacement direction by slip (Fig. 5(a)), the tilted view micropillar provides the angle between loading axis and activated slip plane (Fig. 5(b)), and the comparison with pole figures (Figs. 5(c)–5(f)) determines the dominant slip system activated. The determined slip system predominantly operated was a [1-11] direction on a (231) plane with a high Schmid factor of 0. 45. The value corresponded to one with the second highest Schmid factor in slip systems activated in bcc metals. The fixed slip system operated was observed in all compressed micropillars, which was independent of the micropillar diameter and the initial strain rate. The determined Schmid factor can provide the shear stress for slip initiation (yielding) using the measured stress–strain curves of micropillars.
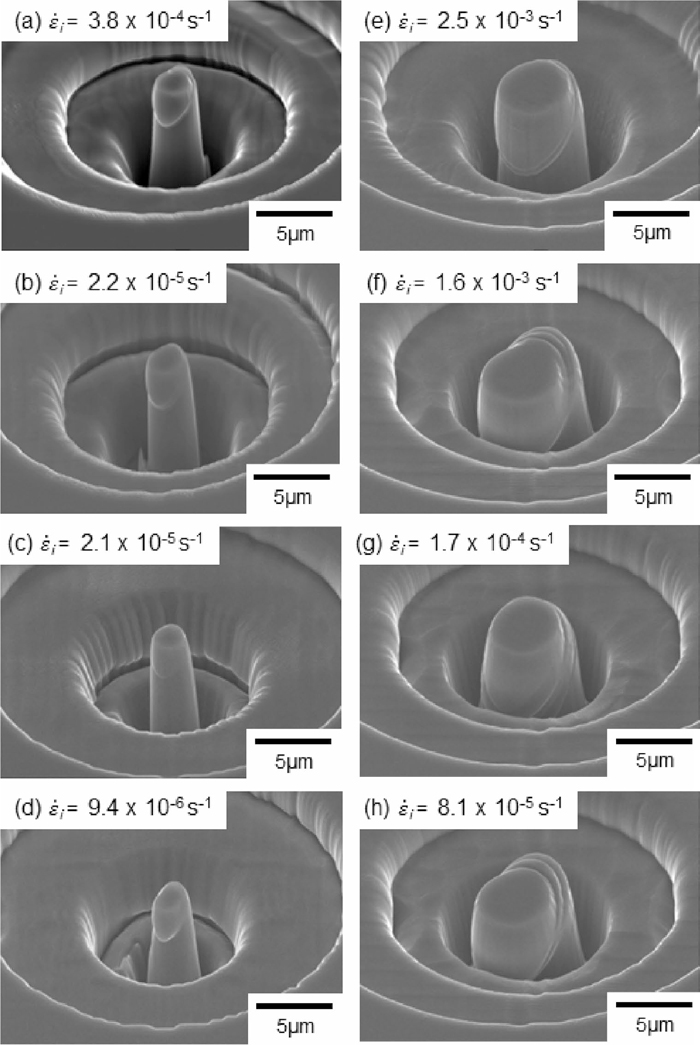
SEM images showing single-crystal micropillars with different diameters (d) compressed at different initial strain rates (

(a) top view and (b) 45°-tilted view of a compressed single-crystal micropillar and the corresponding (c) 111, (d) 011, (e) 112 and (f) 123 pole figures for the determination of the activated slip system.
Figure 6 shows the changes in stress for the slip initiation (σi) and stress at a strain of 3% (σ3%) of micropillars with different diameters (d) as a function of initial strain rate (

Changes in (a) stress for initial slip (σi) and (b) stress at 3% strain (σ3%) of single-crystal micropillars with different diameters (d) as a function of initial strain rate (
Figure 7 presents the nominal stress–strain curves of millimeter-sized specimens with a with a polycrystalline microstructure at various strain rates (

Nominal stress-strain curves of millimeter-sized specimens of the 18Cr steel tensile-tested at different strain rates. The arrowheads indicate the maximum stress in yielding (upper yield stress).
This study demonstrates the strain-rate sensitive compression response of the single-crystal micropillars fabricated on the sample surfaces of the 18Cr ferritic stainless steel (Fig. 3). The activated single slip system was found independent of the specimen size and strain rate (Figs. 4 and 5). The observed strain-rate sensitive strength could be responsible for varied shear stress required for the slip initiation. The result is in good agreement with a general mechanism for dislocation glide in bcc metals.31) One of intriguing results in this study is the different strain-rate sensitive strength depending on the diameter of micropillar (Fig. 6(a)), suggesting an anomalous deformation mechanism in micron-scale. To quantify the strain-rate dependency of stress for the slip initiation, the strain rate sensitivity32) (m) can be evaluated using experimentally measured values of stress for the slip initiation (σi) and initial strain rate (
| (1) |

Change in the stress for initial slip (σi) measured in micropillars with different diameters (d) as a function of initial strain rate (
In the present study, to discuss the size-dependent strain-rate sensitivity (m) observed in the single-crystal micropillars of the 18Cr ferritic stainless steel, the activation volume33,34) can be considered in terms of the thermal activation process for controlling the dislocation motion (and nucleation in micron-scale volume) using a relation between strain rate (
| (2) |
| (3) |

Activation volumes (v*) of single-crystal micropillars and millimeter-sized specimens plotted as a function of (a) temperature and (b) normalized temperature by melting temperature, together with those of pure bcc metal micropillars23,26) and the varied activation volume of pure Fe36) (millimeter-sized specimen).
The measured v* for the smaller micropillars (d = 2–3 μm) appears relatively high, as compared with the previously reported v* of various bcc metal micropillars (Fig. 9(a)). In a sufficiently large crystal volume (in millimeter-sized specimens), the nucleation rate of the double-kink is considered reduced at lower temperature,36) resulting in a reduced v* associated with a thermal-activated process for the dislocation motion in bcc metals. The temperature dependence of v* for pure iron is presented in Fig. 9(a). It can be therefore assumed that the thermal-activated process could be reduced at lower temperature in a small crystal volume (micropillars with diameters below 3 μm) as well. In order to confirm the assumption, these v* values were summarized as a function of test temperature (room temperature: 293 K) normalized with respect to the melting temperatures of each bcc metal and alloy (Tm). The summarized result is shown in Fig. 9(b). It is obvious that the v* value becomes lower at normalized test temperature, which is indicative of the temperature-dependence of the thermal-activated process for dislocation motion in micron-scale.
There is still an issue about the mechanism of the low activation volume (v*) in micron-scale bcc metals and alloys (Fig. 9). The observed intermittent strain bursts in the micropillars with d = 2–3 μm (Fig. 3(a)) may characterize the plastic flow of micro-sized single-crystals. The underlying mechanism of the size-dependent strength and its associated flow curve are generally explained by dislocation multiplication on the basis of truncation of single-arm dislocation sources37,38,39) and dislocation starvation at the nanoscale.15) In these models, the distance of dislocation line from a pin (e.g. immobile dislocation segments) to the specimen surface as the effective dislocation source length may control the stress level required for the dislocation multiplication.37,38,39) In case of a limited crystal volume of bcc metals, one of thermal activation processes for the movement of screw dislocations might be a kink formation interacted with the specimen surface required for the dislocation multiplication in micron-scale.27) However, its detailed mechanism still remains unclear. Thus, further characterizations for dislocations inside the compressed micropillars of the 18Cr ferritic steel by transmission electron microscopy will be required to understand the low activation volume observed in micron-scale bcc crystals.
The present study demonstrated the compression response and its strain rate sensitivity of cylindrical single-crystal micropillars having different diameters (d) of 2–3 μm and 5–6 μm, which were fabricated on the surface of the18Cr ferritic stainless steel with a fully recrystallized microstructure. These results were utilized to discuss the mechanism of dislocation motion in a micron-scale volume in conjunction with the flow curves of millimeter-sized specimens at various strain rates. The following conclusions were drawn from our results and discussion.
(1) The micropillar compression test for the 18Cr ferritic steel can address the shear stress required for the slip initiation on an activated single-slip system of α-(Fe,Cr) single-crystals.
(2) Smaller-sized micropillars (d = 2–3 μm) often exhibit intermittent strain bursts in plastic deformation. The stress for slip initiation changes depending on the initial strain rate, which provides a low activation volume (v*) of approximately 18 b3. The low v* corresponds well to previous results on micropillars of various pure bcc metals.
(3) Larger-sized micropillars (d = 5–6 μm) exhibit a continuous yielding after an elastic loading. The yield stress slightly changes depending on the initial strain rate, which provides a relatively high v* of approximately 50 b3. The v* is similar to one of the millimeter-sized specimens measured by conventional tensile tests. The result can provide an insight to optimize the critical specimen size for the micropillar compression test applied for the 18Cr ferritic steel.
We gratefully acknowledge the supports from the JSPS KAKENHI (grant number 17H03411).