2. Experimental
The gas-liquid metal and the gas-liquid metal-nitride equilibration experiments were carried out to determine the N solubility and solubility product of TiN or AlN in liquid iron alloys containing Cr, Ti, Al and Si, respectively. Five hundred grams of high purity electrolytic iron was melted in an Al2O3 crucible (outer diameter (OD): 56 mm, inner diameter (ID): 50 mm, height (H): 96 mm) using a 15 kW/30 kHz high frequency induction furnace, and the melt temperature was directly measured by a Pt/Pt-13 mass%Rh thermocouple sheathed with an 6 mmOD alumina tube immersed in the melt. After the melt temperature was reached to a desired value, the Ar-10%H2 gas was blown onto the melt surface at a high flow rate of ~2 L/min to deoxidize the melt. After 2 hours of gas blowing, the oxygen content in the melt decreased to a value less than 20 mass ppm, and then the gas was switched to a mixture of N2 and Ar-10%H2 gases to keep the aimed nitrogen partial pressures. The flow rate of the gas mixture was 1 L/min. Detailed descriptions of the experimental apparatus and procedure are available in the authors’ recent study.7,9)
The simultaneous effects of two different alloying elements on N in liquid iron were determined by measuring the N solubility in Fe–Cr–Ti, Fe–Cr–Si, Fe–Ti–Al and Fe–Cr–Al melts at 1823–1873 K. After confirming the equilibrium N solubility in pure liquid iron under various nitrogen partial pressures from 0.03 to 0.1 atm, high purity Cr (99.95%purity), Ti (99.995%purity), Si (99.99%purity) or Al (99.99%purity) shots were added to liquid iron through an 18 mmOD quartz tube. After each alloy addition, a new equilibrium value of the N content was attained within 1 hour. This was confirmed by the sampling and in-situ analysis of N at 15 min intervals.
As a verification experiment, the N solubility in a multi-component Fe–Cr–Ti–Al–Si–N system of typical ferritic stainless steel were also measured as a function of melt temperature. After the equilibrium N solubility was attained for a Fe-18 mass%Cr-0.3 mass%Al-0.2 mass%Si alloy melt at 1823 K under a nitrogen partial pressure of 0.01 atm, Ti was added repeatedly up to 0.4 mass% while the melt temperature was increased to 1923 K.
The solubility product of TiN or AlN in Fe–Cr–Ti, Fe–Ti–Al and Fe–Cr–Al alloy melts was also measured by the addition of alloying elements after the formation of the nitride phases. For the Fe–Cr–Ti and Fe–Al–Ti systems, Ti shot was first added in pure liquid iron until a TiN layer was formed on the surface of the melts under a given nitrogen partial pressure. The formation of TiN in the melt could be confirmed by a sharp decrease in N content in the melt checked by the in-situ analysis of metal samples during the experiment. Then, Cr or Al shots were added repeatedly at 1823–1873 K. After each addition, a new TiN solubility equilibrium was attained within 1 h. For the Fe–Cr–Al and Fe–Ti–Al systems, Al shots were first added in pure liquid iron until a AlN layer was formed on the surface of the melt, and then Cr or Ti shots were added at 1823 K.
The metal sample of about 10 g was extracted by a 4 mmID quartz tube connected to a syringe (10 ml), and it was quenched rapidly in ice water. The metal samples were carefully cut for the chemical analysis. Cr, Ti, Al and Si in the metal sample were analyzed by the inductively coupled plasma atomic emission spectroscopy (ICP-AES, SPECTRO ARCOS) using appropriate standard solutions containing the same amount of Fe as the sample solutions. The analytical limit of the alloying elements in the metal sample was 5±1 mass ppm. The N and O contents in the metal sample were analyzed by the nitrogen/oxygen analyzer (LECO TC-600) with an accuracy of ±2 mass ppm.
3. Results and Discussion
3.1. N Solubility in Fe–Cr–Ti–Al–Si–N Alloy Melts
The dissolution of N in liquid iron alloys can be written as
|
1
2
N
2
(g)=
N
_
Δ
G
1
°
=3 598+23.89 T J/mol
| (1) 12) |
|
K
N
=
f
N
[%N]
p
N
2
1/2
| (2) |
where
KN is the equilibrium constant for Reaction (1) and, [%N] is the equilibrium N content in mass%,
fN is the Henrian activity coefficient of N for which the reference state is the infinitely dilute solution,
i.e.,
fN → 1 when [%N] → 0.
pN2 is the nitrogen partial pressure in atm over the melt surface.
The activity coefficient of N, fN in Fe–Cr–Ti–Al–Si–N melt can be expressed by Wagner’s formalism11) as the following relation using the interaction parameters:
|
log
f
N
=log
K
N
-log[%N]+
1
2
log
p
N
2
=
∑
i=Cr,Ti,Al,Si
e
N
i
[%i]+
∑
i=Cr,Ti,Al,Si
r
N
i
[%i]
2
+
∑
i,j=Cr,Ti,Al,Si
i≠j
r
N
i,j
[%i][%j]
| (3) |
where
e
N
i
and
r
N
i
, respectively, are the first- and second-order interaction parameters of elements on N in liquid iron.
r
N
i,j
is the second-order cross-product parameter on N in liquid iron which indicates the simultaneous effect of two different alloying elements (
i and
j) on the activity coefficient of N in liquid iron. The self-interaction parameter of N in liquid iron,
e
N
N
and
r
N
N
are known to be zero.
13) Thus,
r
N
N,i
was also assumed to be zero in the multicomponent system. The effect of O on N can be negligible at the O content less than 20 mass ppm for the present experimental condition.
In the authors’ recent studies, the
e
N
i
and
r
N
i
values (i = Ti, Al, Cr and Si) have been determined over the wide range of melt composition and temperature under the various pN2. In Fe–Ti–N and Fe–Al–N systems, the N solubility was successfully described using only first-order interaction parameter,
e
N
Ti
and
e
N
Al
, respectively (
r
N
Ti
= 0 and
r
N
Al
= 0) before the formation of nitride.4,5) On the other hand, in Fe–Cr–N and Fe–Si–N systems, both first- and second-order interaction parameters (
e
N
Cr
,
r
N
Cr
e
N
Si
and
r
N
Si
) were required to reproduce the N solubility at high alloying concentration region up to 30 mass%Cr and 12 mass%Si, respectively.3,6) These basic parameters of N determined in the authors’ recent studies3,4,5,6) were adopted for the extension of system. The parameters used and determined in this study are summarized in Table 1. As mentioned earlier, the existence of the
r
N
i,j
value in the higher-order system can affect the accuracy of prediction for both N solubility and nitride solubility product. Therefore, in the present study, the second-order cross-product effects (
r
N
Cr,Ti
,
r
N
Cr,Si
,
r
N
Ti,Al
and
r
N
Cr,Al
) were determined by measuring the N solubility in Fe–Cr–Ti, Fe–Cr–Si, Fe–Ti–Al and Fe–Cr–Al alloy melts over the wide concentration range. The experimental results are summarized in Table 2. Al contents in Fe–Cr–Ti and Fe–Cr–Si melts equilibrated in alumina crucible were less than 10 mass ppm. The effect of such small Al content can be neglected. In the authors’ recent study,4) the effect of crucible material (Al2O3 and MgO) on the N solubility and TiN solubility product in Fe–Ti melt was checked, and it was confirmed that the Ti–N relation in liquid iron was not affected by the crucible material.
Table 1. Interaction parameters of alloying elements in liquid iron used in the present study.
| System | Interaction parameter | Value (1873 K) | Temp.(K)/[%i] range | pN2 (atm) | Ref. |
|---|
| Fe–Cr–N |
e
N
Cr
| −147.8/T + 0.019
(−0.06) | 1873–1973
[%Cr] < 30 | 0.015–0.97 | 3 |
|
r
N
Cr
| −2.58/T + 0.0021
(0.0007) |
| Fe–Ti–N |
e
N
Ti
| −0.21 | 1823–1973
[%Ti] < 0.52 | 0.05–0.3 | 4 |
|
r
N
Ti
| 0 |
|
e
Ti
Ti
| 0.048 |
|
r
Ti
Ti
| 0 |
| logKTiN | −12740/T + 4.06
(−2.742) |
| Fe–Al–N |
e
N
Al
| 0.017 | 1823–1973
[%Al] < 4.5 | 0.2–1 | 5 |
|
r
N
Al
| 0 |
|
e
Al
Al
| 0.043 |
|
r
Al
Al
| 0 |
| logKAlN | −15850/T + 7.03
(−1.434) |
| Fe–Si–N |
e
N
Si
| 0.047 | 1823–1873
[%Si] < 13 | 0.4–0.8 | 6 |
|
r
N
Si
| 0.0013 |
| Fe–Cr–Ti–N |
r
N
Cr,Ti
| 0 | 1823
[%Cr] < 14, [%Ti] < 0.083 | 0.03–0.08 | Present study |
|
e
Ti
Cr
| 406.7/T − 0.1933
(0.024) | 1823–1923
[%Cr] < 30, [%Ti] < 1.5 | 0.01–0.05 | 7 |
|
r
Ti
Cr
| −20.6/T + 0.011
(0) |
| Fe–Cr–Al–N |
r
N
Cr,Al
| −0.003 | 1823–1873
[%Cr] < 30, [%Al] < 1.0 | 0.04 | Present study |
|
e
Al
Cr
| 0.017 | 1823–1973
[%Cr] < 26, [% Al] < 3.2 | 0.1–0.5 |
|
r
Al
Cr
| 0 |
| Fe–Cr–Si–N |
r
N
Cr,Si
| 0 | 1823
[%Cr] < 20, [%Si] < 1.4 | 0.09 | Present study |
| Fe–Ti–Al–N |
r
N
Ti,Al
| 0 | 1823
[%Ti] < 0.066, [%Al]< 0.28 | 0.1 | Present study |
|
e
Ti
Al
| −0.024 | 1823–1973
[%Ti] < 0.55, [%Al] < 1.6 | 0.1–0.2 |
|
r
Ti
Al
| 0 |
|
e
Al
Ti
| −0.011 | 1823
[%Ti] < 0.14, [%Al] < 2.0 | 0.1 |
|
r
Al
Ti
| 0 |
| Fe–Ti–Si–N |
r
N
Ti,Si
| 0 | 1823–1873
[%Ti] < 0.083, [%Si] < 2.3 | 0.05–0.1 | 10 |
|
e
Ti
Si
| −0.038 | 1823–1923
[%Ti] < 0.36, [%Si] < 2.2 | 0.1–0.7 |
|
r
Ti
Si
| 0 |
| Fe–Al–Si–N |
r
N
Al,Si
| 0 | 1823–1873
[%Al] < 1.1, [%Si] < 1.8 | 0.1–0.3 | 6 |
|
e
Al
Si
| 0.037 | 1823–1923
[%Al] < 1.7, [%Si] < 1.5 | 0.3–1 |
|
r
Al
Si
| 0 |
Table 2. N solubility in Fe–Cr–Ti, Fe–Cr–Si, Fe–Ti–Al and Fe–Cr–Al melts.
| System | Temp. (K) | pN2 (atm) | [%Cr] | [%Ti] | [%Al] | [%Si] | [%N] | [%O] |
|---|
| Fe–Cr–Ti–N | 1823 | 0.03 | 2.65 | 0 | 0 | 0 | 0.0109 | 0.0008 |
| 2.78 | 0.02 | 0 | 0 | 0.0110 | 0.0012 |
| 2.71 | 0.03 | 0 | 0 | 0.0109 | 0.0015 |
| 2.74 | 0.05 | 0 | 0 | 0.0111 | 0.0015 |
| 2.65 | 0.07 | 0 | 0 | 0.0115 | 0.0014 |
| 2.82 | 0.08 | 0 | 0 | 0.0114 | 0.0008 |
| 0.08 | 14.51 | 0 | 0 | 0 | 0.0699 | 0.0026 |
| 14.57 | 0.02 | 0 | 0 | 0.0701 | 0.0031 |
| 14.25 | 0.04 | 0 | 0 | 0.0712 | 0.0026 |
| 14.21 | 0.05 | 0 | 0 | 0.0724 | 0.0027 |
| Fe–Cr–Si–N | 1823 | 0.09 | 4.70 | 0 | 0 | 0.03 | 0.0257 | 0.0021 |
| 4.79 | 0 | 0 | 0.15 | 0.0257 | 0.0018 |
| 4.71 | 0 | 0 | 0.25 | 0.0258 | 0.0012 |
| 4.72 | 0 | 0 | 0.35 | 0.0255 | 0.0014 |
| 9.57 | 0 | 0 | 0.39 | 0.0442 | 0.0020 |
| 9.63 | 0 | 0 | 0.50 | 0.0430 | 0.0018 |
| 9.50 | 0 | 0 | 0.60 | 0.0417 | 0.0014 |
| 9.52 | 0 | 0 | 0.69 | 0.0416 | 0.0015 |
| 14.77 | 0 | 0 | 0.66 | 0.0695 | 0.0024 |
| 14.62 | 0 | 0 | 0.84 | 0.0682 | 0.0025 |
| 14.71 | 0 | 0 | 0.94 | 0.0676 | 0.0018 |
| 14.61 | 0 | 0 | 0.90 | 0.0672 | 0.0021 |
| 19.69 | 0 | 0 | 1.04 | 0.107 | 0.0028 |
| 19.60 | 0 | 0 | 1.15 | 0.105 | 0.0025 |
| 19.56 | 0 | 0 | 1.34 | 0.103 | 0.0026 |
| 19.61 | 0 | 0 | 1.43 | 0.104 | 0.0026 |
| Fe–Al–Ti–N | 1823 | 0.1 | 0 | 0.02 | 0.28 | 0 | 0.0136 | 0.0009 |
| 0 | 0.03 | 0.28 | 0 | 0.0134 | 0.0014 |
| 0 | 0.04 | 0.28 | 0 | 0.0137 | 0.0013 |
| 0 | 0.05 | 0.28 | 0 | 0.0137 | 0.0011 |
| 0 | 0.07 | 0.27 | 0 | 0.0138 | 0.0008 |
| Fe–Cr–Al–N | 1823 | 0.1 | 9.38 | 0 | 0 | 0 | 0.0446 | 0.0018 |
| 14.00 | 0 | 0 | 0 | 0.0726 | 0.0014 |
| 14.09 | 0 | 0.13 | 0 | 0.0725 | 0.0013 |
| 13.66 | 0 | 0.20 | 0 | 0.0724 | 0.0011 |
| 13.50 | 0 | 0.26 | 0 | 0.0710 | 0.0009 |
| 18.52 | 0 | 0.33 | 0 | 0.1080 | 0.0009 |
| 18.01 | 0 | 0.33 | 0 | 0.1070 | 0.0011 |
| 17.55 | 0 | 0.70 | 0 | 0.1050 | 0.0008 |
| 1873 | 0.04 | 8.92 | 0 | 0 | 0 | 0.0279 | 0.0008 |
| 8.80 | 0 | 0.19 | 0 | 0.0278 | 0.0016 |
| 8.88 | 0 | 0.41 | 0 | 0.0272 | 0.0016 |
| 16.38 | 0 | 0.34 | 0 | 0.0575 | 0.0015 |
| 16.25 | 0 | 0.55 | 0 | 0.0563 | 0.0011 |
| 23.09 | 0 | 0.49 | 0 | 0.0862 | 0.0017 |
| 22.61 | 0 | 0.66 | 0 | 0.0908 | 0.0017 |
| 29.55 | 0 | 0.55 | 0 | 0.1337 | 0.0013 |
| 28.70 | 0 | 0.87 | 0 | 0.1497 | 0.0022 |
| 28.50 | 0 | 1.00 | 0 | 0.1490 | 0.0016 |
| Fe–Cr–Ti–Al–Si–N | 1823 | 0.01 | 18.39 | 0 | 0.29 | 0.37 | 0.0365 | 0.0020 |
| 18.27 | 0.04 | 0.29 | 0.37 | 0.0373 | 0.0011 |
| 1873 | 18.45 | 0.07 | 0.29 | 0.41 | 0.0350 | 0.0016 |
| 18.43 | 0.10 | 0.29 | 0.38 | 0.0346 | 0.0005 |
| 18.46 | 0.14 | 0.28 | 0.38 | 0.0357 | 0.0019 |
| 1923 | 18.89 | 0.14 | 0.29 | 0.37 | 0.0330 | 0.0019 |
| 18.50 | 0.17 | 0.28 | 0.36 | 0.0333 | 0.0010 |
| 18.31 | 0.21 | 0.28 | 0.38 | 0.0337 | 0.0014 |
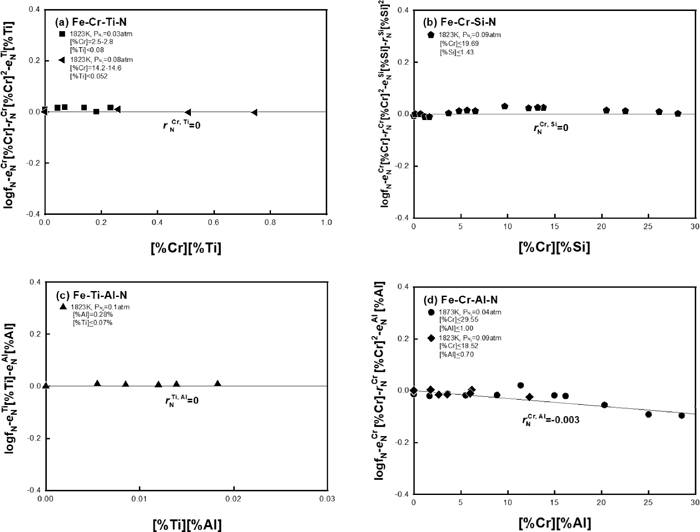
Using the relation shown in Eq. (3), the second-order cross-product parameters on N in liquid iron,
r
N
i,j
can be determined from the N solubility data by plotting the relation of
log
f
N
-
e
N
i
[%i]-
r
N
i
[%i]
2
vs. [%i][%j] as shown in Fig. 1. All data points showed the excellent linear relationships and the
r
N
i,j
values can be determined from the slopes of the data. Therefore, the values of
r
N
Cr,Ti
,
r
N
Cr,Si
,
r
N
Ti,Al
and
r
N
Cr,Al
were determined as 0, 0, 0 and −0.003, respectively, by the regression analysis. Under the assumption of regular solution property, the value of
r
N
Cr,Ti
,
r
N
Cr,Si
and
r
N
Ti,Al
can be also neglected as zero at other temperatures in the multicomponent systems. No temperature dependence was observed for the non-zero value,
r
N
Cr,Al
in the temperature range from 1823 to 1873 K.
Using all parameters used and determined in the present study for the Fe–Cr–Ti–Al–Si–N system, the N solubility in the multicomponent alloy melts can be calculated at various compositions and temperatures by the following relation obtained from Eq. (3):
|
log[%N]=log
K
N
-
e
N
Ti
[%Ti]-
e
N
Al
[%Al]
-
e
N
Cr
[%Cr]-
r
N
Cr
[%Cr]
2
-
e
N
Si
[%Si]-
r
N
Si
[%Si]
2
-
r
N
Cr,Al
[%Cr][%Al]+
1
2
log
p
N
2
| (4) |
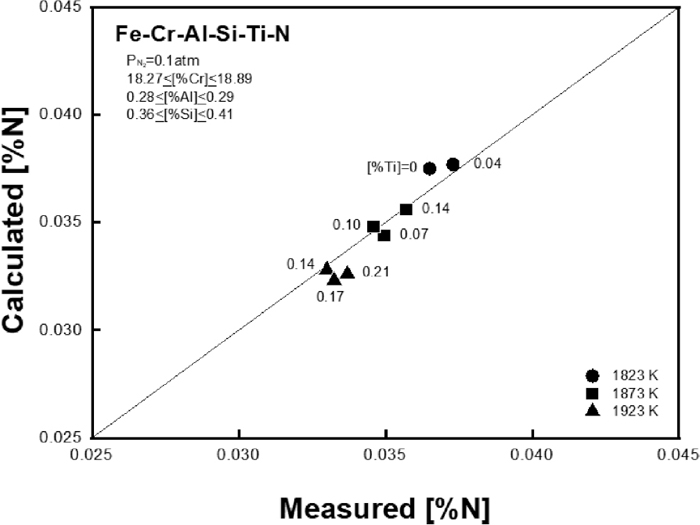
In order to check the validity of interaction parameters determined in the present study, a verification experiment was carried out by measuring the N solubility in Fe-18 mass%Cr-0.3 mass%Al-0.4 mass%Si–Ti melt under a nitrogen partial pressure of 0.01 atm. The N solubility was measured by adding Ti in the melt with increasing temperature from 1823 to 1923 K at every 50 K. The experimental results are also summarized in Table 2. Figure 2 compares the experimental results of N solubility with the predicted values in the melt as a function of Ti content at different temperatures. The present result reproduces the N solubility successfully over the wide temperature range from 1823 to 1923 K.
3.2. Nitride Formation in Fe–Cr–Ti–Al–Si–N Alloy Melts
Ti and Al can form their nitride phases such as TiN and AlN, respectively, at critical concentrations in Fe–Cr alloy melt at a given nitrogen content. The effect of Cr on the solubility product of those nitrides in liquid iron has been measured in the temperature range from 1873 to 1973 K by the authors’ previous studies.7,8) However, a description of the solubility product of nitrides at lower temperature range near the melting point of Fe–Cr alloys is needed for more accurate prediction of the nitride formation during cooling and solidification. For this purpose, the solubility product of nitride phases in Fe–Cr–Ti, Fe–Al–Ti and Fe–Cr–Al systems were measured at 1823–1873 K to clarify the temperature dependence of the nitride formation reactions in Fe–Cr–Ti–Al alloy melt. The experimental results of TiN and AlN solubility product in the melts were summarized in Table 3, and they are plotted in Figs. 3 and 4 together with the authors’ previous results at higher temperatures.
Table 3. Solubility product of nitride formed in Fe–Cr–Ti, Fe–Al–Ti and Fe–Cr–Al melts.
| System | Temp.(K) | pN2 (atm) | [%Cr] | [%Ti] | [%Al] | [%Si] | [%N] | [%O] | Nitride saturation |
|---|
| Fe–Cr–Ti | 1823 | 0.03 | 2.80 | 0.25 | 0 | 0 | 0.0062 | 0.0012 | TiN |
| 2.72 | 0.40 | 0 | 0 | 0.0040 | 0.0016 | TiN |
| 3.65 | 0.39 | 0 | 0 | 0.0044 | 0.0008 | TiN |
| 10.93 | 0.30 | 0 | 0 | 0.0085 | 0.0007 | TiN |
| 16.02 | 0.26 | 0 | 0 | 0.0127 | 0.0016 | TiN |
| 20.75 | 0.22 | 0 | 0 | 0.0181 | 0.0011 | TiN |
| 23.39 | 0.16 | 0 | 0 | 0.0256 | 0.0019 | TiN |
| Fe–Ti–Al | 1823 | 0.1 | 0 | 0.09 | 0.28 | 0 | 0.0128 | 0.0008 | TiN |
| 0 | 0.09 | 0.65 | 0 | 0.0135 | 0.0008 | TiN |
| 0 | 0.10 | 1.10 | 0 | 0.0120 | 0.0012 | TiN |
| 0 | 0.11 | 1.57 | 0 | 0.0120 | 0.0016 | TiN |
| 0.1 | 0 | 0 | 1.68 | 0 | 0.0097 | 0.0006 | AlN |
| 0 | 0.05 | 1.92 | 0 | 0.0088 | 0.0008 | AlN |
| 0 | 0.06 | 1.94 | 0 | 0.0089 | 0.0010 | AlN |
| 0 | 0.10 | 1.87 | 0 | 0.0095 | 0.0029 | AlN |
| 0 | 0.12 | 1.91 | 0 | 0.0098 | 0.0011 | AlN |
| 0 | 0.14 | 1.96 | 0 | 0.0091 | 0.0021 | AlN |
| 1873 | 0.1 | 0 | 0.21 | 0 | 0 | 0.0085 | 0.0011 | TiN |
| 0 | 0.26 | 0.29 | 0 | 0.0072 | 0.0007 | TiN |
| 0 | 0.28 | 0.58 | 0 | 0.0067 | 0.0008 | TiN |
| 0 | 0.34 | 0.86 | 0 | 0.0060 | 0.0002 | TiN |
| 0 | 0.41 | 1.16 | 0 | 0.0054 | 0.0013 | TiN |
| 0 | 0.48 | 1.48 | 0 | 0.0048 | 0.0016 | TiN |
| Fe–Cr–Al | 1823 | 0.09 | 16.91 | 0 | 0.99 | 0 | 0.0906 | 0.0015 | AlN |
| 17.72 | 0 | 1.24 | 0 | 0.0746 | 0.0017 | AlN |
| 0.48 | 0 | 0 | 1.34 | 0 | 0.0141 | 0.0009 | AlN |
| 4.83 | 0 | 0.98 | 0 | 0.0340 | 0.0006 | AlN |
| 9.56 | 0 | 0.45 | 0 | 0.1110 | 0.0010 | AlN |
| 14.36 | 0 | 0.44 | 0 | 0.1653 | 0.0013 | AlN |
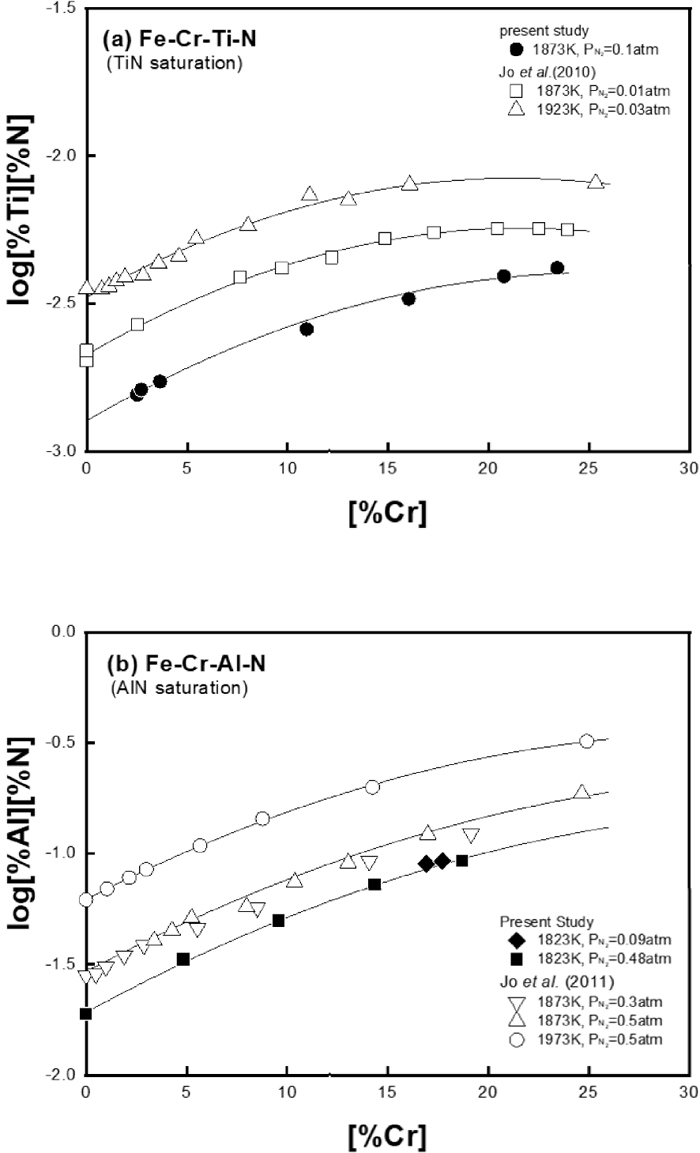
Figure 3 shows the effects of Cr on TiN and AlN solubility product in liquid iron, respectively, at different temperatures. Both solubility products of TiN and AlN increased with the addition of Cr. As shown Figs. 3(a) and 3(b), the present results of TiN and AlN solubility product measured at 1823 K have good correlation with data measured by the authors’ recent studies7,8) at higher temperatures.
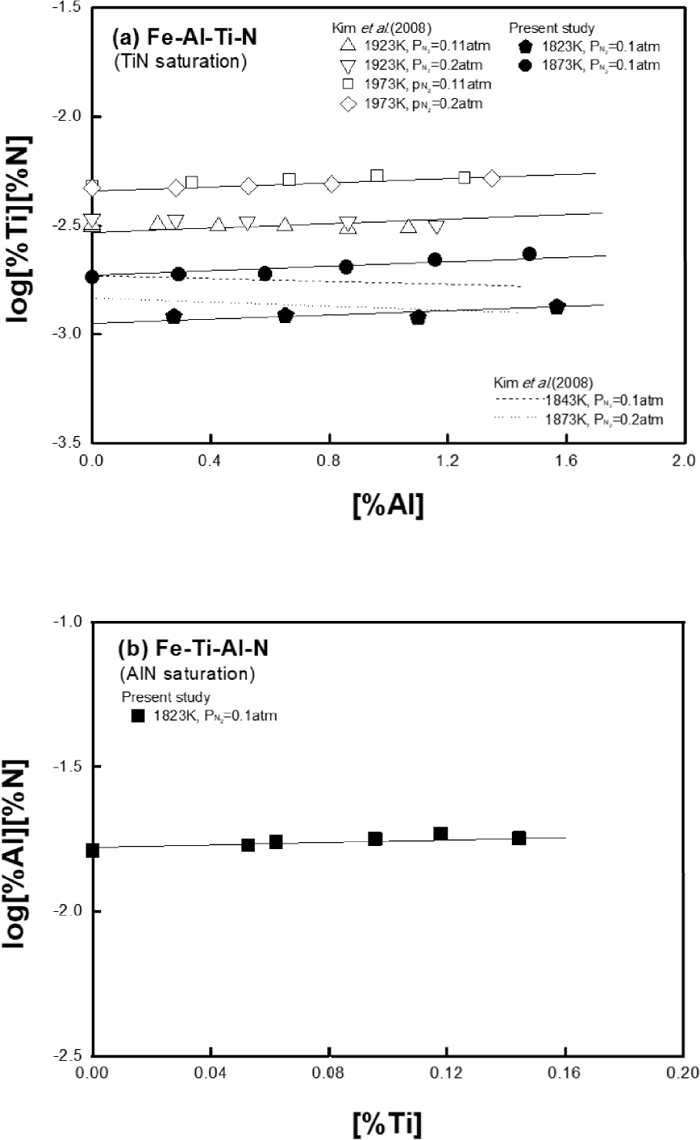
Figure 4(a) shows the effect of Al addition on TiN solubility product in liquid iron at different temperatures. In authors’ previous study,9) the effect of Al on TiN solubility product was different at high and low temperatures as shown in the figure. The discrepancy at low temperatures was already discussed and revised elsewhere for the Fe–Ti–N ternary system.4) Therefore, in the present study, the effect of Al on TiN solubility product in liquid iron was restudied at 1823 and 1873 K and compared with the authors’ previous data in Fig. 4(a). Also, the effect of Ti on AlN solubility product was measured at 1823 K as shown in Fig. 4(b) to check if the interaction between Ti and Al in liquid iron is consistent regardless of type of nitride phase formed in the same alloy system.
In order to thermodynamically analyze the formation of TiN and AlN in Fe–Cr–Ti–Al–Si–N alloy melts, the following equilibrium reactions for the dissolution of pure solid TiN and AlN in liquid iron were considered with the Gibbs energy of each reaction determined in the authors’ recent studies.4,5)
|
TiN(s)=
Ti
_
+
N
_
Δ
G
TiN
°
=244 500-77.7 T J/mol
| (5) 4) |
|
log
K
TiN
=log
h
Ti
h
N
a
TiN
=log
f
Ti
+log
f
N
+log[%Ti][%N]
| (6) |
|
AlN(s)=
Al
_
+
N
_
Δ
G
AlN
°
=303 500-134.6 T J/mol
| (7) 5) |
|
log
K
AlN
=log
h
Al
h
N
a
AlN
=log
f
Al
+log
f
N
+log[%Al][%N]
| (8) |
where
KTiN and
KAlN are the equilibrium constant for Reactions (5) and (7),
hTi,
hAl and
hN are the Henrian activities of Ti, Al and N relative to the 1 mass% standard state in liquid iron, and
fTi,
fAl and
fN are the activity coefficients of Ti, Al and N, respectively. TiN and AlN formed in the melts were identified as a pure solid stoichiometric TiN and AlN by the XRD analysis.
7,8) Therefore, the activity of TiN and AlN in
Eqs. (6) and
(8) is unity under the present experimental conditions.
At a given temperature, the solubility product of TiN and AlN, log[%Ti][%N] and log[%Al][%N] in Eqs. (6) and (8) depends on fTi, fAl and fN values in liquid steel. For an Fe–Cr–Ti–Al–Si–N melts, those activity coefficients can be expressed as the following relations using the Wagner’s formalism.11)
|
log
f
Ti
=
e
Ti
Ti
[%Ti]+
e
Ti
N
[%N]+
e
Ti
Al
[%Al]
+
e
Ti
Si
[%Si]+
e
Ti
Cr
[%Cr]+
r
Ti
Cr
[%Cr]
2
| (9) |
|
log
f
Al
=
e
Al
Al
[%Al]+
e
Al
N
[%Al]+
e
Al
Ti
[%Ti]
+
e
Al
Si
[%Si]+
e
Al
Cr
[%Cr]+
r
Al
Cr
[%Cr]
2
| (10) |
|
log
f
N
=
e
N
Ti
[%Ti]+
e
N
Al
[%Al]+
e
N
Si
[%Si]
+
r
N
Si
[%Si]
2
+
e
N
Cr
[%Cr]+
r
N
Cr
[%Cr]
2
+
r
N
Cr,Al
[%Cr][%Al]
| (11) |
where
e
Ti
i
,
r
Ti
i
,
e
Al
i
and
r
Al
i
are the first- and second-order interaction parameters of element,
i on Ti and Al, respectively. Only the
r
N
Cr,Al
value was additionally considered for the
fN calculation in the multicomponent system since the
r
N
Cr,Ti
,
r
N
Cr,Si
,
r
N
Ti,Si
,
r
N
Ti,Al
and
r
N
Al,Si
values have been determined as zero by the present study and the authors’ recent works.
6,10) Using
Eqs. (5),
(6),
(7),
(8),
(9),
(10),
(11), the specific effect of alloying elements on Ti or Al in liquid iron can be determined by plotting the known values against the alloying concentration.
Figure 5 shows the value of
log
f
Ti
Cr
plotted vs [%Cr] in Fe–Cr–Ti–N melts using the experimental data measured in the present study at 1823 K. The values of
e
Ti
Cr
and
r
Ti
Cr
can be determined as 0.03 and −0.0003, respectively, by the regression analysis of the data at 1823 K. These values are good agreement with the temperature dependence of
e
Ti
Cr
(= 406.7/T − 0.1933) and
r
Ti
Cr
(= −20.6/T + 0.011) determined at higher temperature range from 1873 to 1973 K by the authors’ recent study.10) The values determined in the present study agree fairly well with the previously reported values.14,15,16,17,18) However, those values have been measured only at 1873 K.
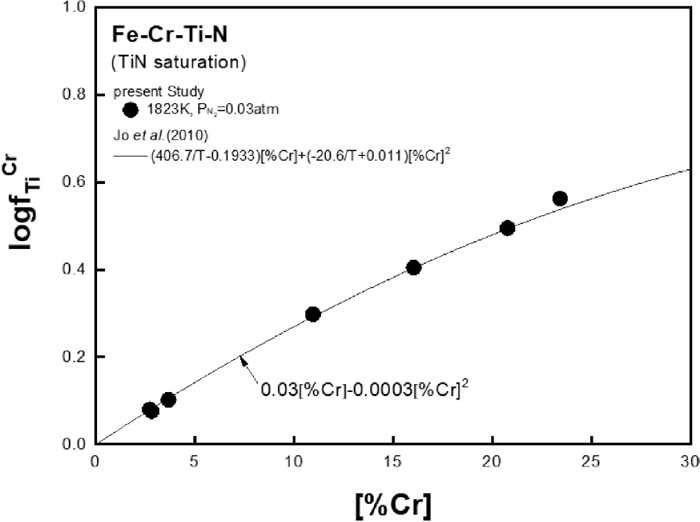
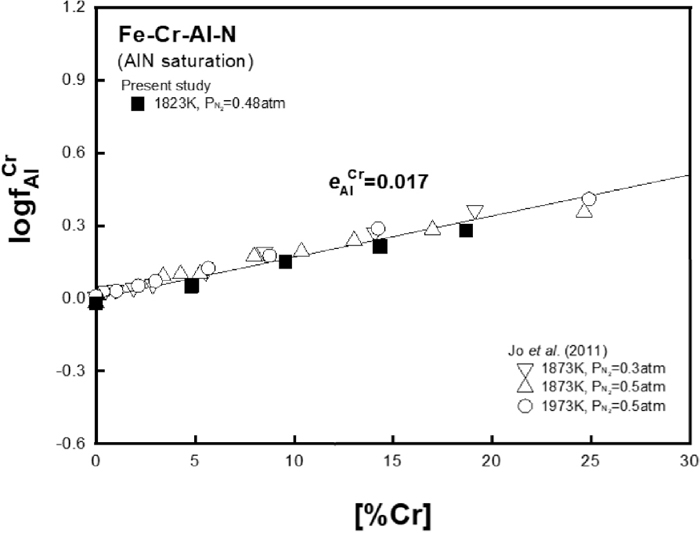
Figure 6 shows the value of
log
f
Al
Cr
plotted vs [%Cr] in Fe–Cr–Al–N melts using the experimental data measured in the present study at 1823 K and the authors’ recent study8) at 1873–1973 K. The present experimental results at 1823 K show an excellent correlation with the higher temperature data at 1823 to 1973 K, and the effect of temperature was negligible. The values of
e
Al
Cr
and
r
Al
Cr
can be determined as 0.017 and 0, respectively, by the regression analysis of the data in Fig. 6. In authors’ recent study,8) the
e
Al
Cr
value was determined as 0.0122 without considering the second-order cross-product parameter of
r
N
Cr,Al
= −0.003 determined in the present study.
The
e
Al
Cr
value has been reported by several groups. Wada and Pehlke19) determined the first- and second-order interaction parameters of
e
Al
Cr
,
r
Al
Cr
and
e
Al
Cr,Al
in liquid iron at 1873 K as 0.028, 0.0003 and −0.011, respectively by measuring the AlN solubility product in Fe–Cr melt using the Sieverts’ method. However, the Sieverts’ method has an inherent experimental error by vaporization and condensation of metal with the side-chemical reactions.12) Moreover, the simultaneous effect of Cr and Al on N in liquid iron was not considered in the multicomponent system for their work. The
e
Al
Cr
values have been also determined by measuring the effect of Cr on the Al deoxidation equilibria in liquid iron by McLean and Bell,20) Kishi et al.,21) Ohta and Suito22) and Lee et al.23) as 0.025 (1996 K), 0.012 (1873 K), 0.0096 (1873 K) and 0.0001 (1823–1923 K), respectively. The inconsistency of the reported
e
Al
Cr
values by deoxidation equilibria in liquid iron could be attributed to relatively big scattering of the O analysis by the secondary oxide inclusions formed during solidification of iron samples as well as the activity change of alumina after the dissolution of Cr in to the corundum structure.23) On the other hand, the metal/nitride/gas equilibration technique enabled us to stably determine the interaction parameters between alloying elements under the unit activity condition of nitride saturation.
Figure 7 shows the value of
log
f
Ti
Al
plotted vs [%Al] in Fe–Al–Ti–N melts using the experimental results measured in the present study at 1823–1873 K with higher temperature data measured by the authors’ recent study.9) The present results at 1823–1873 K show an excellent linear relationship with the previous experimental data at 1923–1973 K. The values of
e
Ti
Al
and
r
Ti
Al
can be determined as −0.024 and 0, respectively, by the regression analysis of the data. The temperature dependence of
e
Ti
Al
value was neglected within the experimental errors over the wide temperature range from 1823 to 1973 K.
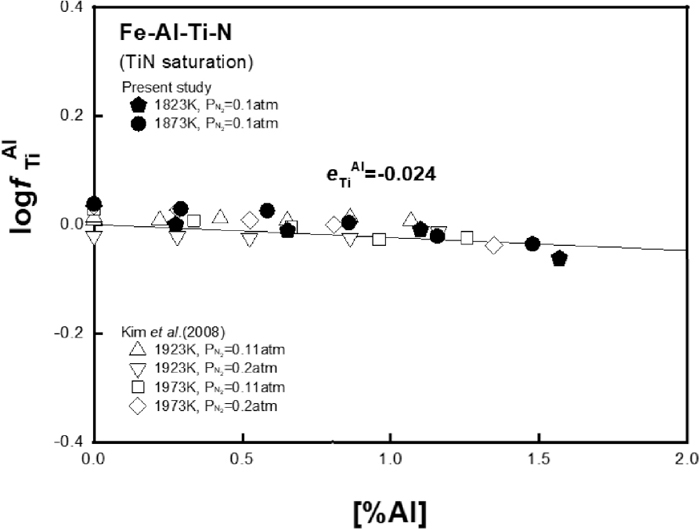
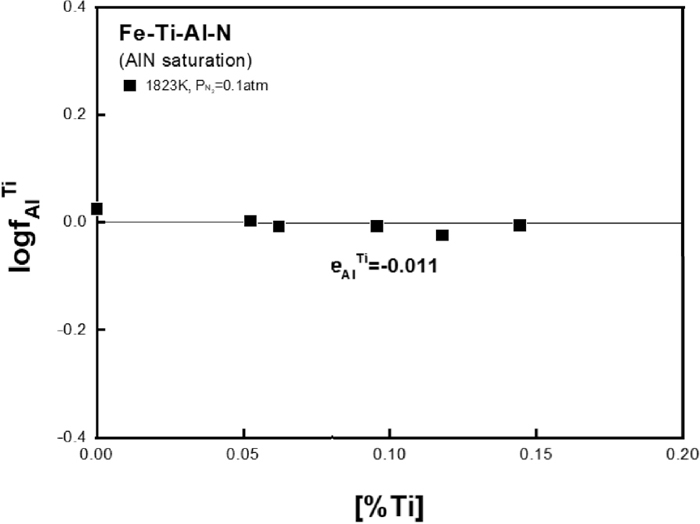
Figure 8 shows the
log
f
Al
Ti
vs [%Ti] in Fe–Ti–Al–N melts at 1823 K. The values of
e
Al
Ti
and
r
Al
Ti
can be determined as −0.011 and 0, respectively. As mentioned earlier, this experimental data under AlN saturation can be used to verify the accuracy of the
e
Ti
Al
value determined by TiN saturation. According to the reciprocal relationship of interaction parameters derived by Lupis and Elliott,24) the first-order interaction parameter of Ti on Al,
e
Al
Ti
can be converted to that of Al on Ti,
e
Ti
Al
in liquid iron by the following equation:
|
e
j
i
=
M
j
M
i
e
i
j
+
M
i
-
M
j
230
M
i
| (12) |
where
Mi is the molecular weight of component
i.
The value of
e
Al
Ti
= −0.0011 determined by the Ti addition under the AlN saturation in liquid iron can be converted to −0.023 using Eq. (12). This value corresponds very well with
e
Ti
Al
= −0.024 under the condition of TiN saturation.
The interaction parameters determined in the present study were summarized in Table 1 along with all parameters used in this study. Using the parameters, one can calculate the contour lines of critical Ti and N contents for the onset of TiN inclusion formation in Fe–Cr–Ti–Al–Si–N alloy melt as functions of melt composition and temperature. As shown in Fig. 9, the TiN solubility diagram for a commercial ferritic stainless steel composition of Fe-18 mass%Cr-0.3 mass%Al-0.3 mass%Si–Ti alloy was constructed at the different temperatures from 1823 to 1923 K. Figure 9 can be used for quick check of critical N and Ti content to avoid the formation of TiN in the ferritic stainless steels. This type of diagram can be also predicted for different temperatures, nitrogen partial pressures, and composition to track the nitride formation during the steelmaking process of ferritic stainless steels.
4. Conclusions
In the present study, the effect of cross-products of alloying elements on nitrogen in liquid Fe–Cr–Ti–N, Fe–Cr–Si–N, Fe–Ti–Al–N and Fe–Cr–Al–N melts were determined at 1823–1873 K. By taking into account the simultaneous effects determined in the present study, the interaction parameters among Cr, Al and Ti were newly determined. These parameters could be used to accurately predict the N solubility and solubility product of TiN and AlN in multicomponent Fe–Cr–Ti–Al–Si system. The main findings of this study can be summarized as follows:
(1) The second-order cross-product effects of alloying elements on nitrogen in Fe–Cr–Ti, Fe–Cr–Si, Fe–Ti–Al and Fe–Cr–Al alloy melts were determined as:
r
N
Cr,Ti
= 0 (Cr ≤ 14.57 mass%, Ti ≤ 0.08 mass%)
r
N
Cr,Si
= 0 (Cr ≤ 19.70 mass%, Si ≤ 1.43 mass%)
r
N
Ti,Al
= 0 (Ti ≤ 0.07 mass%, Al ≤ 0.28 mass%)
r
N
Cr,Al
= −0.003 (Cr ≤ 29.55 mass%, Al ≤ 1.0 mass%)
(2) The first- and second-order interaction parameters of alloying elements on Ti and Al in Fe–Cr–Ti, Fe–Ti–Al and Fe–Cr–Al alloy melts were determined as:
e
Ti
Cr
= 406.7/T − 0.1933,
r
Ti
Cr
= −20.6/T + 0.011 (Cr ≤ 23.39 mass%, Ti ≤ 0.40 mass%)
e
Ti
Al
= −0.024,
r
Ti
Al
= 0 (Ti ≤ 0.48 mass%, Al ≤ 1.57 mass%)
e
Al
Ti
= −0.011,
r
Al
Ti
= 0 (Ti ≤ 0.15 mass%, Al ≤ 1.96 mass%)
e
Al
Cr
= 0.017,
r
Al
Cr
= 0 (Cr ≤ 18.67 mass%, Al ≤ 1.34 mass%)