Ironmaking
Forming Behavior of Fine Particulate Matters during Iron Ore Sintering Process
2020 Volume 60 Issue 8 Pages 1649-1654
Details
2020 Volume 60 Issue 8 Pages 1649-1654
Iron and steelmaking process, especially the iron ore sintering process is regarded as a major fixed generation source of PM2.5. This study aims to obtain fundamental knowledge on the grain size and chemical composition of PM2.5 formed during sintering process. A laboratory-scale sintering simulator was used to simulate the iron ore sintering process, and a part of the outlet gas was introduced to a cascade impactor to collect the PM2.5 in particle size stepwise. Concentration of PM in the outlet gas became highest when the admixing ratio of CaO was set at 20 mass%, and it appears that there are two different formation patterns of PM in different size. Obtained PM with the particles size from 0.25 to 2.5 µm were composed of hematite, calciumferrite and some gangue materials. The liquidus temperature of CaO (20%) - Fe2O3 is lower than the maximum sintering bed temperature and therefore iron oxides in the melt tend to be reduced at coke surface promote to form CO bubbles. Then the bubbles move to the melt surface and burst forming many fine droplets. PM with the particles size less than 0.25 µm contains sulfates of Na, K and Ca in addition to hematite and calciumferrite. When coke containing a certain sulfur was replaced by graphite, the major components of the formed PM (−0.25 µm) was chlorides of Na and K.
PM2.5 is defined as particulate matters (PM) having a mass median aerodynamic diameter less than 2.5 μm. It has been concerned that it causes inflammation of respiratory system and contamination of blood, since it is directly taken into our lungs and tends to stay in its depths.1) Sedimentation speed of PM2.5 in air is quite low and therefore it becomes a serious transboundary pollution. For example, it was reported that about 70% of PM2.5 observed in Kyushu Region in Japan was originated from the East Asian continent.2) Various combustion processes used in thermal power stations, heating boilers and so forth are pointed out as the typical anthropogenic sources. Steelworks is one of major fixed generation sources of PM, and especially the iron ore sintering process occupies more than 40% of the total value.3) Generally, electrostatic precipitators (EP) have been equipped in the sintering machines, but the extraction ratio of PM2.5 by EP is not usually sufficient.4)
There have been several reports on the composition of PM2.5 discharged from the sintering machine. According to such reports, their major elements are Fe, Ca, Si and Al with certain number of water-soluble ions such as K+, SO42− and Cl−.5,6,7,8) In addition, heavy metal elements like Pb and unburnt carbons were also contained.7,8) Gan et al.9) made sinter-pot tests to examine primary factors for the generation of fine PM. They reported that main generation stages of fine PM are those just after the ignition and the end period of sintering. Further, they found that the major elements are Fe and Ca in the former stage and Cl, K and S in the latter stage. It suggests that some un-granulated fine particles are liberated and discharged in the early stage, while volatile compounds descend with the cycle of vitalization and condensation and discharged at the end stage of sintering. PM2.5 discharged from the sintering process show complicated composition due to a number of raw materials including different kinds of recycle materials. It is essential to understand the formation route of different type of fine particles in detail in order to deal with environmental regulations to be more severe in future.10)
This study aims to obtain fundamental knowledge on the formation rate and structure/composition of PM2.5 formed in the course of sintering process. A series of experiments was conducted using a sintering simulator under the condition varying the mixing ratios and existence states of coke and limestone in the raw materials.
Compositions and particle sizes of iron ore, limestone, coke and graphite used in the sintering experiment was listed in Table 1. Iron ore and limestone was screened to be less than 0.15 mm in particle size. Coke and graphite were screened in the size range between 1.68 and 2.36 mm after crushing, respectively.
| Chemical composition (mass%) | Particle size (mm) | |||||||||
|---|---|---|---|---|---|---|---|---|---|---|
| FC | T.Fe | T.S | T.K | T.Na | SiO2 | Al2O3 | CaO | MgO | ||
| Ore | – | 68.04 | <0.01 | <0.01 | <0.01 | 1.32 | 0.74 | 0.01 | 0.01 | −0.15 |
| Limestone | – | 0.09 | <0.01 | 0.02 | <0.01 | 0.26 | 0.09 | 54.85 | 0.64 | −0.15 |
| Coke | 88.5 | 0.43 | 0.65 | 0.05 | 0.06 | 5.95 | 2.97 | 0.24 | 0.1 | 1.68–2.36 |
| Graphite | 99.99 | – | – | – | – | – | – | – | – | 1.68–2.36 |
S-type granules11) were prepared by granulating the mixture of the fine materials around coke or graphite particles used as nuclei (see Fig. 1). The granulation was carried out with the addition of splayed water by using a small disc pelletizer. The granules with the alumina ball nuclei, called “ACP”, were also prepared to control the total mixing ratios of coke/graphite and other materials. Moisture content and mass ratios of adhering layer materials and coke/graphite were evaluated as follows: A part of the granulated sample was weighed (Mr), then dried at 105°C and weighed again (Mr1) to obtain moisture content. The dried sample was put on the sieve of 1.68 mm and washed to remove all the adhered fine materials. Remained coke particles were dried and their weight (Mr2) was measured.
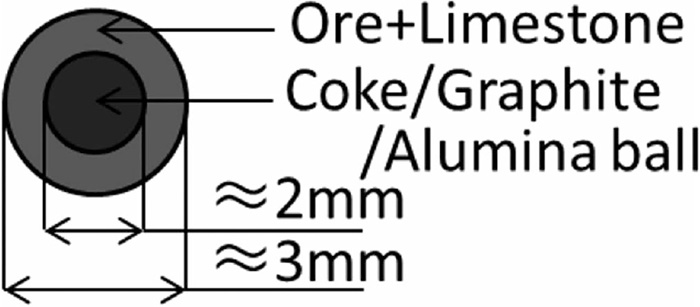
Constitution of S-type granule sample.
Moisture content of the granule samples was calculated by Eq. (1)
| (1) |
| (2) |
| (3) |
| Sample name | Nucleolus particle | Fe2O3 mass% | CaO mass% |
|---|---|---|---|
| CaO (0%) | Coke | 100 | 0 |
| CaO (10%) | Coke | 90 | 10 |
| CaO (20%) | Coke | 80 | 20 |
| Single coke CaO (20%) | Alumina Ball (Coke charged without adhering layer) | 80 | 20 |
| Graphite CaO (20%) | Graphite | 80 | 20 |
| ACP CaO (0%) | Alumina Ball | 100 | 0 |
| ACP CaO (10%) | Alumina Ball | 90 | 10 |
| ACP CaO (20%) | Alumina Ball | 80 | 20 |
Figure 2 shows the outline of the sintering simulator used in the experiment. It consists of two vertical electric heaters of 300 mmH and alumina reaction tube of 35 mm in inside diameter. Gas flow rates of N2 and O2 were controlled by mass flow controllers, respectively. The gas was introduced to the top of the reaction tube and flowed across the packed bed of the granules and discharged from the bottom. The outlet gas was introduced to an infrared gas analyzer for CO and CO2 concentration measurement and a cascade impactor for the sampling of fine particles with the gas rates of 1 and 9 L/min, respectively. The cascade impactor (SKC, Sioutas Cascade Impactor) used in this experiment collects the particles having different mass median aerodynamic diameters in stepwise, i.e., 2.5 (A), 1.0 (B), 0.5 (C) and 0.25 μm (D), and then finally filtrates the particles finer than 0.25 μm (E) by membrane filter.
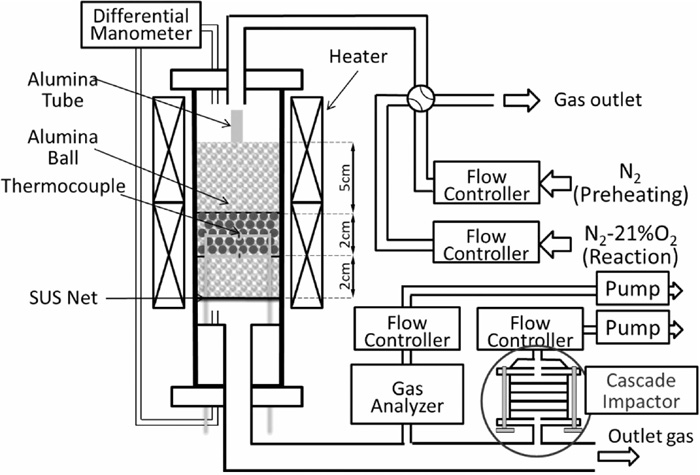
Schematic diagram of the sintering simulator.
Prepared S-type granules and ACP samples were charged to be a packed bed of 35 mm in diameter and 20 mmH. The packing densities of the fine material mixture and coke/graphite were fixed at 365 kg/m3 and 75 kg/m3, respectively. The alumina ball packed beds of 50 and 20 mmH were placed over and under the sample bed to preheat the inlet gas and to prevent the flow-down of melted sample, respectively. The center and bottom temperatures of sample bed were measured by JIS-R thermocouples.
The sample bed was preheated up to 900°C under N2 flow of 0.45 Nm/s in linear velocity. Then, the gas was changed to N2–O2 (21 mol%) with the same velocity to start the combustion of coke/graphite. Bed temperatures and CO and CO2 concentrations were continuously measured and fine PM contained in outlet gas were sampled by the cascade impactor during the experiment about 2.5 min.
2.3. Evaluation of PM SamplesThe generated amount of fine PM was estimated by measuring the difference of filter weights between before and after the combustion experiment. Distribution of major elements were obtained as follows: EDX mappings were made for ten positions of each sample, from center to periphery of each filer. The data within 2% of the standard deviation were adopted for further examination. Fine PM collected by filter (E), −0.25 μm, were submitted to the morphological observation and elemental analysis by SEM-EDX after the liberation treatment using ethanol.
Figure 3 shows the effect of admixing ratio of CaO on the average concentration of PM in the outlet gas. There is no significant difference in the total concentration between the cases of 0 and 10 mass% addition of CaO. While, it considerably increased when CaO admixing ratio increased to 20 mass%. Concentration of PM (−0.25 μm) is the greatest for all the cases, but PM of 0.25–2.5 μm becomes significantly large. By increase in CaO from 0 to 20 mass%, concentration of PM (−0.25 μm) increased by 1.8 times and that of PM 0.25–2.5 μm increased by about 5 times. Figure 4 shows the concentrations of several elements in PM obtained for the case of CaO 20 mass%. SEM-EDX element mappings were made for 10 random microscopic views for each filter that collected PM of different size ranges. The results were averaged for different elements and converted to concentration by the weight changes of each filter, and the standard deviations calculated for each element were shown as the error bars. Fe and Ca tend to be contained in larger particles. Gangue minerals such as Al and Si show similar trends and are distributed in the particles less than −0.25 μm. These results suggest that the PMs of 0.25–2.5 μm and −0.25 μm were generated under different mechanisms.
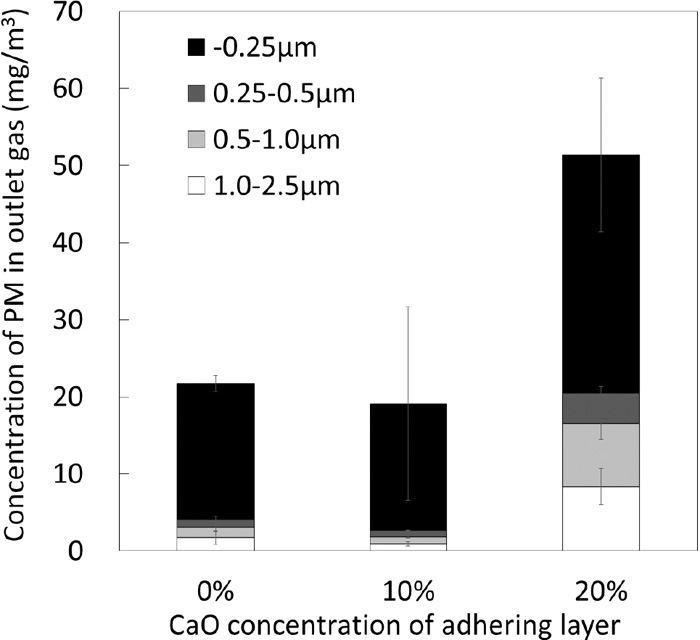
Effect of admixing ratio of CaO on the average PM concentration in outlet gas.
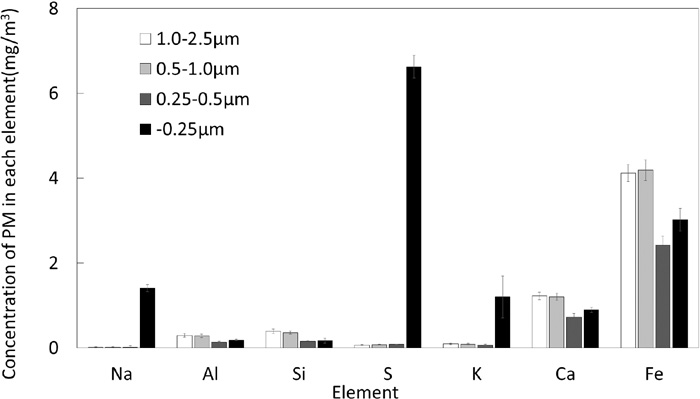
Concentrations of different elements in PM obtained for the case of CaO 20 mass%.
Figure 5 shows SEM image of PM (1.0–2.5 μm) obtained for the case of CaO 20 mass%. Most of them are spherical shape and the EDX analyses indicate higher concentrations of Fe, Ca and Si showing they are consisted of hematite, calciumferrite and some gangue minerals. Some particles with higher Fe content show irregular shape suggesting that they are iron ore particles directly discharged without melting.
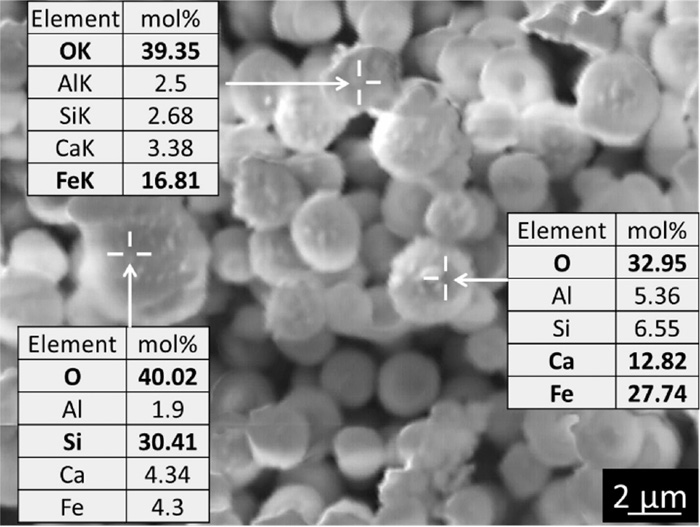
SEM image of PM (1.0–2.5 μm) obtained for the case of CaO 20 mass%.
The spherical particles seem to form through the droplets of melt with low melting point.12) An image of the fine melt droplets is shown in Fig. 6. S-type granules have a structure with adhering layer with Fe2O3 and CaO composition around coke nucleus particle. The adhering layer starts to fuse as temperature rises when it reaches the liquidus.12) Meanwhile, the carbon gasification occurs at the surface of coke particles by the reduction reaction of iron oxides in the melt (Eq. (4)).13,14)
| (4) |
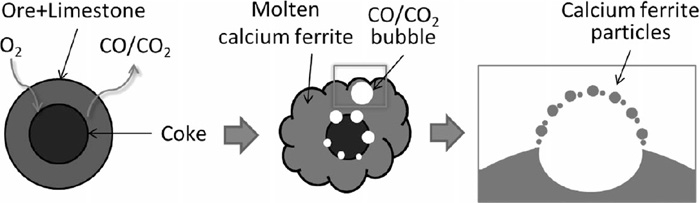
Schematic diagram of forming process of fine melt droplets.
Besides, it is conceivable that the CO and CO2 gas generation by the gasification and reduction reactions as well as the expansion of the gas existing in pores due to temperature rising promote the growth of bubbles. The bubbles generated in the above process may burst when they reach a certain size, and a large number of droplets are generated. It is supposed that particularly fine droplets are cooled down in the gas stream and discharged as PM.
To verify the above mechanism, a sintering experiment was performed by changing the existing state of coke particles. In this case, nucleus particles were replaced with an alumina balls and coke particles are directly used without granulation (Single coke particles). Admixing ratio and particles size of coke are same as the experiment using S-type coke granule as 75 kg/m3 and 1.68–2.36 mm, respectively. Figure 7 shows the effect of existing state of come particles in the raw material mixture on the emission of PM in the case that the CaO concentration of the adhering layer is 20 mass%. Emissions of PM (0.25–2.5 μm) were significantly reduced by changing the existing state of coke particles from the nuclei of S-type granule to single coke. It can be explained that the direct contact between the coke surface and melt becomes difficult and the possibility of bubble burst phenomenon decreased, since the single coke surfaces are not covered before the melt formation occurs. It should be noted that the change of the emission of PM (−0.25 μm) was rather small compared to other particle sizes. These small particles are mostly consisted of sulfate particles originated from coke as mentioned later.
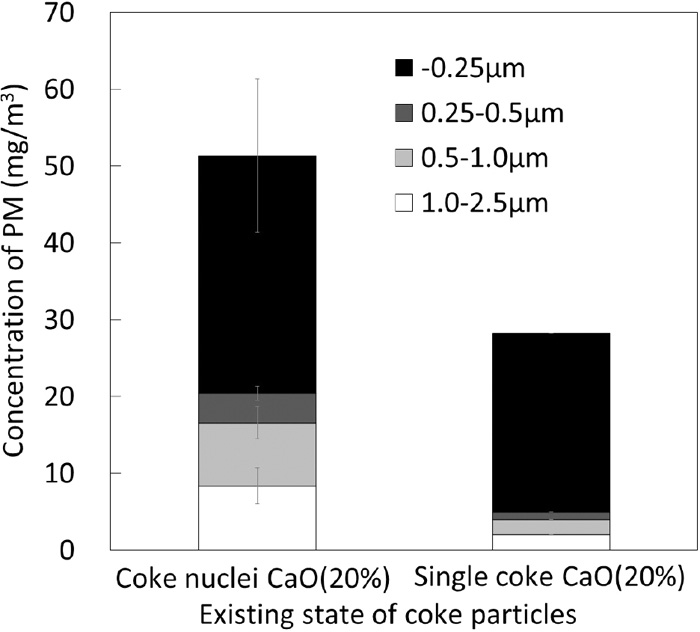
Effect of exiting state of coke particles on the PM emissions.
PM (−0.25 μm) contains elements of S, Na, and K more than other particle size range as shown Fig. 4. Morphological observation and composition analysis of PM (−0.25 μm) were further conducted. Figure 8 shows SEM images of representative particles of PM (−0.25 μm) obtained in the case of CaO 20 mass% and their EDX measurement results. Some particles like (a) and (b) mainly contain Fe and Fe–Ca, which are considered to be hematite and calciumferrite particles, respectively. On the other hand, a large number of particles containing S, Ca, Na and K were also observed. All of these particles show spherical shape, suggesting that the particles once melted and solidified during the experiment.
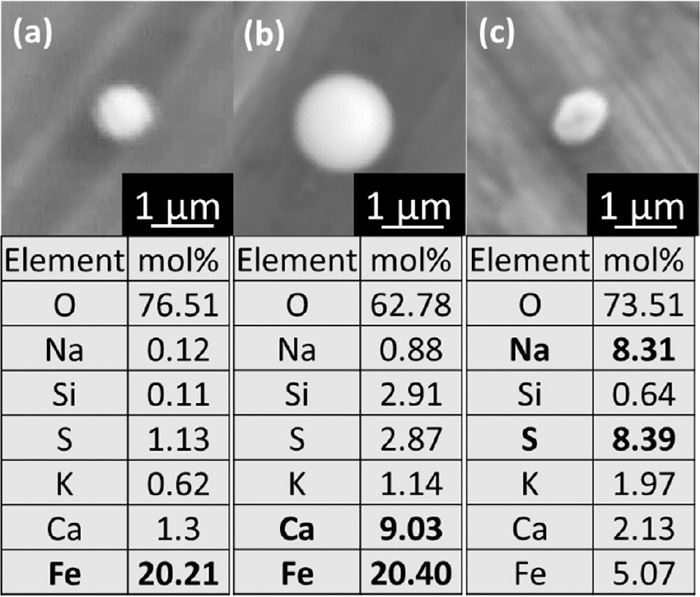
SEM-EDX of (a) Hematite, (b) calciumferrite, (c) sulfate PM (−0.25 μm) observed for the case of CaO 20 mass%.
Figure 9 shows the relationship between the moral ratios of alkali metals to iron, “(Ca, 0.5xK, 0.5xNa)/Fe”, and sulfur to iron, “S/Fe”, of PM (−0.25 μm) formed in the case of CaO 20 mass%. Plots in the both of lower alkali metals/Fe and lower S/Fe regions are attributed to the hematite and calciumferrite particles. While, certain linear relationships are seen between S/Fe and each alkali metal/Fe and also (Ca+0.5xK+0.5xNa)/Fe. Such relations seem to follow the stoichiometry of alkali metal sulfates such as CaSO4, K2SO4 and Na2SO4. Therefore, it can be concluded that obtained PM (−0.25 μm) is mainly composed of alkali metal sulfate, hematite and calciumferrite.
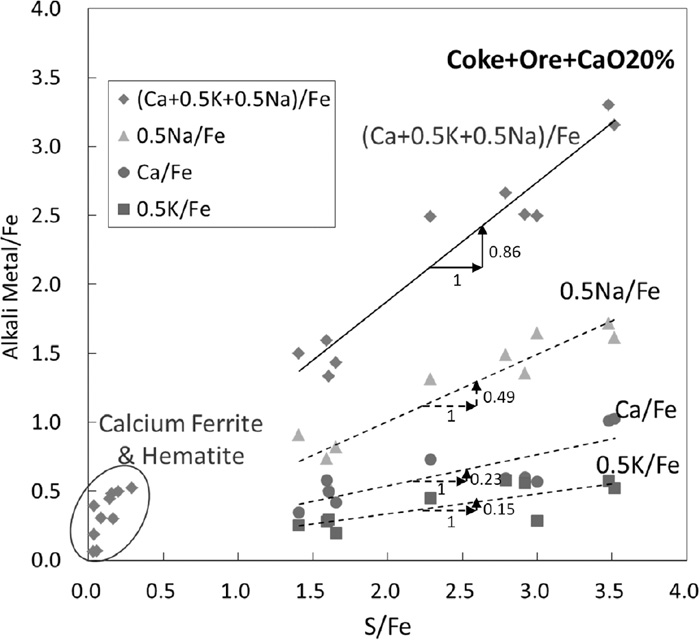
Relationships between moral ratios of alkali metals to Fe and S to Fe of PM (−0.25 μm) formed in the case of CaO 20 mass%.
Since the main origin of sulfur is from coke under this experimental condition, an additional experiment was conducted using graphite instead of coke to verify a hypothesis that sulfate is an important component of PM (−0.25 μm). Figure 10 shows the effect of kind of carbonaceous materials with different sulfur contents on the concentration of PM in the outlet gas. Both experiments were performed 3 times and the results were averaged, and the standard deviations calculated for each size range were shown as the error bars. The concentration of PM (−0.25 μm) significantly decreased by the replacement of coke with graphite. Figure 11 shows a comparison of the elemental compositions of PM (−0.25 μm) obtained by using of coke and graphite. Decreases in the concentrations of not only S, but also Na, K and Ca are seen suggesting that formation of such alkali metal sulfates is suppressed. Further, a part of decreases in Fe and Ca concentrations can be explained by the lowering the maximum bed temperature during the experiment due to lower reactivity of graphite than coke.
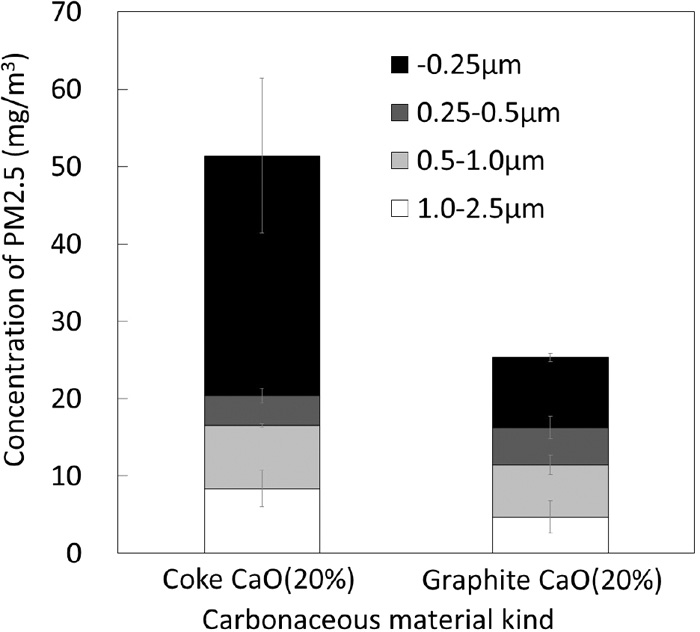
Effect of carbonaceous material kind on the concentration of PM in outlet gas.
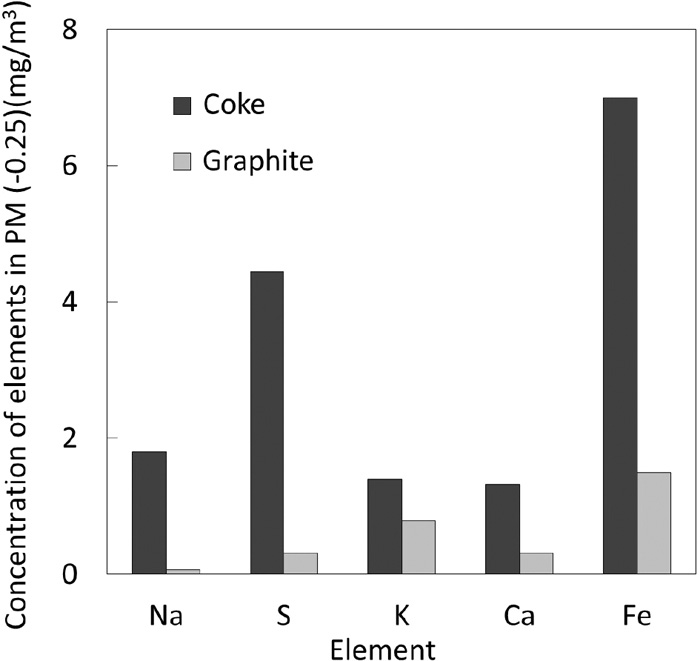
Elemental composition of PM (0.25 μm) in different carbonaceous material.
Figure 12 shows the SEM image of PM (−0.25 μm) and their EDX analyses obtained for the case using graphite. Chlorides such as NaCl and KCl become major alkali metal compounds instead of sulfates due to a decrease in the sulfur availability.15) The source of chlorine is difficult to identify at this moment, but one possibility is salts in sea water stuck to iron ore particles during their marine transportation and storing process near the sea. The chlorine concentration of the iron ores seems to be only a few tens of ppm, but even such an amount is comparable to that of elements in PM (−0.25 μm) shown in Fig. 11. Meanwhile, size of some chloride crystals of PM (−0.25 μm) became large after sampling due to deliquescence/recrystallization (see Fig. 12).
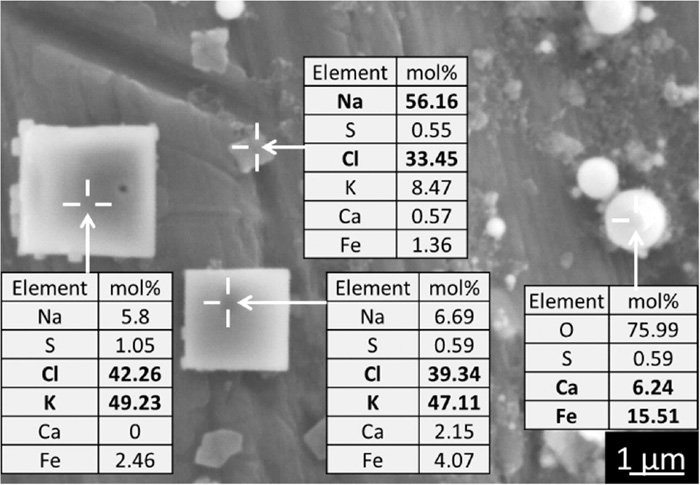
SEM image of PM (−0.25 μm) and their EDX analyses obtained for the case using graphite.
A series of model sintering experiments was conducted to obtain fundamental knowledge on the formation rate and structure/composition of PM2.5 formed in the course of sintering process. Effects of mixing ratios and existence states of coke and limestone and kind of carbonaceous material were examined. The results are summarized as follows:
(1) Concentration of particulate matters (PM) in the outlet gas became largest when CaO concentration of the adhering layer of S-type coke granules was set at 20 mass%. It should be noted that formation of PM with the size range between 0.25 and 2.5 μm, “PM (0.25–2.5 μm)”, was significantly promoted. This is because the liquidus temperature of CaO (20 mass%) - Fe2O3 is low. A large amount of formed melt accelerates the reduction reaction of iron oxides in the melt at coke surface. CO and CO2 gas generation by the gasification and reduction reactions as well as the expansion of the gas promote the growth of bubbles. The bubbles may burst when they reach a certain size, and a large number of fine droplets are generated. Fine droplets formed such a process are cooled down in the gas stream and partly become PM.
(2) Formation patterns of PM (−0.25 μm) seems not exactly same to PM (1.0–2.5 μm). PM (−0.25 μm) contains sulfates of Na, K and Ca in addition to hematite and calciumferrite, while PM (0.25–2.5 μm) is mainly composed of hematite, calciumferrite and some gangue materials. When coke containing a certain sulfur content was replaced with graphite, the major components of the generated PM (−0.25 μm) become chloride of Na and K.