Abstract
In this study, we evaluated the effect of the CO2 or H2O gasification reaction on the mechanical property of the coke matrix by measuring the elastic modulus of the coke matrix before and after the gasification reaction. We also investigated the effect of the distribution of the elastic modulus in the coke matrix on the strength of the lump coke by conducting the fracture analysis for the coke model with porosity of 0–0.4 in which the distribution of the elastic modulus obtained by the experiment was reflected. The nanoindentation measurements of the elastic modulus of the coke matrix before and after the gasification reaction implied that the distribution of the elastic modulus in the coke matrix differs depending on the gasification agent. In the case of the CO2 gasification reaction, both the coke matrices with high and low elastic moduli were consumed by the gasification. On the other hand, in the case of the H2O gasification reaction, only the coke with an elastic modulus of over 30 GPa before the reaction was consumed by the gasification reaction. Also, the numerical results showed that the distribution of the elastic modulus in the coke matrix affects the strength of the coke model with low porosity whereas the one did not affect that with high porosity.
1. Introduction
Metallurgical coke plays a role as not only a reducing agent but also a spacer that maintains gas and liquid permeability in the blast furnace, so that the high strength is required for the coke.1) However, since CO–CO2 gas atmosphere forms in the blast furnace, the coke is degraded by the CO2 gasification reaction and its strength decreases. Because the coke degraded by the CO2 gasification reaction is fractured and pulverized by the load from the upper part of the blast furnace, the gas and liquid permeability in the furnace decreases, and the reduction efficiency of the iron decreases. Also, a new blast furnace in which hydrogen is supplied from the shaft has been being developed to reduce CO2 emissions from the iron making process.2) In the new blast furnace, coke will be degraded by H2O gasification in addition to the conventional CO2 gasification.3) Thus, the production of the coke with high strength after both CO2 and H2O gasification reactions is needed to realize the stable operation of the future blast furnace. To issue guidelines about the production of the coke with high strength after gasification reactions, it is important to clarify the effect of the gasification reactions on the coke strength. Wang et al.4) conducted a CO2 or H2O gasification reaction experiment for coke lump at 950–1250°C, measured the coke strength after reaction (CSR) using an I-type drum tester and evaluated the internal structure of the coke by measuring the bulk density. As a result, the CSR decreased with the increase of the conversion in any of the reaction agent. It was also shown that the coke strength after reaction with CO2 decreased with the progress of the reaction as compared with that with H2O. However, although the evaluation methods of the coke strength used in their study such as CSR and drum strength index are useful indicators in the actual operation, because they include multiple factors such as mechanical properties of the coke matrix, pore structure, and the cracks, it is difficult to individually evaluate the effect of each factor on the strength. Therefore, it is necessary to use a method that can separate multiple factors to investigate the effect of CO2 or H2O gasification reaction on coke strength in more detail.
Examples for the previous investigations of the effect of the pore structure of coke on its strength are the fracture analyses using the Rigid Bodies-Spring Model (RBSM) developed by Kawai.5) Ueoka et al.6) performed the fracture analysis for the coke with a simple pore shape using the RBSM to investigate the effects of pore size, shape, porosity and pore wall thickness on the coke fracture phenomena. They showed that the yield load became smaller in the order of the square, circular, rhombic and elliptical pore shapes with lower stress concentration factors. Saito et al.7) conducted a fracture analysis on a coke model in which pores of various shapes were randomly arranged using the RBSM. Then, they evaluated the circularity and equivalent circle diameter as the shape and size of the pores and investigated the effects of the shape and size of the pores on the coke strength. As a result, it was shown that the coke strength was significantly reduced when the pores were large and their shapes were skewed. As mentioned above, the effect of pore structure on coke strength has been studied theoretically, and the relationship between pore structure and coke strength is becoming clearer.
In contrast, in terms of the effect of the mechanical properties of the coke matrix on its strength, the mechanical properties were recently measured by the nanoindentation method and the relationship to the coke strength has been discussed.8,9) Ogata et al.10) investigated the relationship of the production conditions such as the coal species, the blending ratio of coal and the heating condition to the mechanical properties of the coke matrix and reported that the elastic modulus of the coke matrix became larger for the higher carbonization temperature in coke production and the higher termination temperature of coal carbonization. Also, Hayashizaki et al.11) studied the effect of CO2 gasification reaction on the elastic modulus of the coke matrix, and they found that the elastic modulus decreased with the progress of the reaction and the nano-order pores developed in the coke matrix. Xing12) measured the fracture toughness and the reflectance of the coke matrix before and after the CO2 gasification reaction and the heat treatment to investigate the relationship between the optical properties and the strength of the coke matrix, and he showed that there is a correlation between the strength and the reflectance of the coke matrix. Although these studies examined the effects of the CO2 gasification reaction or the conditions of the coal carbonization on the mechanical properties of the coke matrix, the effects of the mechanical properties of the coke matrix on the strength of the coke lump have not been quantitatively evaluated. In addition, there is no study on the effect of the H2O gasification reaction on the mechanical properties of the coke matrix and the effect of the mechanical properties of the coke matrix after the H2O gasification reaction on the strength of the coke lump.
In this study, we evaluated the effect of the CO2 or H2O gasification reaction on the mechanical property of the coke matrix by measuring the elastic modulus of the coke matrix before and after the CO2 or H2O gasification reaction using the nanoindentation method and comparing the probability density distribution of the elastic modulus. We also investigated the effect of the distribution of the elastic modulus in the coke matrix on the strength of the lump coke by conducting the fracture analysis for the coke model with a porosity of 0–0.4 in which the distribution of the elastic modulus obtained by the experiment was reflected using the RBSM.
2. Measurement of Elastic Modulus of Coke Matrix by the Nanoindentation Method
2.1. Sample Preparation
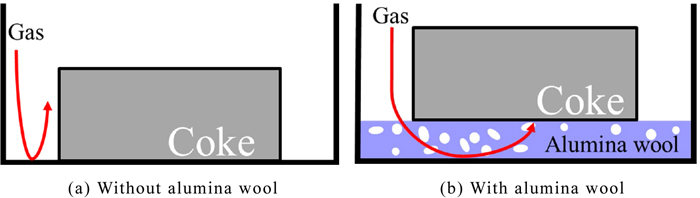
Coke prepared into a 3.5 mm × 3.5 mm × 2 mm plate or the one gasified with CO2 or H2O by the method described below was used as samples. Table 1 shows the proximate and ultimate analysis values of the coke sample. In addition, the porosity of the coke was 0.498, as measured according to JIS K 2151. A thermogravimetric analyzer (STA 449 F1 Jupiter, NETZSCH) and a thermogravimetric analyzer (TG/DTA-2000SA, Bruker AXS K.K.) which a steam generator (HC9700, NETZSCH Japan) attached to were used for gasification of the coke sample. A coke sample was put in an alumina sample pan, it was placed on a sample carrier inside a thermogravimetric analyzer, and the coke samples were gasified under the reaction conditions shown in Table 2. The conversion in the table is defined as the ratio of the weight loss due to the reaction to the weight of the sample before reaction excluding ash. Here, when the coke sample is placed directly on the sample pan, the reaction gas does not reach the bottom of the sample as shown in Fig. 1(a), and the sample may react unevenly. Therefore, in this experiment, alumina wool was laid on a sample pan, and a coke sample was placed on it as shown in Fig. 1(b) so that the sample reacted uniformly by referring to the previous study performed by Nakagawa et al.13) Regardless of the gasification agent, the inside of the thermogravimetric analyzer was heated to 1373 K with a heating rate of 10 K/min in an inert gas atmosphere and kept for 10 minutes, and then the gasification agent was introduced to start the reaction. Three samples after gasification were prepared for one reaction condition. The unreacted and reacted coke samples were polished sufficiently after filling with resin and used as samples for nanoindentation tests.
Table 1. Properties of coke.
| Proximate analysis [wt%-d.b] | |
| Volatile matter | 0.8 |
| Fixed carbon | 87.0 |
| Ash | 12.2 |
| Ultimate analysis [wt%-d.b] | |
| C | 85.8 |
| H | < 0.01 |
| N | 1.16 |
| S | 0.50 |
| O* | 0.39 |
| Ash composition [wt%] | |
| SiO2 | 6.32 |
| Al2O3 | 3.87 |
| TiO2 | 0.18 |
| Fe2O3 | 0.73 |
| CaO | 0.29 |
| MgO | 0.12 |
| Na2O | 0.06 |
| K2O | 0.17 |
| SO3 | 0.10 |
| MnO2 | 0.01 |
* By difference values that are not measured.
Table 2. Reaction conditions.
| Gasification with CO2 | | |
| Gas flow rate | [ml/min] | 100 |
| Gas composition | [vol%] | CO2:Ar = 10:90 |
| Reaction temperature | [K] | 1373 |
| Conversion | [-] | 0.12 and 0.25 |
| Gasification with H2O | | |
| Gas flow rate | [ml/min] | 200 |
| Gas composition | [vol%] | H2O:N2 = 10:90 |
| Reaction temperature | [K] | 1373 |
| Conversion | [-] | 0.12 and 0.22 |
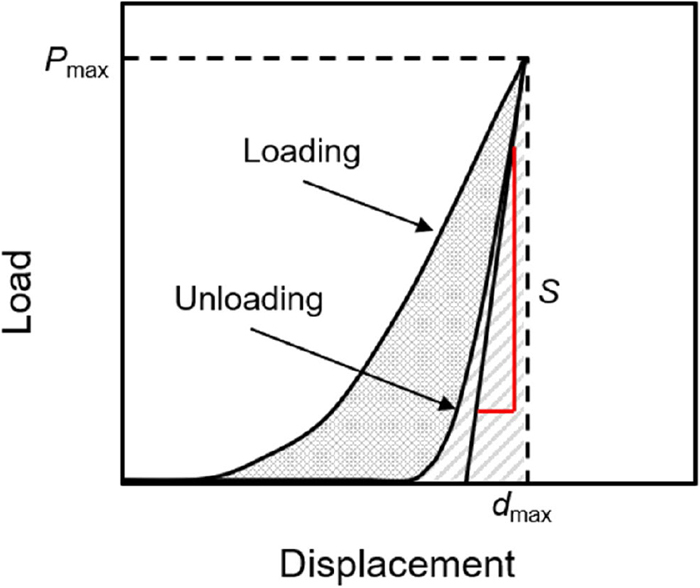
In this study, the elastic moduli of the coke matrix were measured by the nanoindentation method, referring to our previous work.8,11) The nanoindentation method measures the mechanical properties of the sample from the displacement-load curve shown in Fig. 2 obtained by pushing the indenter into the sample by controlling the depth of the indenter with the precision of the order of nm and the load of the order of μN using a microhardness tester (DUH-211S, SHIMADZU Corp.). In this experiment, we used a triangular pyramid-shaped Berkovich indenter with a 115° edge angle, and calculated the elastic modulus E of the sample by the following Eqs. (1), (2), (3), (4), (5) regarding the Berkovich indenter and the indentation depth of the sample.14)
|
E=
1-
ν
sample
2
1
E
r
-
1-
ν
in
2
E
in
| (1) |
|
d
c
=
d
max
-0.75
P
max
S
| (4) |
Here,
νsample is the Poisson’s ratio of the sample,
Er is the reduced modulus of the indented contact point,
νin and
Ein are the Poisson’s ratio and the elastic modulus of the indenter, respectively. Also,
S is the contact stiffness calculated from the slope of the load curve,
Ap is the projected contact area of the indenter, and
dc shows the indentation depth of the indenter. In the nanoindentation test, the maximum displacement
dmax and maximum load value
Pmax are acquired, and
S is calculated from the slope of the load-displacement curve during unloading. Then, the elastic modulus
E is calculated from these values.
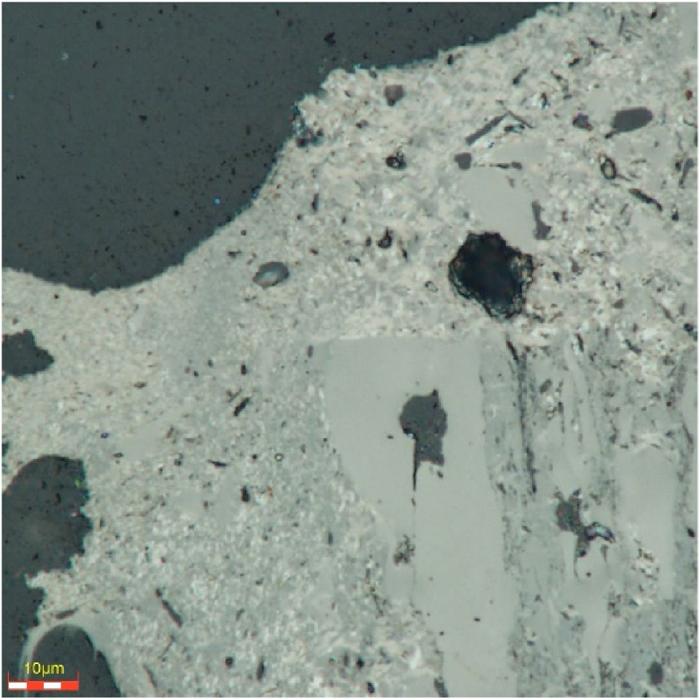
In this experiment, the loading speed of the indenter was set at 3.3 mN/s, a load was applied until the maximum load reached 25 mN, and the load was kept for 2 s at the maximum load. Then, unloading was performed at the same speed as the load speed, and the displacement was measured. Figure 3 shows an example of a micrograph of the coke matrix in the measurement object. In the region shown in Fig. 3, the regions in which no pores were visually observed were selected, and the displacement-load curves were obtained. The measurement was performed 200 times for one sample, and the probability density distribution of the elastic modulus was calculated for each gasification condition. The number of classes in the probability density distribution was determined by square root selection.
3. Fracture Analysis Considering Distribution of Elastic Modulus of Coke Matrix
3.1. Rigid Bodies-Spring Model (RBSM)
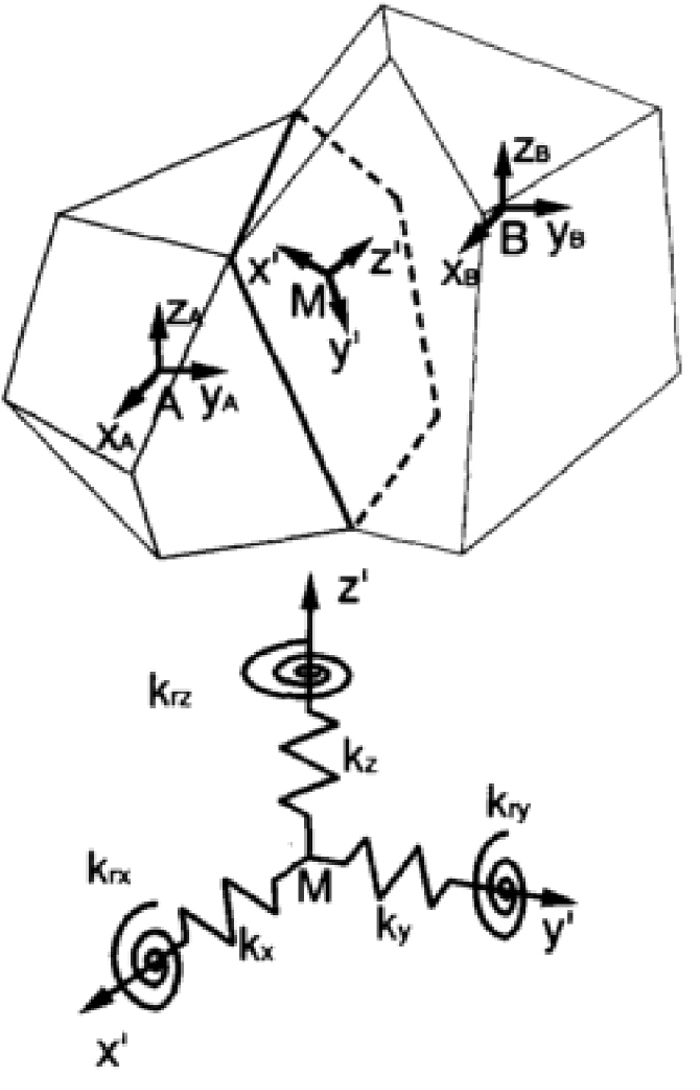
The Rigid Bodies-Spring Model (RBSM) is a model used for discrete limit analysis, and the analytical object is modeled by rigid elements and springs between the elements. By introducing nonlinearities such as fracture and slip into the springs arranged between the elements, a fracture can be expressed more easily in the RBSM than in methods such as the Finite Element Method that assumes the analytical object is a continuum. Discretization by the RBSM is performed by generating a spring coefficient matrix (D matrix) and a matrix that relate the rigid displacement at the element centroid and the relative displacement between the elements (B matrix) and constructing the element stiffness equation and the total stiffness equation by formulating based on virtual work. Here, the adjacent rigid elements A and B shown in Fig. 415) are considered. The relative displacement between the elements at the point M on the boundary surface δ = (δn, δs, δt, δφn, δφs, δφt)T is calculated by the following equation using the rigid displacement of each element u = (ux, uy, uz, uφx, uφy, uφz)T, the unit vector perpendicular to the boundary surface l = (lx, ly, lz)T, the two unit vectors parallel to the boundary surface m = (mx, my, mz)T and n = (nx, ny, nz)T.
|
B
A
=(
-
l
x
A
-
l
y
A
-
l
z
A
m
x
A
Z
A
-
n
x
A
Y
A
n
x
A
X
A
-
l
x
A
Z
A
l
x
A
Y
A
-
m
x
A
X
A
-
m
x
A
-
m
y
A
-
m
z
A
m
y
A
Z
A
-
n
y
A
Y
A
n
y
A
X
A
-
l
y
A
Z
A
l
y
A
Y
A
-
m
y
A
X
A
-
n
x
A
-
n
y
A
-
n
z
A
m
z
A
Z
A
-
n
z
A
Y
A
n
z
A
X
A
-
l
z
A
Z
A
l
z
A
Y
A
-
m
z
A
X
A
0
0
0
-
l
x
A
-
m
x
A
-
n
x
A
0
0
0
-
l
y
A
-
m
y
A
-
n
y
A
0
0
0
-
l
z
A
-
m
z
A
-
n
z
A
)
| (8) |
|
B
B
=(
l
x
B
l
y
B
l
z
B
-
m
x
B
Z
B
+
n
x
B
Y
B
-
n
x
B
X
B
+
l
x
B
Z
B
-
l
x
B
Y
B
+
m
x
B
X
B
m
x
B
m
y
B
m
z
B
-
m
y
B
Z
B
+
n
y
A
Y
B
-
n
y
B
X
B
+
l
y
B
Z
B
-
l
y
B
Y
B
+
m
y
B
X
B
n
x
B
n
y
B
n
z
B
-
m
z
B
Z
B
+
n
z
A
Y
B
-
n
z
B
X
B
+
l
z
B
Z
B
-
l
z
B
Y
B
+
m
z
B
X
B
0
0
0
l
x
B
m
x
B
n
x
B
0
0
0
l
y
B
m
y
B
n
y
B
0
0
0
l
z
B
m
z
B
n
z
B
)
| (9) |
In the RBSM, it is assumed that the relationship between stress and strain is as follows with for surface force
σ = (
σn,
σs,
σt,
σφn,
σφs,
σφt)
T per unit area and relative displacement
δ on the boundary surface.
Here, each component of the spring coefficient matrix
D is given by following equations using the elastic modulus
E and the Poisson’s ratio
ν.
|
D
ij
={
k
n
(
i=j=1
)
k
s
(
i=j=2
)
k
t
(
i=j=3
)
k
ϕn
(
i=j=4
)
k
ϕs
(
i=j=5
)
k
ϕt
(
i=j=6
)
0
(
i≠j
)
| (14) |
|
k
n
=
(
1-ν
)
E
(
1+ν
)
(
1-2ν
)
h
| (15) |
|
k
ϕn
=
∫
A
ele
(
x
′
)
2
+
(
y
′
)
2
d
A
ele
⋅
k
s
h
A
ele
| (18) |
|
k
ϕs
=
∫
A
ele
|
x
′
|d
A
ele
⋅
k
n
h
A
ele
| (19) |
|
k
ϕt
=
∫
A
ele
|
y
′
|d
A
ele
⋅
k
t
h
A
ele
| (20) |
As mentioned above, virtual work acting on two elements is considered for the formulation of the stiffness matrix in the RBSM. The virtual work caused by the surface force on the element boundary
WI can be expressed by the following equation from the virtual relative displacement
δ* with
u* of the virtual displacement related to each element’s center of gravity.
|
W
I
=
∫
A
(
δ
*
)
T
σd
A
ele
=
∫
A
(
B
u
*
)
T
DBud
A
ele
=
(
u
*
)
T
∫
A
B
T
DBd
A
ele
u
| (21) |
Conversely, the virtual work caused by the external force
WO can be calculated as below from the external force vector
F = (
x,
y,
z,
xφ,
yφ,
zφ)
T acting on the element center.
Based on the principle work, the following element stiffness equation can be obtained.
|
W
O
=
W
I
(
u
*
)
T
F=
(
u
*
)
T
∫
A
B
T
DBd
A
ele
u
F=
∫
A
ele
B
T
DBd
A
ele
u
=Ku
| (23) |
Here, the total stiffness matrix
K is obtained by the following equation.
|
K=
∫
A
ele
B
T
DBd
A
ele
| (24) |
The overall stiffness matrix is generated by superimposing the element stiffness equations obtained above. After that, the entire stiffness equation derived based on the total stiffness matrix is solved for the rigid displacement
u, and the stress generated in the spring is calculated using the obtained displacement.
3.2. Analytical Objects and Numerical Conditions
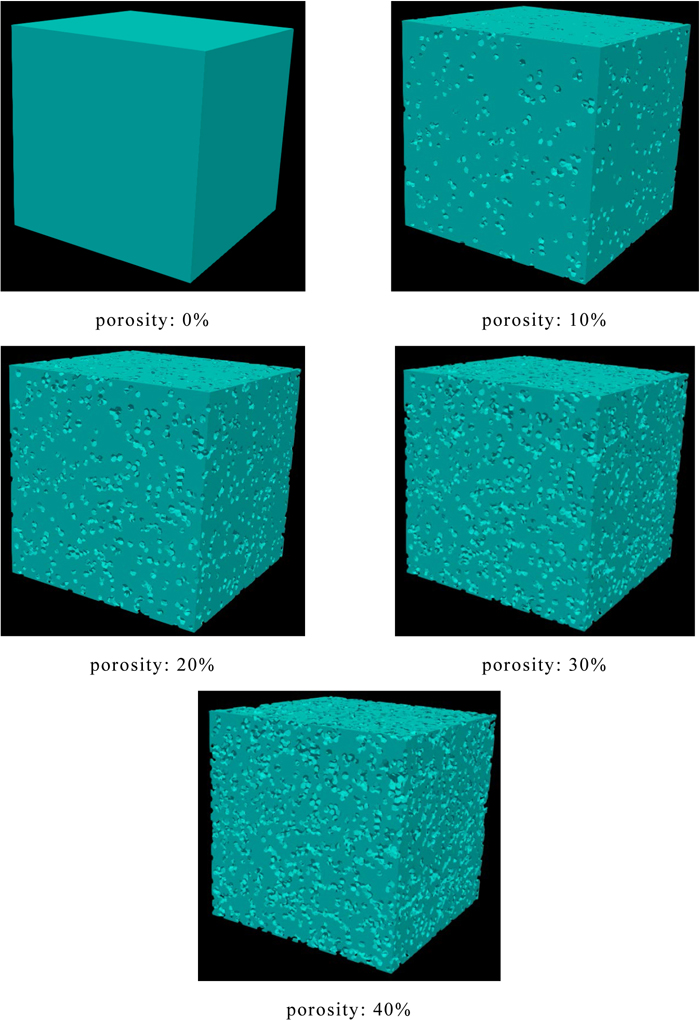
To investigate the effect of the distribution of the elastic modulus in the coke matrix on the coke strength, the numerical analyses assuming the uniaxial tensile tests were conducted for the analytical objects with a porosity of 0–0.4 in which the distribution of the elastic modulus measured by the nanoindentation test was applied. As analytical objects, cubes with a unit length were divided by polyhedral elements, and five kinds of cubes with the porosity of 0, 0.1, 0.2, 0.3 or 0.4 as shown in Fig. 5 were used. In addition, five kinds of analytical objects with different pore structures were constructed for each porosity. Material properties used in this study were as shown in Table 3, and these values were determined by referring to the previous study.7)
Table 3. Material properties.
| Poisson’s ratio | [-] | 0.21 |
| Tensile strength | [GPa] | 80 |
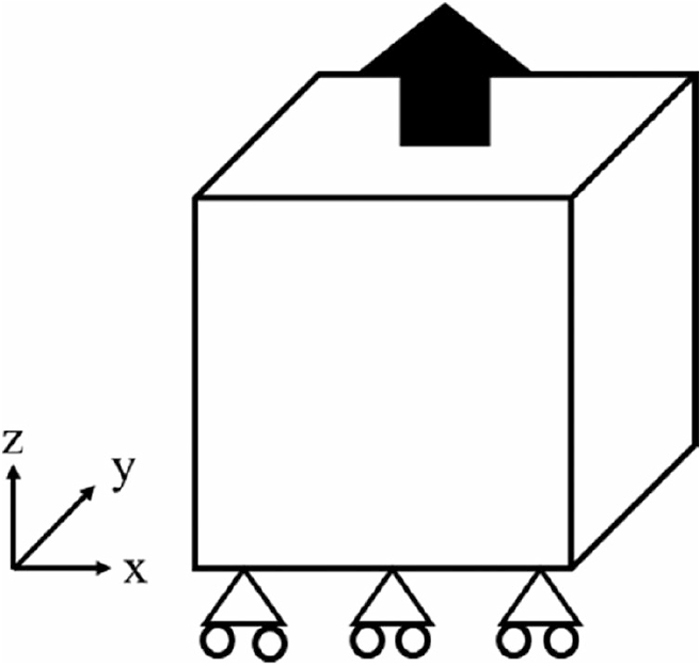
Fracture analyses assuming the uniaxial tensile test as shown in Fig. 6 for the analytical objects developed above were conducted and their strength was calculated by applying the forcible displacement of 1.0×10⁻⁵ to the top boundary at every step while fixing the bottom boundary. The Algebraic Multi-Grid Solvers (AMGS)16) was used to solve the matrix. Besides, when the value of the stress generated in the spring became a certain value or more, the fracture was considered to occur, and the stiffness of the spring was set to zero.
4. Results and Discussion
4.1. Elastic Modulus in Coke Matrix before and after Gasification Reactions
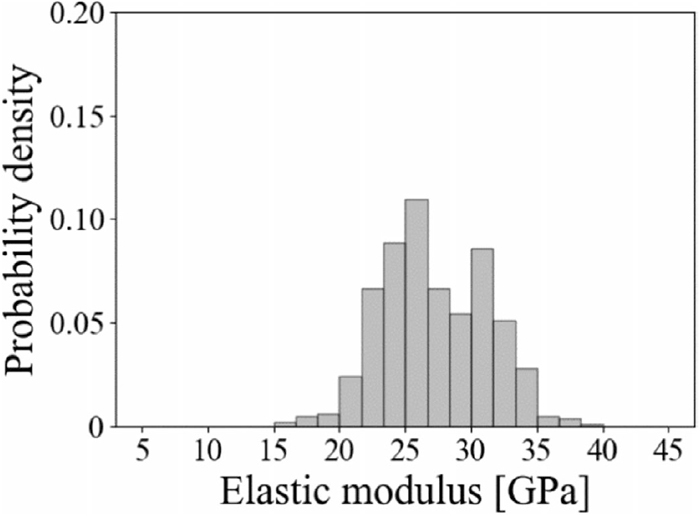
Figure 7 shows the probability density distribution of the elastic modulus in the unreacted coke matrix. In previous studies, it is reported that the elastic modulus of the active site of the coke matrix shows a value of around 25 GPa.10,11) In the probability density distribution of the elastic modulus in the unreacted coke shown in Fig. 7, the value of the elastic modulus is in the range of 15 to 45 GPa, which is a close value reported in previous studies. Also, since the probability density distribution of the elastic modulus in the unreacted coke matrix has bimodal with peaks around 25 and 35 GPa, it was shown that the unreacted coke had a matrix with high elastic modulus and that with low elastic modulus.
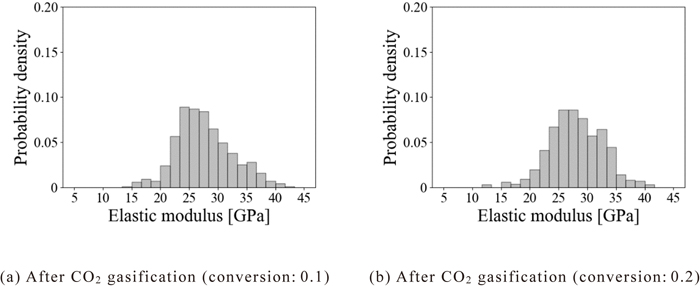
Next, to investigate the effect of the CO2 gasification reaction on the mechanical properties of the coke matrix, Figs. 8(a) and 8(b) show the probability density distribution of the elastic modulus in the coke matrix when the conversion reached 0.1 and 0.2, respectively. When the conversion was 0.1, the probability density distribution of the elastic modulus in the coke matrix was found to be a unimodal distribution with a peak around 25 GPa. Compared with the case of the unreacted coke (Fig. 7), the probability densities of the elastic modulus around 25 and around 35 GPa, respectively decreased. This would be because the coke matrices with elastic modulus of around 25 and 35 GPa were consumed by the gasification reaction. In contrast, when the conversion was 0.2, the distribution of the elastic modulus in the coke matrix was a unimodal distribution with a peak around 27 GPa. Compared to the case where the conversion was 0.1, the peak of the probability density distribution shifted from around 25 to 27 GPa. This would be because the coke matrices with an elastic modulus of 25 GPa or less were consumed by the gasification reaction as the reaction progressed. Besides, the probability density around 25 GPa became lower compared to the unreacted coke. These results suggest that both coke matrices with high and low elastic moduli were consumed with the progress of the reaction in the case of the CO2 gasification reaction.
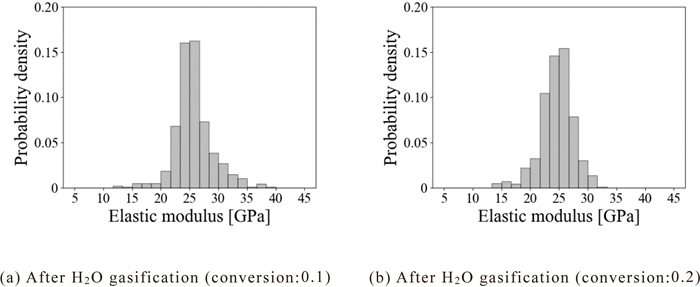
To investigate the effect of the H2O gasification reaction on the mechanical properties of the coke matrix, Figs. 9(a) and 9(b) show the probability density distribution of the elastic modulus in the coke matrix when the conversion reached 0.1 and 0.2, respectively. When the conversion was 0.1, the probability density distribution of the elastic modulus in the coke matrix was a sharp distribution with a peak of around 25 GPa. This would be because coke matrices with an elastic modulus of over 30 GPa were consumed due to the H2O gasification reaction, and coke matrices with an elastic modulus of around 25 GPa remained. The probability density distribution with the case for the conversion of 0.2 was also a sharp distribution with a peak of around 25 GPa similar to the case for the conversion of 0.1. Compared to the case in which the conversion is 0.1, the probability density over 30 GPa became smaller. Therefore, in the case of the H2O gasification reaction, it is considered that the reaction easily proceeds in the coke matrix with an elastic modulus of over 30 GPa before the reaction while the reaction hardly proceeds in the coke matrix with an elastic modulus of around 25 GPa. These results indicate that the gasification reactivity of the coke matrices with high and low elastic moduli differs depending on the gasification agent. However, the reason for the fact that the unreacted coke could have matrices with high and low elastic moduli, and their reactivity could differ depending on the gasification agent is unclear so far.
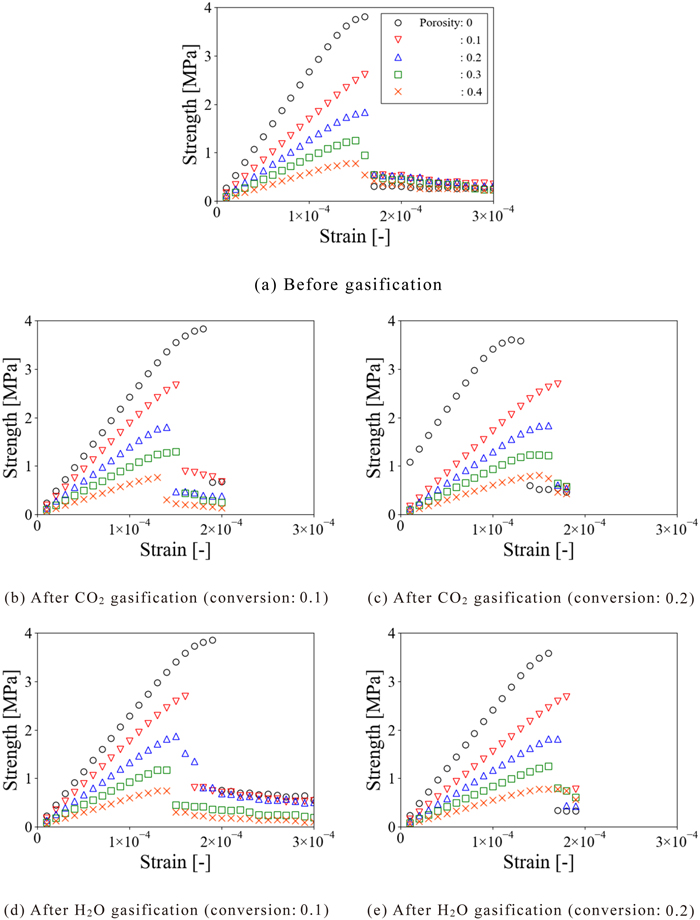
To investigate the effect of the distribution of the elastic modulus in the coke matrix on the fracture behavior of the coke, Fig. 10 shows the stress-strain curves of the coke models before and after CO2 and H2O gasification in which the elastic modulus was randomly given to the coke matrices according to the distributions in Figs. 7, 8 and 9 assuming porosity of 0–0.4. Here, the maximum values of the stress in the stress-strain curves were evaluated as the strength of the coke models. Focusing on the stress-strain curves in the case that the elastic modulus of the unreacted coke was applied in Fig. 10(a), the stress increased with an increase in the strain and the coke fractured at any porosity. Since the previous study1) reported that the coke undergoes brittle fracture and the stress-strain curves obtained in this study expressed the character of the fracture test of the brittle material, it is considered that the numerical analysis conducted in this study could capture the fracture behavior of coke. Although the strain at breakage of the coke model showed almost the same value irrespective of the porosity, the strength of the coke model decreased with an increase in porosity, and the strength for the porosity of 0.4 was one-fourth of that for 0. This result indicates the porosity greatly affects the strength of the coke model. Focusing on the stress-strain curves of the coke model with the elastic modulus after the CO2 gasification reaction shown in Figs. 10(b) and 10(c), the stress increased with an increase in the strain, and the coke was found to fracture at any porosity, similar to the case of the unreacted coke. However, when the conversion was 0.1, the strain at breakage of the coke model decreased with an increase in the porosity, unlike the unreacted coke. Conversely, when the conversion was 0.2, the strain increased with an increase in the porosity. Besides, the strength of the coke model decreased with an increase in the porosity in any case as in the unreacted coke. Focusing on the stress-strain curves of the coke model with the elastic modulus after the H2O gasification reaction shown in Figs. 10(d) and 10(e), the stress increased with an increase in the strain, and the coke fractured at any porosity, similar to the cases of the unreacted coke and the coke after the CO2 gasification reaction. Also, similar to the coke model in which the elastic modulus after the CO2 gasification reaction was applied, the strain at breakage of the coke model decreased with an increase in the porosity when the conversion was 0.1 while the strain increased when the conversion was 0.2. Besides, the strength of the coke model decreased with an increase in the porosity in any case. From the above, it can be seen that although the magnitude of the strain at breakage of the coke model differs depending on the distribution of the elastic modulus applied to the coke model, the behavior of the brittle fracture and the decrease in the strength of the coke model with an increase in the porosity are similar.
To evaluate the difference in the distribution of the elastic modulus on the strength of the coke model in detail, Fig. 11 shows the plots of the averaged strength of the coke model in which the elastic modulus before and after the gasification reaction was applied against the porosity. Here, the averaged strength was calculated from the strength of five kinds of analytical objects with different pore structures for one porosity. Focusing on the strength of the coke model in which the distribution of the elastic modulus before and after the CO2 gasification reaction was applied in Fig. 11(a), in the case of porosity of 0, the strength was the lowest when the distribution of the elastic modulus at a conversion of 0.2 was applied. In the case of porosity of 0.1, although the difference was slight, the strength was the lowest when the conversion was 0.2 as in the case of the porosity of 0. However, when the porosity was larger than 0.2, the strength of the coke model was almost the same in any case that the distribution of the elastic modulus before and after the gasification reaction was applied. Also, focusing on the strength of the coke model with the distribution of the elastic modulus before and after the H2O gasification reaction was applied in Fig. 11(b), in the case of porosity of 0, the strength was the lowest when the distribution of the elastic modulus at a conversion of 0.2 was applied similar to the coke model with the distribution of the elastic modulus before and after the CO2 gasification reaction. However, when the porosity was larger than 0.1, the strength of the coke model was almost the same in any case that the distribution of the elastic modulus before and after the gasification reaction was applied. From the above, it was clarified that although the strength of the coke model differs depending on the distribution of the applied elastic modulus when the porosity of the coke model is low, the strength is almost the same regardless of the distribution of the elastic modulus when the porosity is high.
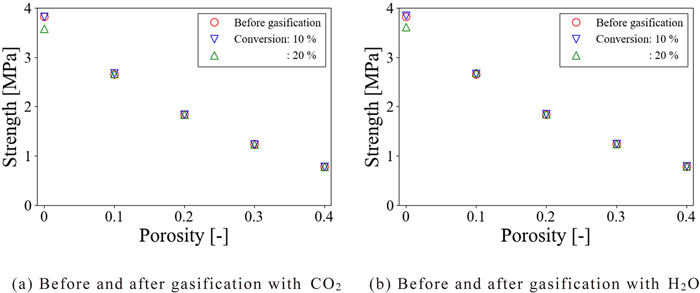
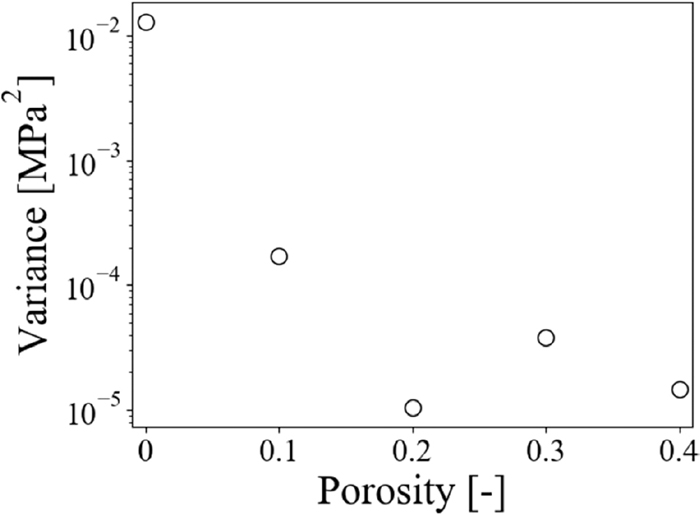
Figure 12 shows the plots of the variance of the strength of the coke model with the elastic modulus before and after the gasification reaction against the porosity. Here, the variance of the strength was calculated from the strength when the distribution of the elastic modulus before and after the CO2 and H2O gasification reactions were applied. Thus, the variance shown in Fig. 12 indicates the variation of the strength of the coke model caused by the differences in the distribution of the elastic modulus. Figure 12 shows that while the variance of the strength of the coke model was about 10−2 MPa2, that decreased to about 10−5 MPa2 with an increase in the porosity. Hence, it was suggested that although the strength of the coke model is different due to the difference in the distribution of the elastic modulus when the porosity was low, the strength of the coke model was almost the same regardless of the distribution of the elastic modulus. Besides, the porosity of the metallurgical coke is known to be around 50% in previous studies.4,17,18) Therefore, it is considered that the changes in the distribution of the elastic modulus due to the gasification reactions do not affect the strength of metallurgical coke, and the mechanical properties of the coke matrix are not the dominant factors of the strength of the lump coke.
5. Conclusions
In this study, we evaluated the effect of the CO2 or H2O gasification reaction on the mechanical property of the coke matrix by measuring the elastic modulus of the coke matrix before and after the gasification reaction. We also investigated the effect of the distribution of the elastic modulus in the coke matrix on the strength of the lump coke by conducting the fracture analysis for the coke model with a porosity of 0–0.4 with the distribution of the elastic modulus obtained by the experiment. The nanoindentation measurements show that both the coke matrices with high and low elastic moduli were consumed by the gasification in the case of the CO2 gasification reaction. In contrast, in the case of the H2O gasification reaction, only the coke matrix with an elastic modulus of over 30 GPa before the reaction was consumed by the gasification reaction. These results imply that the reactivity of the coke matrices with high and low elastic moduli differs depending on the gasification agent. Also, the fracture analyses showed that the distribution of the elastic modulus in the coke matrix affects the strength of the coke model with low porosity whereas the distribution does not affect the strength of the coke model with high porosity. These results indicate that the changes in the distribution of the elastic modulus due to the gasification reactions do not affect the strength of metallurgical coke, and the mechanical properties of the coke matrix are not the dominant factors of the strength of the lump coke.
Acknowledgement
This work was carried out as a part of the research activities “CO2 Ultimate Reduction System for Cool Earth 50 (COURSE50) Project”. The financial support from New Energy and Industrial Technology Development Organization (NEDO) is gratefully acknowledged. We also thank New Industry Creation Hatchery Center (NICHe), Tohoku University for their cooperation in the measurement of the elastic modulus.
Nomenclature
A: area [m2]
B: B matrix
D: elasticity matrix [Pa]
d: indentation depth [m]
E: elastic modulus [N/m2]
F: force vector [N]
h: length of spring [m]
K: stiffness matrix [N/m]
k: spring constant [N/m]
l,m,n: unit surface vector [-]
P: indentation load [N]
S: contacts stiffness [N/m]
u: displacement [m]
W: virtual work [N·m]
X,Y,Z: local coordinates
x,y,z: global coordinates
<Greek symbols>
δ: relative displacement vector [-]
ν: Poisson’s ratio [-]
σ: stress matrix [Pa]
σ: tensile stress [Pa]
<subscripts and superscripts>
A,B: element index
c: contacted
ele: elements
I: internal force
in: indenter
i, j, k: index
M: center of element
n: normal direction
O: external force
p: projected contact area
r: reduced modulus
sample: sample
s, t: shear direction
T: transpose
x,y,z: direction index
ϕ: rotate
*: virtual
References
- 1) T. Arima: Tetsu-to-Hagané, 92 (2006), 106 (in Japanese). https://doi.org/10.2355/tetsutohagane1955.92.3_106
- 2) S. Watakabe, K. Miyagawa, S. Matsuzaki, T. Inada, Y. Tomita, K. Saito, M. Osame, P. Sikström, L. S. Ökvist and J. O. Wikstrom: ISIJ Int., 53 (2013), 2065. https://doi.org/10.2355/isijinternational.53.2065
- 3) S. Tonomura, N. Kikuchi, N. Ishiwata, S. Tomisaki and Y. Tomita: J. Sustain. Metall., 2 (2016), 191. https://doi.org/10.1007/s40831-016-0066-4
- 4) P. Wang, Y. Zhang, H. Long, R. Wei, J. Li, Q. Meng and S. Yu: ISIJ Int., 57 (2017), 643. https://doi.org/10.2355/isijinternational.ISIJINT-2016-488
- 5) T. Kawai: Nucl. Eng. Des., 48 (1978), 207. https://doi.org/10.1016/0029-5493(78)90217-0
- 6) K. Ueoka, T. Ogata, H. Hayashizaki, Y. Matsushita, H. Aoki, T. Miura, K. Fukuda and K. Matsudaira: Tetsu-to-Hagané, 95 (2009), 607 (in Japanese). https://doi.org/10.2355/tetsutohagane.95.607
- 7) Y. Saito, S. Matsuo, T. Kanai, A. Toishi, A. Uchida, Y. Yamazaki, Y. Matsushita, H. Aoki, S. Nomura, H. Hayashizaki and S. Miyashita: Tetsu-to-Hagané, 100 (2014), 140 (in Japanese). https://doi.org/10.2355/tetsutohagane.100.140
- 8) M. Mihashi, M. Soejima, Y. Asakuma, T. Yamamoto, H. Aoki, T. Miura, K. Kato and S. Itagaki: Tetsu-to-Hagané, 88 (2002), 188 (in Japanese). https://doi.org/10.2355/tetsutohagane1955.88.4_188
- 9) X. Xing, G. Zhang, G. Ciezki, M. Dell and O. Ostrovski: Proc. 13th Int. Ferroalloys Congr., Efficient Technology in Ferroalloy Industry, International Committee on Ferro-Alloys (ICFA), Johannesburg, (2013), 489.
- 10) T. Ogata, K. Ueoka, Y. Morozumi, H. Aoki, T. Miura, K. Uebo and K. Fukuda: Tetsu-to-Hagané, 92 (2006), 171 (in Japanese). https://doi.org/10.2355/tetsutohagane1955.92.3_171
- 11) H. Hayashizaki, K. Ueoka, T. Ogata, Y. Yamazaki, Y. Matsushita, H. Aoki, T. Miura, K. Fukuda and K. Matsudaira: Tetsu-to-Hagané, 95 (2009), 460 (in Japanese). https://doi.org/10.2355/tetsutohagane.95.460
- 12) X. Xing: Energy Fuels, 33 (2019), 4146. https://doi.org/10.1021/acs.energyfuels.9b00417
- 13) H. Nakagawa, M. Shimomura and K. Miura: 35th Autumn Meeting of the Society of Chemical Engineers, Japan, The Society of Chemical Engineerings, Japan, Tokyo, (2002), W102 (in Japanese).
- 14) W. C. Oliver and G. M. Pharr: J. Mater. Res., 7 (1992), 1564. https://doi.org/10.1557/JMR.1992.1564
- 15) Y. Toi and T. Kiyosue: Eng. Fract. Mech., 50 (1995), 11. https://doi.org/10.1016/0013-7944(94)00160-J
- 16) N. Nomura, A. Fujii, T. Tanaka, O. Marques and K. Nakajima: IEEE Int. Parallel and Distributed Processing Symp. Workshops (IPDPSW), IEEE, New York, (2018), 1104. https://doi.org/10.1109/IPDPSW.2018.00170
- 17) X. Xing, H. Rogers, G. Zhang, K. Hockings, P. Zulli and O. Ostrovski: Energy Fuels, 30 (2016), 161. https://doi.org/10.1021/acs.energyfuels.5b02152
- 18) F. Meng, S. Gupta, D. French, P. Koshy, C. Sorrell and Y. Shen: Powder Technol., 320 (2017), 249. https://doi.org/10.1016/j.powtec.2017.07.046