Abstract
In this study, the electrochemical hydrogen permeation technique was introduced to investigate the relationship between scratch shape and hydrogen permeation on of Zn coated steel with wet and dry cyclic corrosion. Six kinds of scratches with different aspect ratio (width/length) and area were fabricated by focused pulsed Nd: YAG laser irradiation. Hydrogen permeation currents with each scratches formed on Zn coated steels were investigated. Regardless of scratch shapes, the peaks were recorded in hydrogen permeation currents during wetting and Zn corrosion products were observed around and on the formed scratches. The total hydrogen permeation charges calculated from hydrogen permeation currents depended on aspect ratio and area of scratch. It is suggested that Zn corrosion products easily covered high aspect ratio scratch and prevented hydrogen entry. In detail change of hydrogen permeation currents during wet and dry corrosion tests was also explained based on coverage and composition of Zn corrosion products.
1. Introduction
In recent years, the strength of steels has been increasing for the purpose of reducing the weight of structures. For example, the cable of Akashi-Kaikyo Bridge, the longest suspension bridge in the world, uses high-strength steel wires exceeding 1770 MPa. This was much higher than the tensile strength of 1550–1600 MPa at that time.1) It is well known that the high-strength steels have a high susceptibility to hydrogen embrittlement or delayed fracture.2,3,4) Hydrogen embrittlement and delayed fracture have become important issue recently.5,6,7,8,9,10,11,12,13,14) It is also pointed out that delayed fracture occurs due to the entry of hydrogen generated by the atmospheric corrosion.15)
In the practical use of steels including high strength steels, atmospheric corrosion plays an important role in the hydrogen generation. Therefore, Zn coating is widely used to reduce the corrosion rate of the steels. Zn is known to have excellent corrosion resistance in the atmosphere, and the corrosion rate is about 1/10 to 1/100 lower than that of steel.16) However, if a scratch is formed on the Zn coating, more serious corrosion occurs and the amount of hydrogen entry increases.17,18) Figure 1 shows a schematic representative of Zn sacrificial protection to steel and hydrogen formation and entry. Zn dissolves near the scratch (Zn → Zn2+ + 2e−) and hydrogen generation reaction (H2O + e− → Had + OH−) increases at exposed steel area. The Zn sacrificial protection to steel increase hydrogen entry (Had → Hab). This also increases the risk of formation of cracks by hydrogen embrittlement.

Zn sacrificial protection to steel corrosion occurs within a certain region around steel/Zn boundary. Hydrogen generation reaction and hydrogen entry may be affected by scratch shape and area. The amount of hydrogen permeation could also change with aspect ratio of scratch and scratch area. In this paper, the effects of the scratch shape and area on the hydrogen permeation behavior of Zn coated steel during wet and dry cycle corrosion were investigated with micro-electrochemical hydrogen detection cell.
2. Experimental
2.1. Specimens
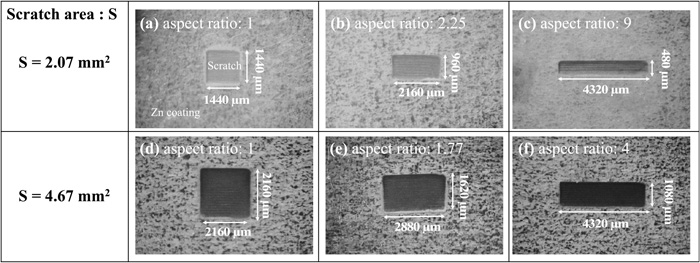
Zn coated steels sheets (15 × 30 × 0.5 mm) were used as specimens. One side of the specimen for hydrogen detection side was ground with SiC abrasive paper up to #1500 grit size in order to remove the Zn precoated layer, then, the surface was plated electrochemically with Ni in a 0.312 kmol m−3 NiSO4−0.781 kmol m−3 H3BO3 solution at 4 mA cm−2 current for 720 s. The thickness of Ni plated layer was 1 μm. The other side of the specimen (the hydrogen entry side of the specimens) was irradiated by pulsed Nd:YAG laser (wavelength 532 nm, pulse duration 3–5 ns, pulse frequency 10 s−1, and power 20 mW at the front of the lens) in the highly purified water to form the scratches. Two types size of scratch areas, 2.07 mm2 and 4.67 mm2, were formed. The shapes of 2.07 mm2 scratches were controlled to be 1440 × 1440 μm2 (aspect ratio: 1), 2160 × 960 μm2 (aspect ratio: 2.25) and 4320 × 480 μm2 (aspect ratio: 9) by scanning of the laser beam. The shapes of 4.67 mm2 scratches were controlled to be 2160 × 2160 μm2 (aspect ratio: 1), 2880 × 1620 μm2 (aspect ratio: 1.77) and 4320 × 1080 μm2 (aspect ratio: 4). Figure 2 shows surface optical images of scratches formed on the specimen. Before the wet and dry corrosion tests, the specimens were cleaned in highly purified water and ethanol using ultrasonic baths for 300 s.
In the hydrogen detection cell, Pt wires were used as the counter (C.E.) and the reference electrodes (R.E.). The potential difference between Pt electrode in 1 kmol m−3 NaOH solution and Ag/AgCl sat. KCl was −20 mV. The cell was filled with 1 kmol m−3 NaOH in the hydrogen detection cell. The specimen of the hydrogen detection (the nickel plated) side was placed on the cell. It was ensured that there were no bubbles in the cell. The cell was set in humidity and temperature control chamber. Figure 3 shows the schematic outline of the equipment for the wet and dry corrosion tests. To measure the hydrogen, hydrogen detection side of the specimen was polarized at −30 mV vs. Pt (R. E.) during the tests. The applied anodic potential was sufficient to ionize any hydrogen reaching at the surface after permeating through the specimen. After the current of the hydrogen detection cell reached a sufficiently low and steady state value about 5 nA (about 86.4 ks after the potential was applied), 10 μL of 0.1 kmol m−3 NaCl solution was dropped on solution on the center of the scratch.

Immediately after dropping, wet and dry cyclic corrosion test and the measurement of hydrogen permeation current were started. Figure 4 shows the changes of relative humidity (%RH) and temperature with time for one cycle (6 h) of the wet and dry cyclic corrosion test. One cycle is divided into four processes; 1 h wetting process (maintained at 303 K, 90% RH), 1 h heating process, 3 h drying process (323 K, 33% RH) and 1 h cooling process. The hydrogen permeation currents ware measured for 72 h (12 cycles). Three specimens at same aspect ratio and area were carried out.

Ootsuka et al. reported that the measured current was also influenced on the temperature change.19) The current depending on temperature change was measured by masking using samples which surface did not to expose to environment (no corrosion occurred during wet and dry cycles). The hydrogen permeation current was calculated by subtracting the current depending on temperature change from the current measured during wet and dry corrosion test.
2.3. Surface Observation and Analysis
The surfaces of the specimens after the tests were observed by an optical microscope and a scanning electron microscope (SEM). An energy dispersive X-ray spectroscope (EDS), Raman spectroscope and Auger electron spectroscope (AES) were used to analyze the surface of the specimens. A green laser with 532 nm wave length was used for Raman spectroscope measurements. An acceleration voltage of 10.0 keV and beam current of 10 nA were used for SEM and AES analysis.
3. Results and Discussion
3.1. Hydrogen Permeation Current during Wet and Dry Corrosion Tests
The hydrogen permeation currents measured during wet and dry cyclic corrosion tests of specimens with different scratch shapes are shown in Fig. 5 along with the time change of temperature and humidity. Independent of scratch shape, the peaks are observed in hydrogen permeation currents during wetting period. In the first cycle, the reaction takes place under the formed droplets, whereas in the second and subsequent cycles, the reaction takes place under a thin liquid solution film formed on the once dried surface. This is the reason why there are the large peaks are observed only in the first cycle for of each scratch shape.
In order to elucidate the hydrogen permeation behavior in each cycle, the permeation current is integrated for each cycle to determine the amount of charge (Fig. 6). The plots are the average of three specimens. The amount of hydrogen permeation charge decreases with the cycle numbers in all shapes.
Figure 7 shows the relationship between the total amount of hydrogen permeation charge for 72 h and the aspect ratio of the formed scratches. It can be seen that the larger the aspect ratio of the scratch, the smaller the total amount of charge, and the larger the area, the greater the total amount of charge.
3.2. Surface Observation after the Tests
In order to investigate the reason why the amount of hydrogen permeation charge decreases with the cycle numbers and the total amount of charge increase with scratch area but decrease with aspect ratio, the specimen surfaces after the tests were observed by optical microscope. Figure 8 is an optical microscope images of the specimens after the tests. There are white corrosion products around the scratches. It is confirmed that white corrosion products were composed of Zn, Cl and O by EDS analysis.
The corrosion products are analyzed by Raman spectroscopy for further detailed observation. Figure 9 shows (a) optical microscope image of observed area and (b) the Raman shift obtained from red circle in Fig. 9(a). The peaks at 210 cm−1, 260 cm−1, 390 cm−1, 730 cm−1, 910 cm−1, and 1030 cm−1 are assigned to simonkolleite (Zn5(OH)8Cl2).20) From this result, it is found that the white corrosion products formed around the scratch are simonkolleite.21,22,23)
The reason why the hydrogen permeation charge decrease with the cycle numbers for all shapes is Zn corrosion products formation. If the area of Zn corrosion products increase with the cycle numbers, there are two possible mechanisms to explain the decrease in the hydrogen permeation charge with cycle number.
One mechanism is Zn corrosion products around the scratch inhibit the entry of hydrogen.18) If the area of Zn corrosion products increase with the cycle numbers, the Zn corrosion product coverage of scratch increase. This causes decline of the number hydrogen entry sites and the amount of hydrogen permeation charge.
Second mechanism is the anodic dissolution rate of Zn decreases due to the fixation of Cl− by the formation of simonkolleite. Hayashi et al. reported that the anodic dissolution rate of Zn was third proportional to concentration of Cl− under neutral (pH = 5–8) conditions.24) As the low anodic Zn dissolution rate reduces the rate of hydrogen generation reaction, the amount of hydrogen permeation charge also decreases with the cycle numbers.
Islam et al. reported that Zn formed thin protective layer on steel surface after immersion test.25,26) This thin Zn protective layer may inhibit corrosion reaction and hydrogen entry. Igarashi et al. reported that hydrogen permeation current after laser irradiation in the aqueous solution containing Zn2+ was smaller than that in the solution containing Na+ or Mg+.27) It is suggested that Zn make strong chemical binding with ion at steel surface and this thin Zn protective layer inhibit hydrogen entry. In order to investigate thin surface layer on steel at scratch, an AES analysis which can measure the thin surface layer was carried out. Figure 10(a) shows an SEM image of the specimen after the test, and an AES spectrum at the central part at red circle is shown in (b). The peaks are assigned to O (503 eV), Fe (599, 652, 704 eV) and Zn (990 eV).28) The Zn peak is observed in detail. Figure 11(a) shows the obtained AES spectrum at circle shown in Fig. 10(a), and the standard AES spectra of ZnO and Zn. The ZnO and Zn standard spectrum are magnified by Table 1 magnification. The convolution of the ZnO and Zn standard spectra by least-squares method and the obtained AES spectrum are shown in Fig. 11(b). Tsutsumi et al. reported that since the Auger transition involves outer shell electrons, the shape of the Auger peak reflects the chemical state of the specimen.29,30,31,32) It is possible to analyze and quantify the chemical state by comparing the obtained peak shape with the standard spectrum. The calculated existence ratio from the magnification is 98.8% for ZnO and 1.2% for Zn. This result suggests that ZnO presented on the steel may inhibit hydrogen entry.

Table 1. Magnification factor of standard materials spectra and existence ratio of Zn and Zn
2+.
| Material | Magnification | Existence ratio |
|---|
| ZnO | 0.2422 | 98.8% (Zn2+) |
| Zn | 0.0015 | 1.2% (Zn) |
Figure 12 shows the schematic representation of hydrogen entry with different scratch area and aspect ratio. The reason why the total charge decrease with aspect ratio is formation of Zn corrosion products. Two mechanisms shown in 3.2 play an important role in the total charge. In the high aspect ratio scratch, Zn corrosion products easily covered the scratch. The total amount of charge of high aspect ratio scratch is less than that of low aspect ratio scratch because of tiny number of hydrogen entry site and the much amount of Cl− fixation.

The possible reason for total charge of 4.67 mm2 scratches is larger than that of 2.07 mm2 scratches is also formation of Zn corrosion products. Zn corromsion products form around and on the scratch, and the number of hydrogen entry site decreases. In large scratch, Zn corrosion products don’t completely cover the scratch. The coverage of large scratch by Zn corrosion products might be less than that of small scratch. This causes remain of active hydrogen entry site.
3.4. Hydrogen Permeation Current during One Cycle
Figure 13(a) shows the 2nd cycle of the hydrogen permeation current during the wet and dry cycle test. It can be seen that each scratches in Fig. 13 have two peaks in the wetting and heating processes. Figure 13(b) shows the schematic representation of the surface state and the corresponding hydrogen permeation current behavior. I) A liquid film is formed on the surface during the wetting process, and the amount of hydrogen permeation current increases due to the sacrificial corrosion reaction of Zn. II) The hydrogen permeation current is decreased by the generated Zn corrosion products. III) During the drying process, a second peak is observed. This is due to the evaporation of droplets and the NaCl concentration increases. This concentration change activates the sacrificial corrosion reaction again. IV) At the end of the drying process (from 8 to 12 h in Fig. 13(a)), the droplets completely evaporate and the corrosion reaction and hydrogen permeation do not occur.
4. Conclusions
In this study, the effects of scratch shape on the hydrogen permeation behavior of Zn coated steel during wet and dry cycle corrosion was investigated. Following conclusions may be drawn.
(1) The amount of hydrogen permeation charge decreases with the cycle numbers in all shapes.
(2) After the test, Zn corrosion products, simonkolleite (Zn5(OH)8Cl2), presented around and on the formed scratch. They prevented hydrogen entry and reduced corrosion reaction rate by fixing Cl−.
(3) The total hydrogen permeation charge decreased with aspect ratio because Zn corrosion products easily covered high aspect ratio scratch.
(4) The total hydrogen permeation charge of the 4.67 mm2 scratches was larger than that of the 2.07 mm2 scratches because Zn corrosion products hardly covered large scratch.
(5) Hydrogen permeation current during one cycle had two peaks in the wetting and heating processes. The sacrificial corrosion reaction of Zn and the NaCl concentration increased by evaporation caused two peaks.
Acknowledgements
SEM observation of this work was conducted at the Laboratory of XPS analysis, Joint-use facilities, Hokkaido University, supported by “Material Analysis and Structure Analysis Open Unit (MASAOU). XPS analysis was conducted at the Laboratory of XPS analysis, Hokkaido University, supported by ‘Nanotechnology Platform’ Program of the Ministry of Education, Culture, Sports, Science and Technology (MEXT), Japan.
References
- 1) M. Kitagawa: Struct. Control Health Monit., 11 (2004), 75.
- 2) A. R. Troiano: Corrosion, 15 (1959), 57.
- 3) M. Nagumo, M. Nakamura and K. Takai: Metall. Mater. Trans. A, 32 (2001), 339.
- 4) T. Schaffner, A. Hartmaier, V. Kokotin and M. Pohl: J. Alloys Compd., 746 (2018), 557.
- 5) T. Michler, Y. Lee, R. P. Gangloff and J. Naumann: Int. J. Hydrog. Energy, 34 (2009), 3201.
- 6) K. Ebihara, T. Iwamoto, Y. Matsubara, H. Yamada, T. Okamura, W. Urushihara and T. Omura: ISIJ Int., 54 (2014), 153.
- 7) H. Hatano, M. Fujinami, K. Arai, H. Fujii and M. Nagumo: Acta Mater., 67 (2014), 342.
- 8) M. Koyama, H. Springer, S. V. Merzlikin, K. Tsuzaki, E. Akiyama and D. Rabbe: Int. J. Hydrog. Energy, 39 (2014), 4634.
- 9) A. Nagao, C. D. Smith, M. Dadfarnia, P. Sofronis and I. M. Robertson: Procedia Mater. Sci., 3 (2014), 1700.
- 10) T. Matsuno, Y. Sekito, E. Sakurada, T. Suzuki, K. Kawasaki and M. Suehiro: ISIJ Int., 54 (2014), 2369.
- 11) A. Nagao, M. L. Martin, M. Dadfarnia, P. Sofronis and I. M. Robertson: Acta Mater., 74 (2014), 244.
- 12) D. Hirakami, T. Manabe, K. Ushioda, K. Noguchi, K. Takai, Y. Hata, S. Hata and H. Nakashima: Tetsu-to-Hagané, 101 (2015), 59 (in Japanese).
- 13) T. Michler, J. Naumann, M. Hock, K. Berreth, M. P. Balogh and E. Sattler: Mater. Sci. Eng. A, 628 (2015), 252.
- 14) I. Park, S. Lee, H. Jeon and Y. Lee: Corros. Sci., 93 (2015), 63.
- 15) T. Kushida: ISIJ Int., 43 (2003), 470.
- 16) S. Fujita and D. Mizuno: Corros. Sci., 49 (2007), 211.
- 17) E. Tada and Y. Miura: ISIJ Int., 56 (2016), 444.
- 18) K. Igarashi and M. Sakairi: ISIJ Int., 56 (2016), 465.
- 19) S. Ootsuka, S. Fujita, E. Tada, A. Nishikata and T. Tsuru: Corros. Sci., 98 (2015), 430.
- 20) M. C. Bernard, A. Hugot-Le Goff, D. Massinon and N. Phillips: Corros. Sci., 35 (1993), 1339.
- 21) J. Kasperek and M. Lenglet: Metall. Res. Technol., 94 (1997), 713.
- 22) T. Ohtsuka and Y. Abe: Proc. Galvatech ’07, ISIJ, Tokyo, (2007), 648.
- 23) T. Ohtsuka and M. Matsuda: Corrosion, 59 (2003), 407.
- 24) K. Hayashi and Y. Miyoshi: Tetsu-to-Hagané, 78 (1992), 601 (in Japanese).
- 25) M. S. Islam, K. Otani and M. Sakairi: ISIJ Int., 58 (2018), 1616.
- 26) M. S. Islam, K. Otani and M. Sakairi: Corros. Sci., 131 (2018), 17.
- 27) T. Igarashi, K. Otani, C. Kato, M. Sakairi, Y. Togashi, K. Baba and S. Takagi: ISIJ Int., 61 (2021), 1083.
- 28) T. Sekine, Y. Nagasawa, M. Kudoh, Y. Sakai, A. S. Parkes, J. D. Geller, A. Mogami and K. Hirata: Handbook of Auger Electron Spectroscopy, JEOL Ltd., Tokyo, (1982), 28.
- 29) K. Tsutsumi, A. Tanaka, M. Shima and T. Tazawa: J. Surf. Sci. Soc. Jpn., 33 (2012), 431 (in Japanese).
- 30) K. Tsutsumi: J. Surf. Finish. Soc. Jpn., 66 (2015), 621 (in Japanese).
- 31) K. Tsutsumi, Y. Nagasawa, H. Watanabe and S. Endo: Proc. 26th Japan Society of Vacuum and Surface Science conf., The Surface Science Society of Japan, Tokyo, (2006), 4D23 (in Japanese). https://doi.org/10.14886/sssj.26.0.290.0
- 32) K. Tsutsumi, A. Tanaka and M. Shima: Proc. Japan Society of Vacuum and Surface Science conf., The Japan Society of Vacuum and Surface Science, Tokyo, (2018), 3Bp11 (in Japanese). https://doi.org/10.14886/sssj2008.2018.0_336


