Special Issue on "Toward Suppression of Hydrogen Absorption and Hydrogen Embrittlement for Steels"
Volumetric Strain Dependence of Quantum Diffusion of Hydrogen in bcc Iron
2021 年 61 巻 4 号 p. 1294-1299

詳細
2021 年 61 巻 4 号 p. 1294-1299
To predict hydrogen embrittlement in steels and clarify its mechanism, it is necessary to understand the time variation of hydrogen distribution. Since the quantum mechanical effect is remarkably observed in hydrogen diffusion, even at room temperature, there is a need to take into account it for analyses. In this study, we evaluated the diffusion coefficients of hydrogen in body-centered cubic (bcc) iron via density functional theory and small-polaron theory calculations. The analyses were carried out under various magnitudes of volumetric strains to investigate its effect on the diffusion coefficient. The temperature dependence of the diffusion coefficient was found to change at about 400 K. This is attributed to the fact that the tunneling between ground states dominantly contributes to the diffusion at lower temperatures, whereas at high temperatures, that between low excited states contributes dominantly. The diffusion coefficient was also found to increase with compressive volumetric strain and decrease with tensile volumetric strain. The volumetric strain dependence of the diffusion coefficient was clarified by the volumetric strain dependence of the tunneling matrix elements and that of the activation enthalpy.
To predict hydrogen embrittlement in steels and to understand its mechanism, the time variation of hydrogen distribution, i.e., the diffusion behavior of hydrogen, needs to be studied. It has been found that in iron, the diffusion behavior changes remarkably at about 500 K due to the quantum mechanical effect, which emerges at lower temperatures.1) Thus, for iron, though the classical molecular dynamics (MD) calculation is effective in analyzing the phenomenon at higher temperatures, analyses that adopt the quantum mechanical effect are required at lower temperatures, including room temperature. As a hydrogen atom has the lightest mass, among all atoms, quantum mechanical effects, such as tunneling effect, remarkably affect its diffusion behavior in solids.2) The quantum mechanical effect tends to strongly affect hydrogen diffusion in body-centered cubic (bcc) metals due to the short jump distance. The effect is remarkable in iron, which has the smallest lattice constant among the bcc transition metals.
In the prediction and evaluation of hydrogen diffusion in metals, a diffusion equation that incorporates a term dependent on the gradient of isotropic stress is employed.3,4,5) On the other hand, it is also important to clarify the stress or strain dependence of the diffusion coefficient. Taketomi and Matsumoto carried out an analysis via the MD method, and found that the hydrogen diffusion behavior in bcc iron exhibits strong anisotropy around the edge dislocation. They attributed the behavior to the contribution of anisotropic stress.6) Nagase and Matsumoto also evaluated the stress dependence of the diffusion coefficient of hydrogen in bcc iron via the MD method.7,8) However, the effect of stress on the quantum diffusion of hydrogen is yet to be clarified.
The small-polaron theory9,10) by Holstein, which was basically developed to describe the tunneling process of electrons in semiconductors and insulators, was extended to studying the diffusion of hydrogen in metals by Flynn and Stoneham.11) The hydrogen diffusion behavior of various bcc metals, such as vanadium,12,13) niobium,12,14,15,16,17) and tantalum,12,15,16,17) has been analyzed via the small-polaron theory. In addition, the small-polaron theory has been employed in the analysis of iron;18) however, the calculations considering higher-order excited states and the evaluation under stress or strain are yet to be carried out.
This study aims at clarifying the quantum diffusion behavior of hydrogen in bcc iron under volumetric strain via density functional theory (DFT) and small-polaron theory calculations.
Hydrogen in bcc iron occupies a tetrahedral interstitial site (T-site).19,20,21) The repulsive force from the hydrogen atom pushes the surrounding iron atoms outward, and thus, the potential well is lowered. This makes the hydrogen atom more stable at the T-site, and this is called self-trapped state.2) For a hydrogen atom in the self-trapped state at a T-site to move through a potential wall to an adjacent T-site via tunneling, thermal activation is required to bring the energy levels of the initial and final sites of the migration to the same height.22) When the energy levels of the two sites are at the same height, they are referred to as a coincidence state. Though diffusion via tunneling can occur between excited states, further activation enthalpy is required.
2.2. Calculation Method of Diffusion Coefficient by Tunneling ProcessIn this paper, the following equation used by Klamt and Teichler as the jump frequency is employed to calculate the diffusion coefficient considering the quantum mechanical effect:15)
| (1) |
| (2) |
There are two types of coincidence states: symmetric coincidence states, where the excited states of the initial and final states are the same, i.e., i = j, and asymmetric coincidence states, where they are different, i.e., i ≠ j. The contribution of the tunneling process through asymmetric coincidence states has been found to be small,13,15) and hence, we considered only symmetric coincidence states in this study.
To evaluate wij using Eq. (1), ε0i, Jii, and Eaii are required; herein, they are determined using Yoshinari’s procedure for the vanadium–hydrogen system13) (see also the flowchart shown in Fig. 1):

Flowchart of the calculation of diffusion coefficient.
1) The atomic configurations of iron are obtained when the hydrogen atom is in the self-trapped state at a T-site and when it is in the saddle point (SP) configuration during classical diffusion between adjacent T-sites. The former is obtained by inserting a hydrogen atom into the T-site of the iron lattice and performing structural relaxation, while the latter is obtained via the nudged elastic band (NEB) method.
2) The potential energy surface (PESs) of hydrogen for the atomic configurations of iron are calculated when the hydrogen atoms are at the T-site and at the SP. Mapping of 3D PES is carried out by assigning grid points to the rectangular parallelepiped region centered on the midpoint of the two adjacent T-sites (Fig. 2), and repeating DFT calculations where the iron atoms are fixed to the positions obtained in step 1) and the hydrogen atom is fixed to each grid point. In this study, to reduce the calculation cost, the following two contrivances are conducted. First, we consider the symmetry of the calculation region of the PES; it is symmetrical along the (001) plane containing two T-sites, as well as along a plane parallel to the xz-plane and including the initial T-site when the hydrogen atom is in the self-trapped state at the T site. It is as well-symmetrical along the (110) plane when the hydrogen is at the SP. Second, as a very high ground-state energy is obtained when the iron and hydrogen atoms are close to each other, the DFT calculation is not conducted at the grid points where the distance to the closest iron atom is 0.4 a0 or less, where a0 is the lattice constant of iron in the no-strain state. The ground-state energy for these configurations is set to 0 eV. With these two measures, the number of grid points for calculating the PES can be reduced to about 1/6 or 1/5.
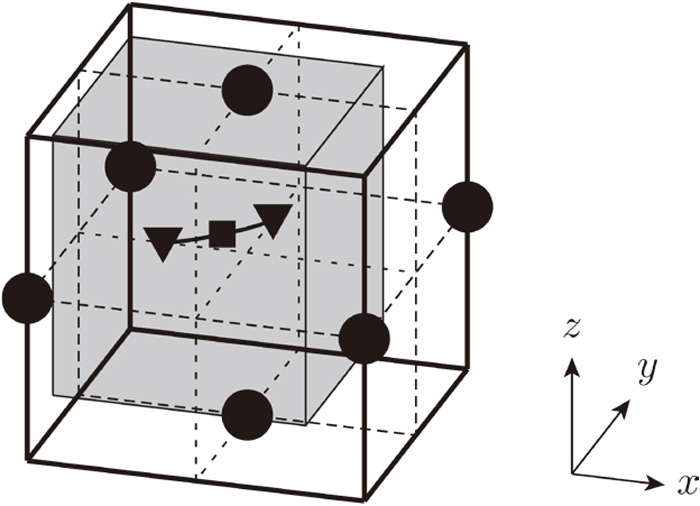
Calculation region for PES. ●, ▼, and ■ indicate Fe atoms, T-sites, and SP, respectively. The 3D PES was calculated for the shaded region.
3) The eigenenergies of the hydrogen atom are calculated by solving the Schrödinger equation for the PES of the hydrogen at the T-site and SP configurations obtained from the spline interpolation. The Fourier grid Hamiltonian (FGH) method23) is employed to solve the Schrödinger equation. ε0i is calculated from the initial configuration. Two coincidence states are obtained13) at the SP configuration where the corresponding wave functions have the same and opposite signs at the two T sites, and those eigenenergies are
4) From the eigenenergies of the hydrogen atom at the T-site and at the SP, the parameters Jii and Eaii are calculated, using which the jump frequency wii is obtained. Jii is obtained as
5) On the basis of the random walk theory,25) the diffusion coefficient D is obtained from the jump frequency wii. The diffusion coefficient is given as
| (3) |
| (4) |
In this study, the Vienna Ab-initio Simulation Package26,27,28) is employed for the DFT calculations. In all analyses, the generalized gradient approximation exchange-correlation energy function of Perdew–Burke–Ernzerhof29) is employed for the approximation of the exchange-correlation energy. The projector augmented wave method30) is used for the treatment of the core electron, and the calculation considering the electron spin is carried out. The Monkhorst-Pack scheme31) is used to define the k-points.
A 2 × 2 × 2 bcc lattice supercell, which contains 16 iron atoms and 1 hydrogen atom (Fe16H1), is used for all calculations. A k-point mesh of 9 × 9 × 9 is used. The cutoff energy is set to 500 eV for the structural relaxation and the NEB calculations and 475 eV for the PES calculation. These calculation conditions are set so as to obtain sufficient calculation accuracy after carrying out comparative calculations. To evaluate the volumetric strain dependence, the calculation is carried out under the conditions of 0.0, ±0.6, ±1.5, and ±3.0% volumetric strains. Under the no-strain condition, both cell size and atomic positions are relaxed in the structural relaxation and NEB calculations. For the with-strain conditions, the predetermined volumetric strain is applied to each atomic configuration obtained from the no-strain condition. During the structural relaxation and NEB calculations under strain conditions, the cell sizes are fixed, and thus, only the atomic positions are relaxed.
The number of intermediate atomic configurations in the NEB calculation is three, and the initial path is obtained from the linear interpolation between the initial and final states. The PES calculations are performed on a rectangular parallelepiped region of 0.75 ax × 0.75 ay × 0.8 az, where ax, ay, and az are the lattice constants in the x, y, and z directions, respectively, giving rise to PES grid points of 13 × 13 × 13. The FGH calculation is performed for 25 × 25 × 25 PES grid points obtained by applying the spline interpolation to 13 × 13 × 13 PES grid points.
Figure 3 shows the minimum energy path (MEP) for the classical diffusion of hydrogen atoms obtained via NEB under the no-strain condition. The result is in good agreement with that of the DFT calculation performed for the model of Fe128H1 by Jiang et al.21) The SP energy, which is based on the energy of the self-trapped state, is determined as 86 meV in this analysis, which is also in good agreement with the 88 meV reported by Jiang et al.21) Thus, it can be said that this analysis for the Fe16H1 model can appropriately reproduce the hydrogen diffusion in larger lattices. Here, the volumetric strain at the SP was obtained as 2.6 × 10⁻⁴ for the current model. We neglect its influence on the activation enthalpy in Section 3.2, because the contribution is very small, that is < 1 meV under 3% of volumetric strain condition.

Initial path and MEP obtained via NEB calculation.
Figure 4 shows the PES of hydrogen in the cross-section including the initial and final T-sites. Figure 4(a) shows the PES for the initial state. The minimum value of energy when the hydrogen atom is near the T-site is taken to be zero of PES. When the hydrogen atom is near the T-site located at (0.25, 0.5, 0.5), the energy is 50–100 meV lower than that in the case where the hydrogen is at other T-sites; that is, the hydrogen atom is in a self-trapped state at the T-site. The PES for the atomic configuration of iron when the hydrogen atom is present at the SP is shown in Fig. 4(b).

PES at the cross-section including initial and final T sites. (a) Self-trapped configuration at a T site. (b) SP configuration: The coordinates are expressed on the basis of the lattice constant in each axial direction. (Online version in color.)
The eigenenergies of the self-trapped state of the hydrogen atom obtained by solving the Schrödinger equation using the FGH method are listed in Table 1. The energy value is based on the ground state energy of the system when the hydrogen atom is at the self-trapped configuration. The wave functions of the various eigenstates are shown in the upper panel of Fig. 5. The wave functions are visualized using a 3D visualization code, VESTA.32) Here, each eigenstate is classified according to the shape of the corresponding wave function. First, the ground state is termed the g-state. The excited states are classified by the number and direction of nodal planes of the wave function. For example, the 1x state indicates one nodal plane perpendicular to the x-direction.
| Eigenstate | g | 1x | 1y | 1z | 2x |
|---|---|---|---|---|---|
| Eigenenergy ε0 | 232 | 327 | 373 | 385 | 412 |

Wave functions of hydrogen at the self-trapped position (upper panel) and those at coincidence state (lower panel) in bcc iron. (Online version in color.)
The wave function in the coincidence state is shown in the lower panel of Fig. 5. As mentioned in Section 2.2, two coincidence states in which the corresponding wave function has the same sign and that with opposite signs at the two T-sites for the SP configuration are obtained. For example, regarding the coincidence between the g-states, the former is expressed as g-g and the latter as (g-g)*.
The tunneling matrix element J in each coincidence state, the energy in the coincidence state Ec, and the activation enthalpy Ea are listed in Table 2. It is found that J between the excited states (1x-1x, 1y-1y) is larger than that between the ground states (g-g). This can be attributed to the fact that the wave function spatially expands along a specific direction at an excited state, and thus, the overlap of the wave functions of the initial and final T sites of the migration increases.
| Coincidence state | g-g | 1x-1x | 1y-1y | 1z-1z | 2x-2x |
|---|---|---|---|---|---|
| Tunneling matrix element J | 12 | 19 | 27 | 4 | 10 |
| Coincidence State Energy Ec | 264 | 362 | 396 | 468 | 450 |
| Activation enthalpy Ea | 32 | 35 | 12 | 94 | 38 |
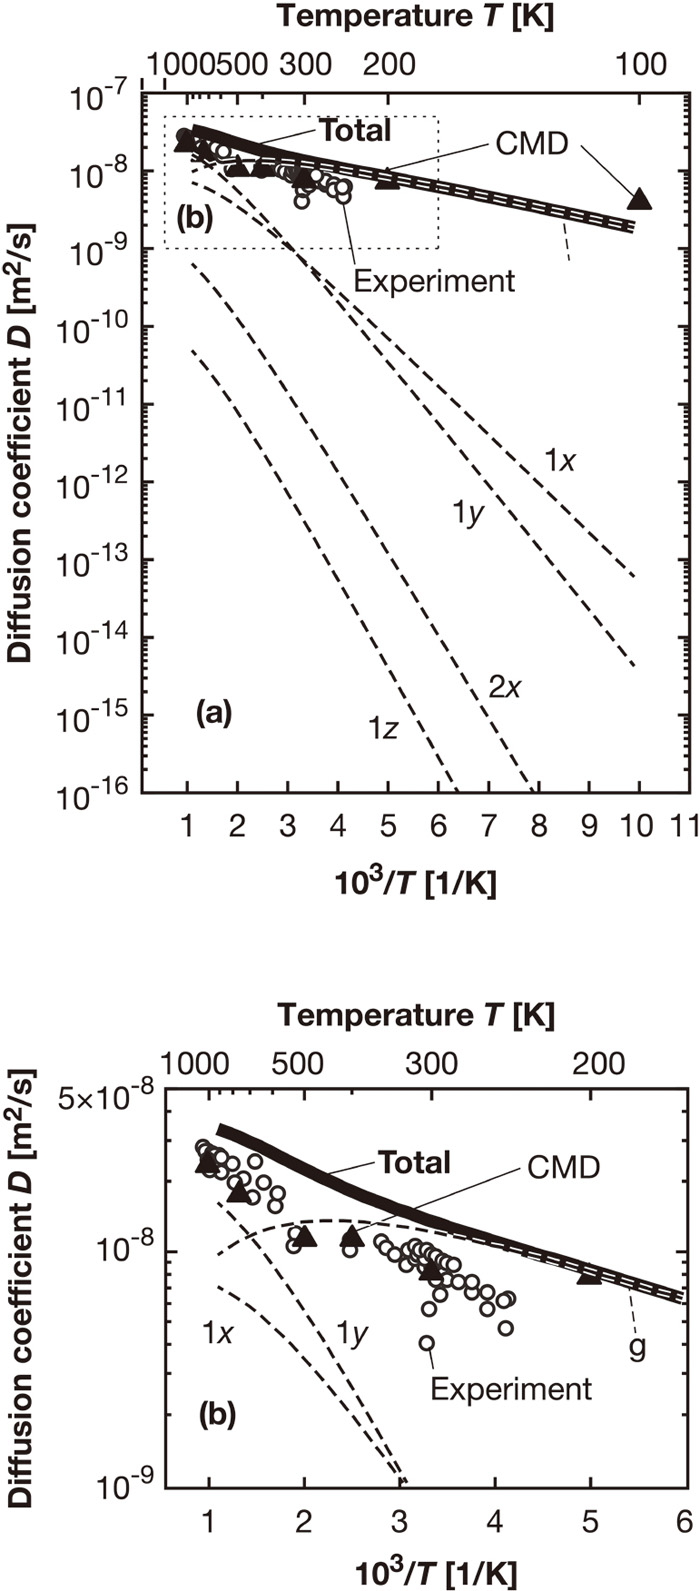
The diffusion coefficient is calculated using Eq. (3). The Arrhenius plots of the contribution of each coincidence state shown by a broken line and the total diffusion coefficient shown by a thick line are shown in Fig. 6. The value obtained using the path integral centroid molecular dynamics (CMD) method1) is indicated by ▲, and that from experiments33,34,35,36,37,38) is indicated by ○. In the CMD method, the interaction forces are calculated based on the interatomic potential, and the motion of hydrogen atom follows quantum mechanics. Figure 6 shows that the calculation in this study provided a slightly higher diffusion coefficient than the reference values. The difference may be due to the influences of lattice defects and impurity elements in the experiment, the accuracy of the interatomic potential in CMD, and the limitation of the model size in this study. A bend is observed in the total diffusion coefficient curve at about 400 K. This temperature is slightly lower than the transition temperature estimated via the CMD method,1) i.e., 500 K where the transition from quantum to classical diffusion occurs. It is found that the diffusion through the g-g coincidence state is dominant at low temperatures, whereas the contribution from the diffusion in the 1y-1y state is dominant at high temperatures. Here, the 2x-2x state showed a smaller contribution to the diffusion, although the values of J and Ea are close to those of the g-g state, as shown in Table 2. This is attributed to the fact that the eigenenergy ε02x is high, as shown in Table 1, and hence, additional energy is required for excitation.
The diffusion coefficients are calculated under 0.0, ±0.6, ±1.5, and ±3.0% volumetric strain conditions, as stated in the previous section. The volumetric strain dependence of the tunneling matrix element J and that of the activation enthalpy Ea are shown in Figs. 7 and 8, respectively. As shown in the figure, J increases slightly with compressive strain and decreases slightly with an increase in tensile strain. This is considered to be caused by the increase in the overlap of the wave functions by approaching two T-sites as a result of compressive strain. On the other hand, Ea tends to increase with tensile strain. The strain effect is stronger for the excited states. The jump frequency is an increasing function of J and a decreasing function of Ea. In other words, the trends of both J and Ea under volumetric strain contribute to the direction in which the jump frequency increases due to compressive strain and decreases due to tensile strain. Thus, the diffusion coefficient is also expected to increase with compressive strain and decrease with tensile strain.

Volumetric strain dependence of the tunneling matrix element J.

Volumetric strain dependency of the activation enthalpy Ea.
The Arrhenius plots of the diffusion coefficients obtained under each volumetric strain condition are shown in Fig. 9. Here, only the total diffusion coefficient and g, 1x, and 1y states, which show large contributions, are shown. As shown in the figure, the diffusion coefficient increases with compressive strain, and decreases with increasing tensile strain. This is consistent with the volumetric strain dependence of the diffusion coefficient predicted from the trends of J and Ea under the volumetric strain. The changes in the diffusion coefficient observed at 300 K under 3% compressive and tensile volumetric strain are about 23% and −14%, respectively.

Diffusion coefficients of hydrogen in bcc iron under volumetric strain. (Online version in color.)
The stress dependence of the diffusion coefficient of hydrogen in Pd was evaluated via the MD method by Nishimura.39) The diffusion coefficient was found to decrease with increasing compression. This demonstrates a trend opposite to that obtained in this study. While Pd has a relatively long jump distance for the hydrogen diffusion, bcc iron has the very short jump distance where the tunneling effect strongly appears. The diffusion is anticipated to be promoted in the compressive strain side of an edge dislocation in bcc iron, whereas it is promoted in the tensile strain side of the dislocation in Pd.40)
In this study, we evaluated the diffusion coefficient of hydrogen in bcc iron using DFT and small-polaron theory. The effect of volumetric strain on hydrogen diffusion was also clarified.
We ascertained that in the no-strain condition, the ground state (g-state) and the low excited state (1y state) mainly contributed to the diffusion; the former dominated at low temperatures, while the latter dominated at high temperatures. A bend was observed in the Arrhenius plot of the diffusion coefficient at about 400 K, which is inferred to be caused by the change in the excited state, which is dominant in the diffusion. The contributions of the g and 1y states under volumetric strain, as well as under the no-strain condition, were high. The diffusion coefficient was found to increase with compressive volumetric strain and decrease with increasing tensile volumetric strain. The volumetric strain dependence of the diffusion coefficient was clarified by evaluating the volumetric strain dependence of the tunneling matrix element J and that of the activation enthalpy Ea.