Abstract
Duplex stainless steels and their deposited weld metal have ferrite and austenite microstructures with different material properties. In addition, the microstructure of the base metal and weld metal clearly differs, affecting hydrogen diffusion and accumulation, and hydrogen-induced cracking behavior at the microstructural scale. In this study, the influence of microstructure on hydrogen-induced cracking behavior of the duplex stainless-steel weld metal was investigated. Duplex stainless-steel weld metal specimens were prepared and slow strain rate tensile test was performed after hydrogen charging. Cracks were observed at the ferrite/austenite boundaries. A microstructure-based finite element simulation was performed to clarify the concentration distribution at the microstructural scale. A finite element model based on the cross-section of the microstructure was designed to calculate the stress and hydrogen concentration distribution. The simulation result showed that hydrogen accumulation occurred at the ferrite/austenite boundaries, which corresponded to the locations where cracks were observed. On the other hand, the hydrogen concentration at the accumulation site in the weld metal was lower than that in the base metal. Therefore, the influence of the phase fraction and stress–strain curves of the ferrite and austenite phases on the hydrogen concentration was investigated by the proposed numerical simulation. Both phase fraction and stress–strain curves significantly influenced the microscopic distribution of hydrogen concentration.
1. Introduction
In severe corrosive environments, duplex stainless steels are often used with electrical corrosion protection. However, several reports noted that this results to hydrogen cracking.1) Stress and strain distribution2) and its corresponding hydrogen diffusion behavior are strongly influenced by the microstructure morphology3,4) of duplex stainless steels with heterogeneous structures composed of ferrite and austenite phases with different mechanical properties, hydrogen solubility, and hydrogen diffusion coefficient. However, stress and diffusible hydrogen concentration distribution are influenced by the microstructure and their effects on hydrogen cracking have not been sufficiently studied. Thus, in the present study, the effect of the duplex stainless steel microstructure on the hydrogen cracking characteristics at the microstructure level was investigated by numerical analysis methods.
In the previous report,1) a slow strain rate tensile (SSRT) test was conducted after hydrogen charging using a duplex stainless-steel base metal consisting of a ferrite and austenite phase, hereinafter referred to as “base metal”. Through cross-sectional and fracture surface observation, the relationship between the hydrogen crack initiation site and microstructure was examined, confirming the occurrence of hydrogen cracking mainly in the ferrite phase. In addition, elasto-plastic analysis and hydrogen diffusion analysis were performed to obtain the stress distribution at the microstructure scale and diffusible hydrogen concentration distribution. The region with accumulated diffusible hydrogen and high tensile stress was observed in the ferrite phase, resulting in hydrogen cracking. This corresponded to the cracks confirmed by the cross-sectional observation of the hydrogen-charged material after SSRT test. Thus, the characteristics of hydrogen cracking can be examined by simulation based on the microstructure-level stress and diffusible hydrogen concentration distribution.
Microstructure morphology strongly influences stress distribution at the microstructure level, thereby altering hydrogen diffusion and accumulation behavior, and hydrogen cracking characteristics. In the case of duplex stainless steel, hydrogen cracking was noted in the vicinity of the weld.5,6,7,8,9,10,11) Previous studies on the hydrogen behavior in weld metals focused on the measuring the hydrogen diffusion coefficient,12,13) effect of phase ratio on hydrogen cracking,14,15,16,17,18,19,20) and effect of different base metal microstructure on hydrogen solubility.21,22,23) With this, there is insufficient knowledge on the effect of microstructure on hydrogen diffusion and accumulation behavior under applied stress.
In this report, the effect of microstructure on the hydrogen cracking of the duplex stainless-steel weld metal were investigated. Hydrogen crack initiation characteristics were examined based on microstructure level stress and diffusible hydrogen concentration distribution. The fracture and cross-sectional observations of the hydrogen-charged weld metal, elasto-plastic analysis using a microstructure model, and hydrogen diffusion analysis were carried out to investigate the effect of steel microstructure on hydrogen cracking characteristics. The results were then compared with those of the base metal.1) In addition, the effect of the ferrite and austenite phase ratio and their respective material properties were also investigated.
2. Experiment and Numerical Simulation Methods
2.1. Slow Strain Rate Tensile Test after Hydrogen Charging
2.1.1. Fabrication of Multi-pass Weld Metal
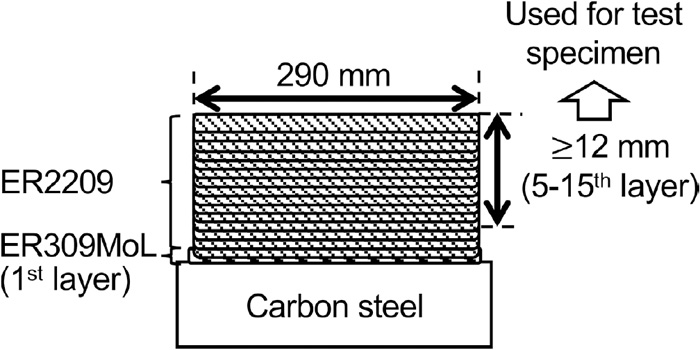
A multi-pass weld metal was fabricated by gas tungsten arc welding using ER2209, a welding wire for 22% Cr-based duplex stainless steel. Tables 1, 2, and Fig. 1 show the chemical compositions of the weld metal, welding conditions, and schematic of the pass sequence of the multi-pass weld metal, respectively. A single layer of ER309MoL was applied to the carbon steel plate, followed by 15 layers of ER2209. The weld metal until the fourth layer, including the diluted welds, were removed as non-used beads.
Table 1. Chemical composition of the welding wires used (mass%).
| Welding wire | C | Si | Mn | P | S | Ni | Cr | Mo | Cu | N |
|---|
| ER2209 | 0.013 | 0.41 | 1.47 | 0.016 | 0.001 | 8.82 | 23.50 | 3.25 | 0.05 | 0.16 |
| ER309MoL | 0.021 | 0.43 | 2.02 | 0.020 | 0.001 | 13.53 | 23.40 | 2.21 | 0.05 | – |
Table 2. Welding condition for the fabrication of multipass deposited welding metal.
| Welding process | Welding current | Arc voltage | Travel speed | Deposition rate | Interpass temperature | Shielding gas |
|---|
| GTAW | 200 A | 9.6–10.5 V | 30 cm/min | 10 g/min | < 150°C | 98%Ar + 2%N2 |
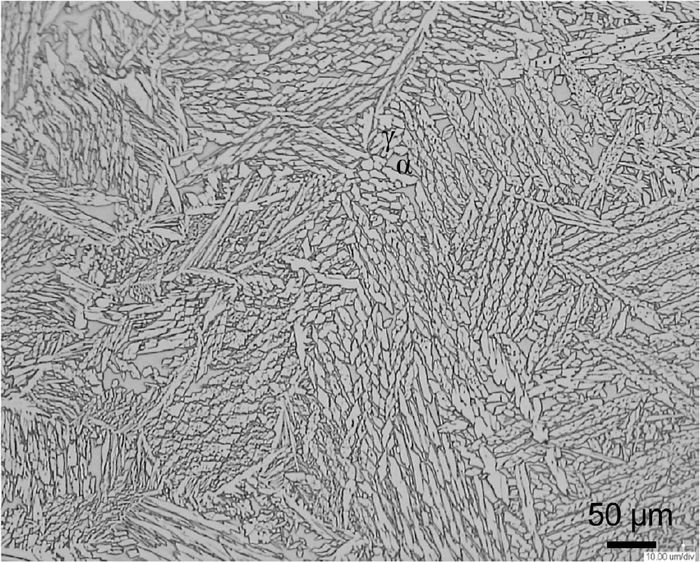
Figure 2 shows the microstructure of the fabricated multi-pass weld metal. Unlike the layered microstructure of the base metal in the previous report,1) the ferrite and austenite phases were randomly distributed. Crystal orientation analysis by electron backscatter diffraction (EBSD) method was performed with a step size of 0.5 μm after polishing with colloidal silica. The area ratio of the ferrite and austenite phases were measured to be 26% and 74%, respectively. Hence, the microstructure was mainly composed of the austenite phase.
2.1.2. Slow Strain Rate Tensile Test Method
When performing the SSRT test, the charged amount of diffusible hydrogen differs depending on the microstructure. A round bar with 3 mm diameter and 25 mm length, corresponding to the parallel part of the SSRT test specimen, was sampled from the fabricated multilayered weld metal. The specimen was composed only of the weld metal that was not affected by the base metal or dilution. Similar to the base metal, the specimen was electrochemically charged with hydrogen at 25°C, pH 2.5-sulfuric acid + 1% NH4SCN aqueous solution, current density of 1.0 mA/cm2, and charging period of one week and three weeks. The diffusible hydrogen charged in the test piece was 70 ppm and 140 ppm after one- and three-week charging, respectively. In the case of the base metal, it was approximately 86 ppm in one week and 136 ppm in three weeks.1) It was confirmed that one-week charging was sufficient to discuss the influence of the diffusible hydrogen in the previous report,1) therefore, the charging period of the test piece used in the SSRT test was set to one week.
SSRT tests were conducted using hydrogen-charged and uncharged specimens with non-plated surfaces to prevent the release of diffusible hydrogen. The crosshead displacement speed was 0.005 mm/min. For the charged specimen, the test was started immediately after hydrogen charging. The apparent strain rate in SSRT test is calculated to be 3.3×10⁻⁶ s–1, assuming that the 25 mm long parallel portion was subjected to the same displacement rate. This apparent strain rate was used in the numerical simulation model.
After the SSRT test, the fracture surface and cross-section were observed using a scanning electron microscope and optical microscope, respectively. For the cross-section, the optical microscope was used to observe the plane parallel to the longitudinal direction of the specimen, which is composed of its rolling and plate thickness direction. The fractured specimen was embedded in the resin, wet-polished up to #2000 emery paper, buffed with 6 μm, 3 μm, and 1 μm diamond paste, respectively, and finish-polished with alumina suspension. The microstructure was exposed by electrolytic corrosion with 33% aqueous potassium hydroxide solution.
2.2. Numerical Simulation Method
The numerical simulation of the stress distribution and diffusible hydrogen concentration distribution of the weld metal at a microstructure scale was performed using the same method in the previous report.1) This section describes the different procedures and conditions in changing the numerical simulation target to the weld metal.
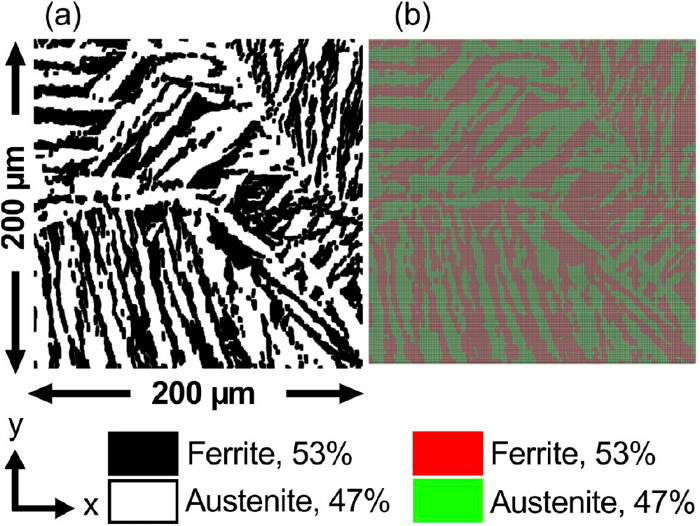
First, a finite element model of the weld metal microstructure was generated using the phase map of the weld microstructure of the duplex stainless steel obtained by EBSD, as shown in Fig. 3(a). The generated finite element model of the microstructure shown in Fig. 3(b) was created using OOF2 (version 2.1.12),24) consisting of 40000 elements and 40401 nodes with a 200 μm × 200 μm region uniformly divided by two-dimensional 1 μm × 1 μm quadrilateral elements. A two-dimensional four-node plane strain element was used for the elasto-plastic analysis, and two-dimensional four-node mass diffusion element was used for the hydrogen diffusion analysis. Each element in Fig. 3(b) was classified as ferrite or austenite based on the microstructure photograph. The material properties, i.e., stress–strain curve and diffusion properties, were set. The boundary conditions were set so that the upper, lower, left, and right ends of the finite element model would hold straight lines and forced displacement was applied in the loading direction. Figure 3(c) shows an enlarged part of the model to show the distinction of the elements and their respective phases.

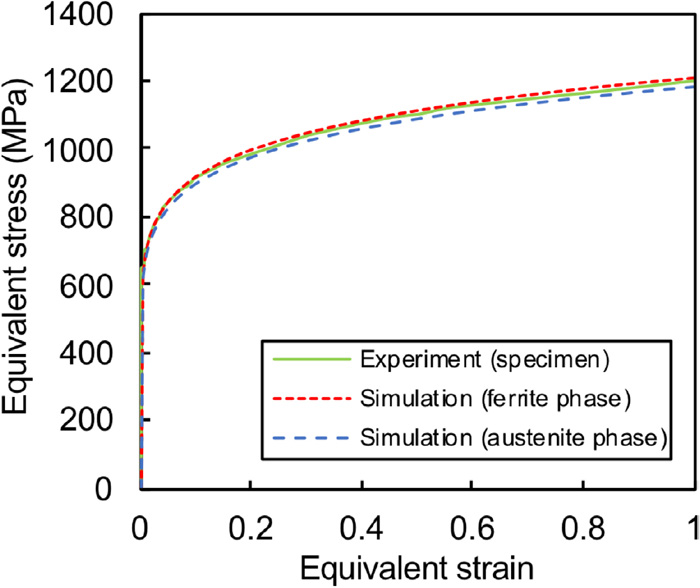
The stress–strain curves of the ferrite and austenite phases of the weld metals are shown in Fig. 4. They were estimated using an area fraction SF:SA of 26:74 and hardness ratio HVF/HVA of 1.02 of the ferrite (F) and austenite (A) phases based on the macroscopic stress–strain curves of the weld metals obtained from SSRT tests. The estimated stress–strain curve of both phases has minimal variations from each other and a significant difference from that of the base metal.
For the hydrogen diffusion analysis, Table 3 shows the hydrogen diffusion coefficient and hydrogen solubility of the ferrite and austenite phases for duplex stainless steels based on existing literature.25) The initial conditions in the hydrogen diffusion analysis were set to achieve the local equilibrium state in the numerical simulation model and the normalized concentration φ was set constant in the model. The diffusible hydrogen concentration differs between the ferrite and austenite phases due to their different hydrogen solubility.1) Thus, the average diffusible hydrogen concentration across the finite element model was set to 70 ppm, which is the average diffusible hydrogen concentration after one-week charging. With this, the initial diffusible hydrogen concentrations for ferrite and austenite phases were 0.096 ppm and 94 ppm, respectively. Since this study aims to change the local diffusible hydrogen concentration distribution, the amount of diffusible hydrogen was set constant for the entire numerical analysis model. In other words, the inflow or outflow of diffusible hydrogen were not considered.
Table 3. Material properties used in the hydrogen diffusion analysis.
25)| Phase | Diffusion coefficient, D (m2/s) | Solubility, s (ppm·mm/N1/2) |
|---|
| Ferrite | 6.0 × 10⁻¹¹ | 0.033 |
| Austenite | 1.4 × 10⁻¹⁶ | 32.51 |
3. Results and Discussion
3.1. Slow Strain Rate Tensile Test after Hydrogen Charging
3.1.1. Slow Strain Rate Tensile Test
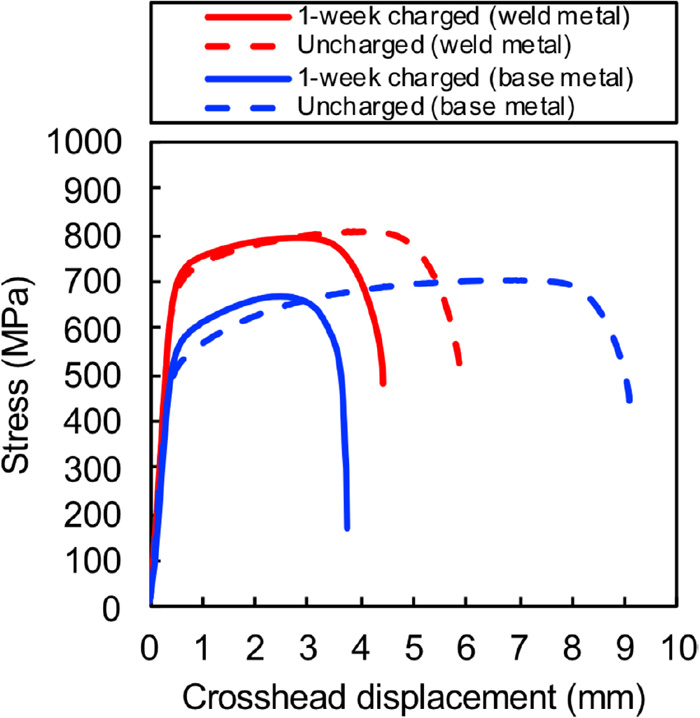
Figure 5 shows the nominal stress–crosshead displacement curve obtained by the SSRT test and that of the base metal1) for comparison. Similar to the base metal, the fracture elongation of the weld metal evidently reduced in the hydrogen-charged specimen. However, the ratio of decrease in the elongation of the weld metal is smaller than that of the base metal and the influence of diffusible hydrogen is relatively small.
3.1.2. Fracture Surface Observation after Slow Strain Rate Tensile Test
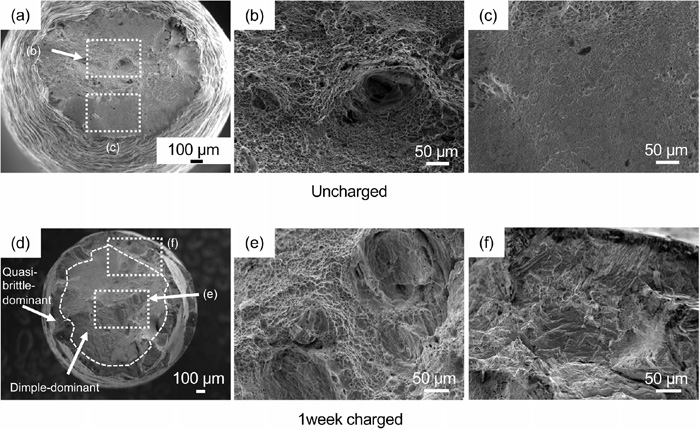
Figures 6(a)–6(c) and 6(d)–6(f) show the fracture surfaces of the uncharged and hydrogen-charged weld metal, respectively. Compared to the fracture surface of the base metal with anisotropy due to the rolling microstructure, the welded metal specimens with randomly distributed microstructure as shown in Fig. 2 are isotropically deformed with a nearly circular fracture surface. Focusing on the effect of diffusible hydrogen, the uncharged material showed considerable necking, whereas the charged material showed minimal necking. The uncharged specimen has a dimple-dominated fracture surface while the charged material has a quasi-cleavage fracture surface, which can be attributed to the effect of diffusible hydrogen. In Fig. 6(d), the regions of the dimple-dominated fracture surfaces and quasi-cleavage fracture surfaces are shown separately. Similar to the base metal, the quasi-cleavage fracture surface is predominant around the outer edge of the fracture surface. The diffusible hydrogen was charged from the surface of the specimen, thereby influencing more prominently near the surface. Compared with the fracture surface of the charged base metal shown in the previous report,1) the region exhibiting quasi-cleavage fracture surface is small even with similar charging conditions. It is possible that diffusible hydrogen affected a smaller area in the weld metal than in the base metal due to the different microstructure distribution and fraction of the austenite phase with a small diffusion coefficient. As described in Section 2.1.1, the weld metal fabricated in this study had more austenite microstructure than that of the base metal. Considering the nominal stress–crosshead displacement curve and fracture surface morphology, the influence of diffusible hydrogen was confirmed.
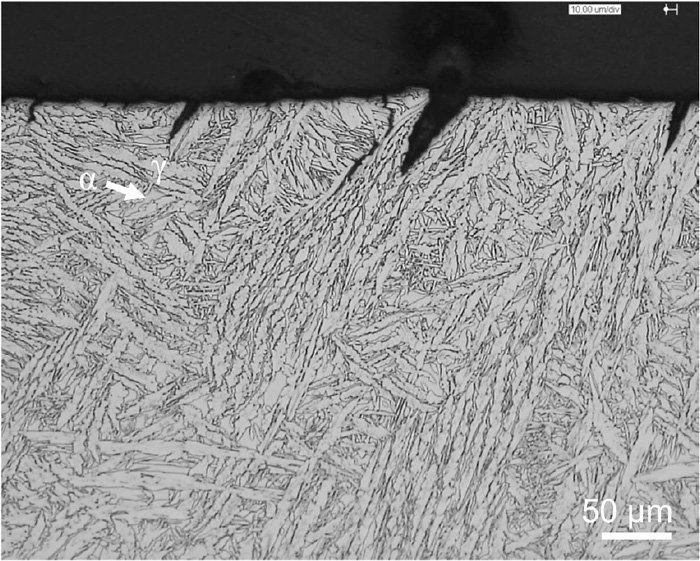
The relationship between hydrogen-induced cracking and microstructure was examined by observing the cross-section of the fractured specimen after SSRT test. Results showed that there are several cracks with large opening. In the previous report,1) relatively small cracks were observed as they exhibit the influence of microstructure appears more clearly, specifically those with a size of several ferrite or austenite phases.
In the base metal, cracking was mainly confirmed in the ferrite phase and the crack-tip was assumed to stop at the boundary between the ferrite and austenite phase.1) On the other hand, in the weld metal, as shown in Fig. 7, several cracks were observed along the randomly distributed microstructure. The location of cracks has yet to be specified in detail due to the fine microstructure. However, cracks are expected to occur within the ferrite phase or at the ferrite/austenite phase boundary. These hydrogen cracking characteristics in the weld metal were investigated based on the stress distribution and diffusible hydrogen concentration distribution at a microstructure level.
3.2. Numerical Simulation
3.2.1. Distribution Characteristics of Microscopic Stress and Diffusible Hydrogen Concentration in Weld Metal of Duplex Stainless Steel
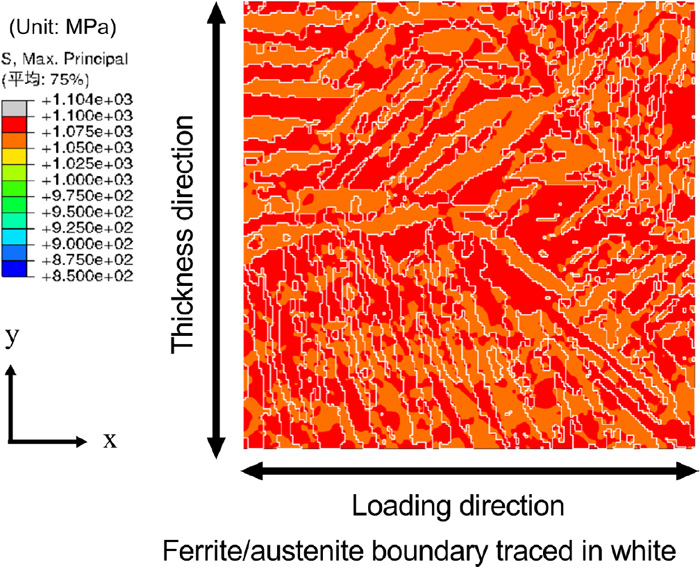
Figure 8(a) shows the maximum principal stress distribution at an applied strain of 11%, corresponding to the maximum loading point in the SSRT test of the weld metal. As described in the previous report,1) the hydrostatic pressure distribution, which is the driving force for hydrogen diffusion and accumulation, and the maximum principal stress, which is considered the driving force for crack initiation, exhibit a similar distribution tendency. Moreover, the region where diffusible hydrogen is accumulated coincides with the region with high maximum principal stress; thus, the maximum principal stress is used to as a component present stress distribution in this paper. The distribution in the base metal1) is shown in Fig. 8(b) for comparison. The range for the contour map has been modified to allow comparison between the distribution of the base metal and weld metal. The strain applied to the base metal model is 9.8%, corresponding to the maximum loading point in the SSRT test. The maximum principal stresses in the weld metal is approximately 1050–1100 MPa, whereas that of the base metal is approximately 875–1050 MPa, which denotes a smaller stress gradient for the weld metal. One of the main reasons for this is the minimal difference in the strength between the ferrite and austenite phases used in the numerical simulation, unlike the significant difference used for that of the base metal. Since hydrostatic pressure gradient is assumed as one of the driving forces of hydrogen diffusion in this study, a difference in the stress distribution affects the diffusible hydrogen concentration distribution. This effect is expected to be smaller in the weld metal than in the base metal.
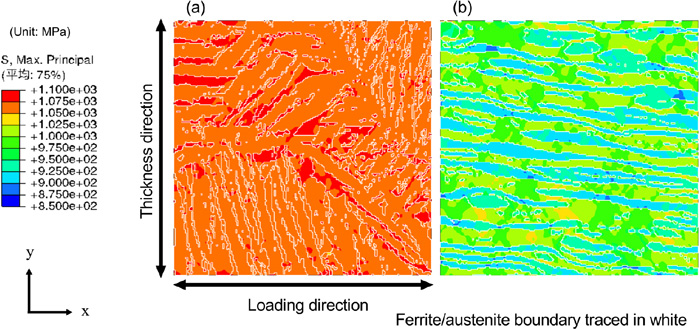
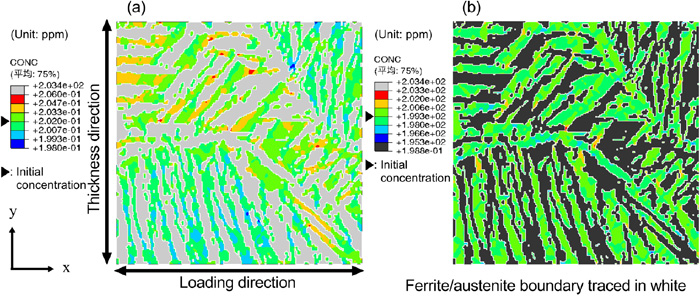
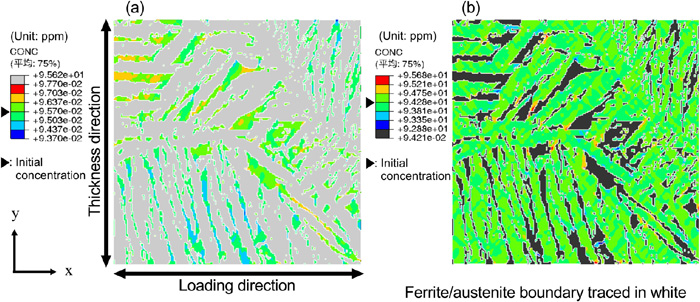
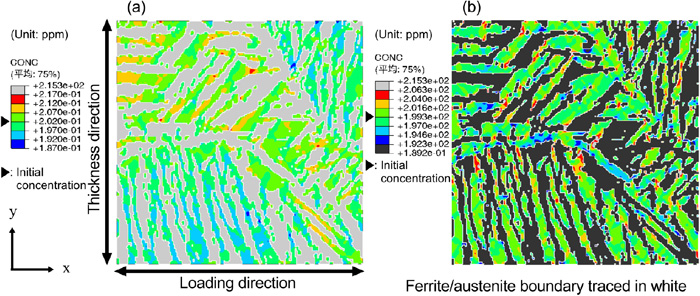
Figure 9 shows the diffusible hydrogen concentration distribution of the ferrite and austenite phases at the strain levels shown in Fig. 8. Since the solubility of hydrogen is significantly differs between the ferrite and austenite phases, the display range is adjusted to emphasize the distribution in each phase. Moreover, it is set so that the initial value of the diffusible hydrogen concentration is in the center of the legend (green) and areas where the diffusible hydrogen concentration has increased and decreased from the initial state is displayed in warm colors and cold colors, respectively. These results indicate that diffusible hydrogen accumulation occurs in the ferrite phase or at the ferrite/austenite phase boundary. This corresponds to the observation of the several cracks that occur along the microstructure.
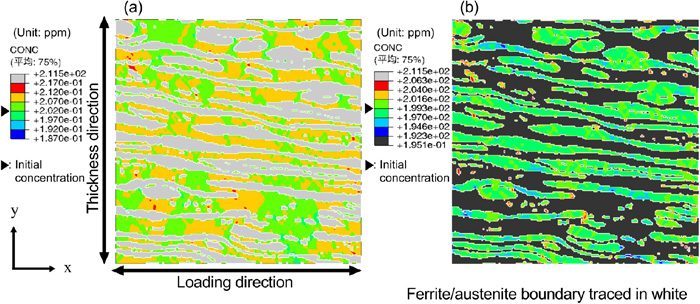
The diffusible hydrogen concentration distribution1) of the base metal is shown in Fig. 10 for comparison with the weld metal. Similar to the weld metal, diffusible hydrogen accumulated in the ferrite phase and ferrite/austenite phase boundary. However, diffusible hydrogen concentration increased nearly on all the regions of the ferrite phase of the base metal, unlike that of the weld metal. In the ferrite phase, diffusible hydrogen concentration accumulated on regions in the longitudinal direction parallel to the loading direction as in the base metal. On the other hand, it decreased in the regions orthogonal to the loading direction. This is attributed to the different microstructure, resulting in different stress distribution at the microstructure level even under the same macroscopic loading conditions, thereby affecting the diffusible hydrogen concentration distribution. In addition, the display range of the diffusible hydrogen concentration in Figs. 9 and 10 is set to highlight the trends for the base metal and weld metal. The concentration of the accumulated diffusible hydrogen is smaller for the weld metal than in the base metal. From the numerical analysis results, it is evident that there are few regions with diffusible hydrogen accumulation for the weld metal fabricated in this study. Thus, the result of the SSRT test with smaller reduction in the ductility of the weld metal than in the base metal can be attributed to its smaller region where hydrogen cracking could occur.
It is possible to consider the crack initiation site by utilizing the numerical site of the stress distribution and diffusible hydrogen concentration distribution at the microstructure level for the weld metal. The factors that cause this diffusion behavior of diffusible hydrogen in the weld metal are considered as follows: its microstructural morphology differs from that of the base metal and there is minimal difference in the stress–strain curves of the two phases, which reduces the stress gradient that drives hydrogen diffusion and accumulation. Furthermore, in the weld metal fabricated in this study, it is possible that hydrogen-induced cracking did not occur due to the large proportion of the austenite phase, which has excellent hydrogen cracking resistance. Therefore, the effect of the fraction of the ferrite and austenite phase and the effect of stress–strain curve of each phase on the accumulation behavior of diffusible hydrogen will be discussed using numerical simulation.
3.2.2. Numerical Simulation of the Effect of Phase Characteristics on Hydrogen Diffusion/accumulation Behavior
The stress concentration at the microstructure level and accumulation of diffusible hydrogen in the weld metal were less remarkable than that of the base metal. The reason for this is (1) the minimal difference between the stress–strain curves of the two constituent phases and (2) the high proportion of the austenite phase. Therefore, to discuss the influence of the stress distribution and diffusible hydrogen concentration distribution at the microstructure level, numerical simulation was utilized using the virtual stress–strain curve and microstructure model.
First, the difference between the stress–strain curves of the ferrite and austenite phases was investigated. As shown in Fig. 7, there is almost no difference between the stress–strain curves of the ferrite and austenite phase of the weld metal. Therefore, numerical simulation was performed under the simulation condition where these were replaced with those of the base metal with a large difference between the two phases. Figure 11 shows the maximum principal stress distribution when the applied strain is 11%. In Fig. 8(a), which shows the maximum principal stress distribution when using the stress–strain curve with minimal difference between the phases, the maximum principal stress is observed at approximately 1050–1100 MPa. On the other hand, in Fig. 11, where the stress–strain curve with a large difference between the two phases is used, the maximum stress was observed as approximately 850–1000 MPa, that is, the stress gradient is enlarged. With this, the accumulation of diffusible hydrogen is expected to be remarkable. However, the range of the maximum principal stress is not as wide as that of the base metal shown in Fig. 8(b). Therefore, the difference in microstructure morphology between the base metal and weld metal also affected the microscopic stress gradient.

Subsequently, the effect of the phase fraction (area ratio) on the stress distribution and diffusible hydrogen concentration distribution was investigated. A new microstructure model with a different area ratio was created by image processing based on the microstructure model of the weld metal shown in Fig. 3. By processing the binarized image of the ferrite and austenite phases that was the basis of the finite element model of the microstructure, the outline of the ferrite phase was expanded in steps of one pixel until the area ratio of the ferrite phase becomes 53%, which was as approximately equal to that of the base metal. Hence, this was used as the virtual weld metal model. Figure 12 shows the generated microstructure model. Using the generated microstructure model, the numerical simulation of the stress distribution and diffusible hydrogen concentration distribution at the microstructure scale was carried under the same material properties and analysis conditions as that of the weld metal, which was presented in Section 3.2.1. Since this numerical analysis was intended for comparison with the base metal, the initial diffusible hydrogen concentrations of the ferrite and austenite phases were set equal to those of the base metal, which was 0.2 ppm and 199.2 ppm, respectively. In this case, the initial value of the average diffusible hydrogen concentration of the entire numerical simulation model was 95 ppm. Figure 13 shows the maximum principal stress distribution when the area ratio of the ferrite phase was altered. The applied strain is 11%, corresponding to the maximum loading point. In comparison to Fig. 8(a) where the area ratio of the ferrite phase is 26%, it can be seen that there are more area exhibiting high stress as the ferrite phase increases. However, the range of the maximum principal stress is nearly unchanged. Figure 14 shows the diffusible hydrogen concentration distribution with a ferrite phase ratio of 53%. In comparison to the diffusible hydrogen concentration distribution of the base metal model shown in Fig. 10, there are less accumulation. This can be attributed to the minimal difference in the stress–strain curves of the two phases and small stress gradient.
A numerical simulation of two virtual simulation conditions was performed: when the stress–strain curves of the phases of the weld metal were replaced with those of the base metal and when the area ratio of the ferrite phase was changed to 53%, similar to that of the base metal. This confirmed that the increased difference between the stress–strain curves of the phases enhances the accumulation of diffusible hydrogen but the degree of accumulation was less than that of the base metal. Even when the area ratio of the ferrite phase increased, the degree of diffusible hydrogen accumulation was less than that of the base metal.
Finally, based on the virtual weld metal model with 53% area ratio of the ferrite phase, a further new virtual weld metal model was generated with the stress–strain curve replaced by that of the base metal. In this model, the area ratio of the ferrite phase and difference between the stress–strain curves of the ferrite and the austenite phase are similar as those of the base metal but the microstructure distribution differs. Figure 15 shows the diffusible hydrogen concentration distribution in this virtual weld metal model. The initial diffusible hydrogen concentrations in the ferrite and austenite phases were 0.2 and 199.2 ppm in the ferrite and austenite phases, respectively. The degree of accumulation of the diffusible hydrogen is similar to that of the base metal shown in Fig. 10. Thus, the area ratios of the ferrite and austenite phase, and the difference of the stress–strain curve of both phases influence the accumulation of diffusible hydrogen and the occurrence of hydrogen cracking.
4. Conclusion
In this paper, the effect of microstructure on the hydrogen cracking characteristics of duplex stainless-steel weld metal was examined from the viewpoint of microstructure-level stress distribution and hydrogen concentration distribution, and compared with the base metal. The main results are summarized as follows:
(1) From the SSRT test of charged and uncharged specimens of the duplex stainless steel weld metal, the diffusible hydrogen reduced ductility less than that of the base metal. By cross-sectional observation of the charged test specimen of the weld metal after the SSRT test, cracking was observed in the ferrite phase or ferrite/austenite phase boundary.
(2) To investigate the crack initiation site at the microstructure level in the duplex stainless steel weld metal based on the stress distribution and hydrogen concentration distribution, a finite element model of the microstructure was generated. Elasto-plastic and hydrogen diffusion analysis were performed. This clarified that diffusible hydrogen was accumulated in the ferrite phase or ferrite/austenite phase boundary in the weld metal. However, this was not as clear in the base metal. This corresponded to the crack initiation position confirmed by the cross-sectional observation. The degree of diffusible hydrogen accumulation in the weld metal was smaller than that in the base metal, corresponding to a small drop in ductility due to hydrogen charging in the SSRT test of the weld metal compared to the base metal.
(3) The weld metal produced in this study has high proportion of austenite phase with a small difference of the strength of the ferrite and austenite phase. The influence of these factors on the diffusible hydrogen accumulation behavior and crack initiation characteristics was investigated by numerical simulation. Examinations were conducted under virtual simulation conditions where the area ratio of the ferrite and austenite phase and stress–strain curve were changed. As a result, the increased difference between the stress–strain curves and change of area ratio of the phases greatly influenced on the accumulation degree of diffusible hydrogen.
Acknowledgement
This work was partly supported by JSPS KAKENHI Grant Numbers 16K05977 and 19K04075.
References
- 1) G. Ogita, K. Matsumoto, M. Mochizuki, Y. Mikami and K. Ito: ISIJ Int., 61 (2021), in press. https://doi.org/10.2355/isijinternational.ISIJINT-2020-399
- 2) A. Yousefi and G. Itoh: ISIJ Int., 58 (2018), 561. https://doi.org/10.2355/isijinternational.ISIJINT-2017-631
- 3) M. Nagumo: ISIJ Int., 52 (2012), 168. https://doi.org/10.2355/isijinternational.52.168
- 4) H. K. D. H. Bhadeshia: ISIJ Int., 56 (2016), 24. https://doi.org/10.2355/isijinternational.ISIJINT-2015-430
- 5) S. Huizinga, B. McLoughlin, I. M. Hannah, S. J. Paterson and B. N. W. Snedden: Proc. Corrosion 2006, NACE, Houston, (2006), Paper No. 06145.
- 6) M. Aursand, L. A. Marken, G. Rørvik and I. M. Kulbotten: Proc. Corrosion 2013, NACE, Houston, (2013), Paper No. 2490.
- 7) R. N. Gunn: Duplex Stainless Steels, Abington Publishing, Cambridge, UK, (1997), 187.
- 8) Special Materials Welding Research Committee, The Japan Welding Engineering Society eds.: Examples of Stainless Steel Welding Problems, Sanpo Publications, Tokyo, (2012), 115 (in Japanese).
- 9) E. Turbeville, F. Busschaert, S. Benum and B. Madsen: Proc. 8th Duplex Stainless Steels Conf., KCI Publishing, Zutphen, (2010), Paper II.B.3, 545.
- 10) T. S. Taylor, T. Pendlington and R. Bird: Proc. 31st Annual Offshore Technology Conferende, Offshore Technology Conference, Houston, (1999), 10965. https://doi.org/10.4043/10965-MS
- 11) I. M. Hannah and S. J. Paterson: Proc. Duplex Int. Conf. and Expo, Associazione Italiana di Metallurgia (AIM), Milano, (2007), 1.
- 12) S. Brauser and T. Kannengiesser: Weld. World, 55 (2011), No. 5–6, 26. https://doi.org/10.1007/BF03321293
- 13) P. J. Fang, D. Kirkwood, L. J. Power and C. F. G. Baxter: Proc. Conf. Duplex Stainless Steels, TWI, Glasgow, (1994), Paper 51.
- 14) K. Ogawa and M. Miura: Q. J. Jpn. Weld. Soc., 8 (1990), No. 4, 481 (in Japanese). https://doi.org/10.2207/qjjws.8.481
- 15) A. J. Leonard, R. N. Gunn and T. G. Gooch: Proc. Stainless Steel World Duplex America 2000 Conf., KCI Publishing, Zutphen, (2000), 345.
- 16) T. Kuroda and C. D. Lundin: J. Soc. Mater. Sci., Jpn., 43 (1994), No. 488, 562 (in Japanese).
- 17) J. Yang, Q. Wang, Z. Wei and K. Guan: Case Stud. Eng. Fail. Anal., 2 (2014), 69.
- 18) K. Shinozaki, L. Ke and T. H. North: Weld. J., 71 (1992), No. 11, 387-s.
- 19) Y. Kikuchi, C. D. Lundin and K. K. Khan: Trans. JWRI, 20 (1991), No. 2, 241.
- 20) R. Kaçar: Mater. Des., 25 (2004), No. 1, 1. https://doi.org/10.1016/S0261-3069(03)00169-9
- 21) E. Dabah, T. Kannengiesser, T. Mente, K. Beyer and S. Brauser: Weld. World, 57 (2013), No. 4, 561. https://doi.org/10.1007/s40194-013-0051-5
- 22) T. Mente and T. Bollinghaus: Weld. World, 56 (2012), No. 11–12, 66. https://doi.org/10.1007/BF03321397
- 23) B. R. S. da Silva, F. Salvio and D. S. dos Santos: Int. J. Hydrog. Energy, 40 (2015), 17091. https://doi.org/10.1016/j.ijhydene.2015.08.028
- 24) National Institute of Standards and Technology (NIST): Finite Element Analysis of Microstructures OOF2 (Version 2.1.12), https://www.ctcms.nist.gov/oof/oof2/, (accessed 2019-09-24).
- 25) V. Olden, A. Saai, L. Jemblie and R. Johnsen: Int. J. Hydrog. Energy, 39 (2014), 1156. https://doi.org/10.1016/j.ijhydene.2013.10.101