Forming Processing and Thermomechanical Treatment
Deformation Behavior of Longitudinal Surface Flaws in Flat Rolling of Steel Wire
2021 年 61 巻 6 号 p. 1935-1945

詳細
2021 年 61 巻 6 号 p. 1935-1945
The deformation behavior of a longitudinal V-shaped surface flaw was investigated during the flat wire rolling process using finite element analysis. The effects of process conditions, material properties, and initial position of the flaw on the deformation behavior of surface flaws were evaluated to understand the deformation behavior of flaws and to find solutions to decrease flaws. The surface flaw, that is, the ratio of the depth and width of the surface flaw (r), decreased with increasing reduction in height per pass, roll diameter, and friction coefficient. Unfortunately, the surface flaw and strain homogeneity of the wire simultaneously decreased under similar process conditions. The surface flaw slightly decreased with the strain hardening exponent (n) by increasing the width of the surface flaw. However, the effect of n value on the deformation of the surface flaw was not crucial. Higher strain at the flat surface induced an overlap-type surface flaw, whereas a small strain in the free surface induced an open-type surface flaw during the flat wire rolling process, which means that the surface flaw on the flat surface was much more detrimental than the surface flaw on the free surface. The deformation behavior of the surface flaw in flat-rolled wire was highly related to the strain inhomogeneity and lateral spreading of the wire. As the strain inhomogeneity of the flat-rolled wire increased, the lateral spreading of the wire increased, resulting in a decrease in the surface flaw, i.e., the r value.
Surface integrity is important for steel wire, rod, and bar products because surface flaws reduce the lifetime of steel products by decreasing the fatigue resistance,1) especially in high-strength steels. However, surface flaws might appear during continuous casting and hot rolling processes because of quality issues associated with the process conditions in steels.2,3) Recently, problems related to surface flaws have become one of the major issues in the steel wire, rod, and bar industries because of the increase in the strength of products.4,5,6) This occurs because, as the strength of the product increases, the effect of surface defects on fractures in the product increases. Therefore, most steel producers measure the depth of surface flaws that occur in the production process and judge the pass or fail of the product based on the depth of the surface flaw. Generally, as the strength of a product increases, the standard for surface flaw depth is stricter.
There are two approaches to reducing surface flaws. The first approach is to avoid creating surface flaws during processing. The second approach is to remove the surface flaws in a subsequent process, even if a surface flaw occurs in the prior process. For example, when surface flaws are generated during the casting process, some surface flaws disappear during downstream plastic forming processes such as hot rolling, wire drawing, flat wire rolling, and forging according to the process conditions, material properties, and the shape and position of the surface flaw. That is, some surface flaws are detrimental to the final product, and some flaws are not.
Accordingly, it is important to predict the behavior of the surface flaw during downstream forming processes to decrease the amount and size of surface flaws.7) Therefore, we need to understand the deformation behavior of surface flaws during downstream forming processes such as hot rolling, wire drawing, flat wire rolling, and forging. Several studies have been conducted regarding the deformation behavior of surface flaws during the hot rolling,2,4,8,9,10,11,12) wire drawing6,13,14,15,16) and forging processes.17,18) However, no literature can be found concerning the deformation behavior of surface flaws during the flat wire rolling process although flat-rolled wires are used in many applications, such as windshield wipers, springs, guide rails, and saw blades.19) In the research field of flat-rolled wire, most researchers have focused on shape control19,20,21,22,23,24,25) and strain inhomogeneity of a wire.26,27,28,29,30,31) Meanwhile, there are several studies on the deformation behavior of surface flaws during plate rolling8,9,12,32) and rod rolling,4,10,11,33) which can be good references for studying surface flaws in flat-rolled wire. Ervasti and Stahlberg9,32) analyzed the deformation behavior of longitudinal and transverse surface cracks during hot rolling of a steel plate using the finite element method (FEM). They reported the closure and growth of surface cracks with varying process conditions, including roll diameter, friction coefficient, and reduction in height per pass. Yu and Liu12) characterized the deformation behavior of surface cracks in a plate during the hot rolling process using thermal-mechanical FEM. They considered the crack height, friction coefficient, and temperature distribution around the crack to determine the deformation behavior of the surface crack. Eriksson10) conducted a numerical simulation to inspect the opening and closing of a surface crack in an oval-round rod rolling sequence. Son et al.4) analyzed the effect of the position of V-type surface defects in a rod during the rod rolling process with an oval-round roll sequence. They showed that the initial position of a surface crack on the rod strongly affected the final crack size after rod rolling. Kwon et al.11) revealed the mechanism of wrinkle formation of rods during hot rod rolling using the hot compression test. They suggested that temperature and specific deformation energy levels were the most important parameters governing the formation of surface defects. In addition, based on the author’s experience, understanding the deformation behavior of a surface flaw can assist with understanding the plastic deformation behavior of materials in more detail during the forming process.
Therefore, this study focused on the influence of process conditions, initial position of surface flaw, and material properties on the deformation behavior of surface flaws during the flat wire rolling process to understand the deformation behavior of surface flaws and to find solutions to minimize their deteriorating influence by the flat wire rolling, which is helpful for determining guidelines for designing the flat wire rolling process. Process parameters such as reduction in height (Rh) per pass, roll diameter, and friction coefficient at the interface between the material and roll were considered. In addition, the effect of material properties such as strain hardening exponent (n) was evaluated using FE analysis because of limited research resources. Finally, the strain distribution in a flat-rolled wire was investigated to understand the deformation behavior of surface flaws.
To validate the accuracy of the numerical model used in this study, a flat wire rolling test was conducted, and the shape of the flat-rolled wire obtained from the experiment and that obtained by numerical simulation was compared. A commercial plain low-carbon steel wire (diameter: 13 mm) was provided by the Pohang Iron & Steel Company (POSCO), South Korea. The analyzed chemical composition was Fe-0.1C-0.4Mn-0.1Si. The steel wire was manufactured by hot rod rolling at a temperature greater than 900°C using about 20 rolling stands and a standard Stelmor cooling process at an average cooling rate of 3°C/s.34) For the TWIP steel, an ingot with a chemical composition of Fe-0.65C-20.1Mn-0.95Al with a thickness of 125 mm was cast by vacuum induction melting. The ingot was homogenized at 1200°C for 9 h to remove Mn segregation. Then, it was directly rolled into the plate with a final thickness of 20 mm at the final rolling temperature of 950°C using 8 rolling stands with test rolling equipment. Subsequently, the hot-rolled plate was cooled in room temperature (RT).
To measure the tensile properties of the hot-rolled specimens, dogbone-shaped (gauge section: Φ5 mm × 25 mm) tensile specimens were machined aligned along the rolling direction. They were strained at RT using an Instron testing machine with an extension meter at a strain rate of 10−3 s−1. The tensile curves of the two steels are shown in Fig. 1.

Comparison of true stress-strain curves of TWIP and ferritic steels during RT tensile tests. (Online version in color.)
For the flat wire rolling test, the hot-rolled plate was machined into round bars with a diameter of 13 mm. Flat rolling tests were performed up to three passes by the two rolls with a diameter of 400 mm without lubricant as listed in Table 1. The Rh per pass was calculated using the following equation:
| (1) |
| Roll pass | Process conditions | Material properties | Surface flaw | |||||
|---|---|---|---|---|---|---|---|---|
| No. of pass | Roll gap (mm) | Total reduction in height (%) | Reduction in height per pass (%) | Roll diameter (mm) | Friction factor | Strain hardening exponent | Position | Angle |
| 1 | 10.5 | 20 | 20 | 400 | 0.3 | 0.45 | Free surface | 50° |
| 2 | 8.5 | 35 | ||||||
| 3 | 6.8 | 48 | ||||||
To observe the deformation behavior of surface flaws with process conditions, material properties, and flaw positions during the flat wire rolling process, DEFORM FE commercial software with a 3D module (version 11.0) was used.
The rolls for the flat wire rolling process were considered to be a rigid body. The effects of temperature and strain rate were not considered in this study. The workpiece was assumed to be an isotropic and rigid plastic material. In this case, the constitutive behavior of a wire can be generally described by Hollomon’s law as follows:
| (2) |
| Parameters | Values | |||
|---|---|---|---|---|
| Process conditions | Average Rh per pass (%) | 10 | 20 | 48 |
| Roll diameter (mm) | 200 | 400 | 800 | |
| Friction factor (m) | 0.15 | 0.3 | 0.8 | |
| Material properties | Strain hardening exponent (n) | 0.01 | 0.13 | 0.45 |
| Flaw conditions | Position | Free surface | Flat surface | |
| Angle (degrees) | 50 | 90 | 120 | |
The initial wire with a diameter of 13 mm was rolled at a constant rolling speed of 5 RPM. To understand the effect of surface preparation or lubrication conditions prior to rolling, the shear friction factor (m) between the roll and wire interface was set to vary from 0.15 to 0.8 using the constant shear friction model as follows:
| (3) |
A V-shaped surface flaw with a depth of 500 μm was assumed to occur throughout the longitudinal direction of a specimen during the hot rod rolling process (Fig. 2(b)). Two surface flaw positions were investigated (Fig. 2(c)), and the surface flaw in the free surface was primarily evaluated because it is more difficult to remove compared to the surface flaw in the flat surface because of the lower strain on the flat surface.25) In addition, the influence of the angle of the surface flaw was evaluated as shown in Fig. 2(b). All parameter variations during the flat wire rolling process in this simulation are summarized in Table 2, and the standard parameters related to the rolling process are given in Table 1 based on the general conditions of the flat wire rolling process in industrial fields.
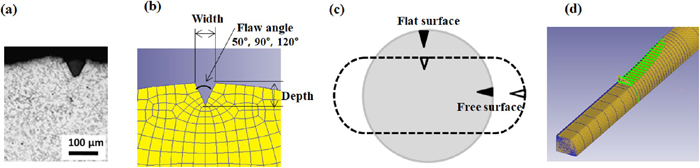
(a) Photograph of typical shape of surface flaw in hot-rolled wire rod, (b–c) initial geometry of surface flaw, and (d) computational domain for the numerical simulation. (Online version in color.)
To reduce the computational cost, one quarter section of the full wire geometry was considered stemming from the symmetrical conditions of the flat wire rolling process (Fig. 2(d)). In addition, a rather short workpiece (150 mm in length) was chosen based on several length tests to keep the calculation time low. Approximately 500 brick-type elements were used in the cross sectional area of the wire, and the total number of elements was approximately 20000.
Before presenting the results of the numerical simulation, the accuracy of the numerical model was validated by comparing the measured and numerically simulated geometry of a flat-rolled TWIP steel wire. Figure 3(a) shows the cross-sectional shape of the flat-rolled wire and the terminologies used in this study, and Fig. 3(b) shows a comparison of the measured and numerically simulated width of contact area (b) and lateral spread (W) of a wire under the standard condition as listed in Table 1. The W and b values obtained by FE analysis were in good agreement with the measured values. Therefore, the author concluded that the proposed FE analysis for a flat wire rolling process can evaluate the characteristics of the shape and strain distribution of the wire. However, close inspection revealed that the b and W values of the experiment were slightly higher than those of the numerical simulation. To the best of the author’s knowledge, this discrepancy is related to the applied hardening model in this simulation; therefore, a carefully designed kinematic hardening model is necessary to increase the accuracy of shape in deformed wires.35)

(a) Cross-sectional shape of flat-rolled wire by numerical simulation and terminologies used in this study, and (b) comparison of W and b values of a specimen at the third pass based on the experiment, simulation, and experimental regression model. (Online version in color.)
Meanwhile, based on plain carbon steels, Kazeminezhad and Karimi Taheri19,20) suggested an experimental regression model for prediction of b and W values as a function of total reduction in height (Δh) and initial height of the wire (h0) as follows:
| (4) |
| (5) |
Figure 4(a) compares the deformed shape of the surface flaw of a flat-rolled wire with Rh per pass calculated by FE analysis. The other factors were kept at the standard value as listed in Table 1. The depth of the surface flaw (d) decreased with increasing total Rh regardless of Rh per pass as shown in Fig. 4(b). In addition, the width of the surface flaw (w) tended to decrease with total Rh. Meanwhile, the shape of the surface flaw was somewhat different with Rh per pass. For example, a larger Rh per pass led to a smaller d and larger w. It is well known that the surface flaw becomes sharp with increasing d and decreasing w, leading to a higher risk of fracture caused by the surface flaw,6,9,14) especially in cold forming processes. Therefore, the r value is defined as the ratio of the depth and width of the surface flaw in this study. That is, the r value is defined as follows:
| (6) |

(a) Deformed shape and, comparison of (b) depth and width and (c) r value of surface flaw with Rh per pass and total Rh. (Online version in color.)
Based on the author’s experience, the r value indicates the possibility of removing the surface flaw. For example, a surface flaw with a small r value can be easily removed. In contrast, a high r value means that the surface flaw is easily overlapped, making it difficult to remove or reduce. Also, the overlap-type surface flaw can increase the possibility of breakage during the next forging process as well as under service. In addition, surface flaws with a larger r value are difficult to detect in the process of inspecting for surface flaws after the deformation processes. Accordingly, to remove or reduce the surface flaw during subsequent processes, special emphasis should be laid on the r value of the surface flaw, not the d value. Overall, a larger r value indicates a greater risk of fracture. Figure 4(c) shows the r value with Rh per pass and total Rh. The surface flaw of the wire was difficult to remove using the flat wire rolling process with the Rh per pass of 10% because it had a higher r value as shown Fig. 4(c) due to the smaller w. In contrast, the surface flaw can be easily removed by a flat rolling process with the Rh per pass of 48%, and it was easily detected by the inspection system for flaws due to its shape. In summary, the r value decreased with increasing Rh per pass during the flat wire rolling process, indicating that a higher Rh per pass is a much better process condition to remove or reduce the surface flaw in flat wire rolling.
3.2.2. Roll DiameterThe roll diameter is an important parameter in rolling processes because it strongly affects the contact area of the roll and specimen, the homogeneity of mechanical properties of the specimen, and the roll force.36) Figure 5 shows the deformation behavior of the surface flaw of a flat-rolled wire with roll diameter and total Rh. The d value decreased with total Rh regardless of the roll diameter. The influence of w reduction was stronger with decreasing roll diameter, which means that the smaller roll diameter made the surface flaw sharp, that is, an overlap-type surface flaw. Therefore, a larger roll diameter is recommended to reduce the surface flaw during the flat wire rolling process. Meanwhile, it should be noted that the influence of roll diameter on the r value seems to be marginal as shown in Fig. 5(c)

(a) Deformed shape and, comparison of (b) depth and width and (c) r value of surface flaw with roll diameter and total Rh. (Online version in color.)
Figure 6(a) shows the shape of the surface flaw as a function of the shear friction factor at the wire and roll interface. The d was similar and linearly decreased with total Rh undeer the three process conditions as shown in Fig. 6(b). Meanwhile, the deformation behavior of w differed with the process conditions. The w of the surface flaw increased with increasing friction factor, resulting in a lower r value (Fig. 6(c)), leading to a positive effect on the fracture resulting from surface flaws. A higher friction coefficient is better for decreasing the surface flaw during the flat wire rolling process.

(a) Deformed shape and, comparison of (b) depth and width and (c) r value of surface flaw with friction coefficient and total Rh. (Online version in color.)
Figure 7(a) shows the shape of the surface flaw with an n value. The deformed shape of the surface flaw was almost the same regardless of the n value; however, a close observation shows that a higher n value decreases the r value as shown in Fig. 7(c) because the metals with higher n values had a strong resistance to a change in w as shown in Fig. 7(b). This means that low-strength steels, that is, ferritic steel, tended to have a higher possibility of a surface flaw after the flat wire rolling process compared to the high-strength steels, that is, TWIP steel, under similar process conditions. It is worth noting that this result is important from a practical point of view although the effect was weak in this study.
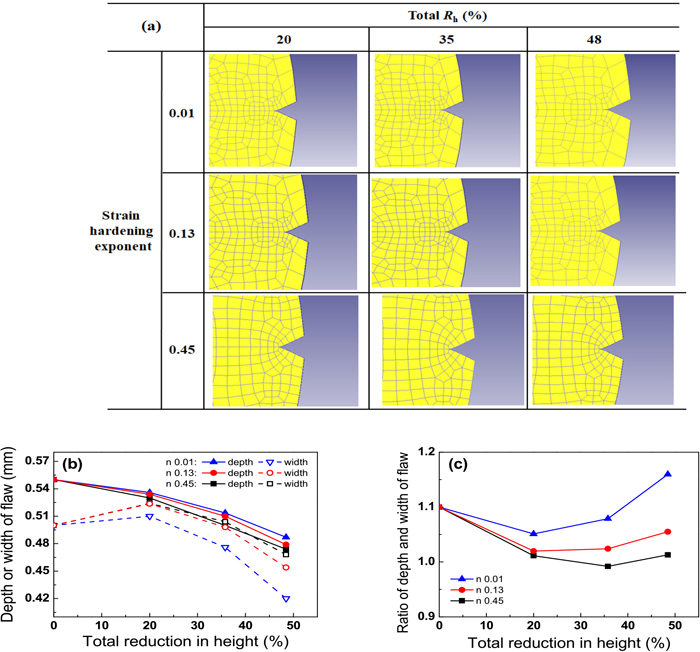
(a) Deformed shape and, comparison of (b) depth and width and (c) r value of surface flaw with n value and total Rh. (Online version in color.)
Surface flaws are observed at various positions in the hot-rolled wire. In this section, the effect of the initial position of the surface flaw on the deformation behavior during flat wire rolling is investigated. The surface flaws were made on the flat surface and free surface as shown in Fig. 2(c). The deformation behavior of the two flaws was very different. An overlap-type surface flaw, that is, large r, was generated on the flat surface of the wire as shown in Fig. 8(a). In the case of surface flaw on the flat surface, both d and w values decreased sharply with total Rh (Fig. 8(b)) due to the higher strain. Son et al.4) also reported that a surface flaw generated on the contact surface of a wire developed into an overlap-type surface flaw during the rod rolling process.
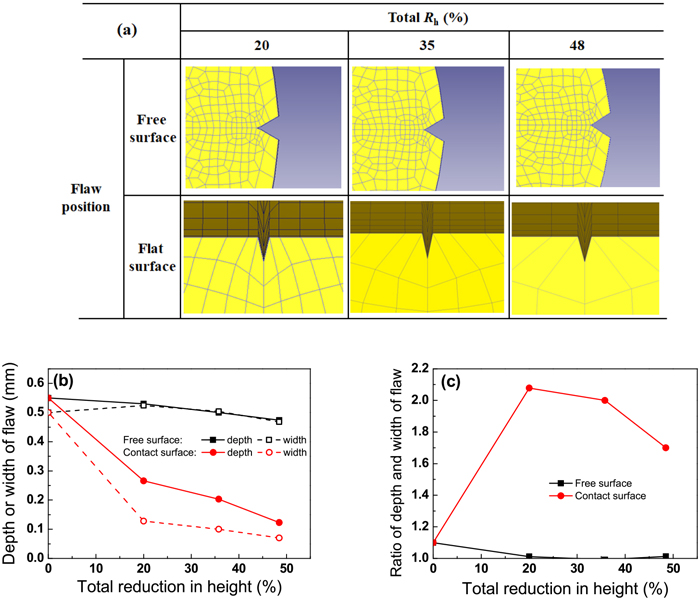
(a) Deformed shape and, comparison of (b) depth and width and (c) r value of surface flaw with flaw position and total Rh. (Online version in color.)
Several types of surface flaws occur in wires, rods, and bars processes.13) In this section, the influence of the initial angle of the surface flaw on the deformation behavior was compared. The flaw angle was changed from 50° to 120° as shown in Figs. 2(b) and 9(a). At first, the r value decreased with increasing flaw angle as shown in Fig. 9(c) throughout the entire process, which means that a higher flaw angle has a positive effect on removing or reducing the surface flaws during the flat wire rolling process. For instance, scratches generated during the manufacturing, handling, and transportation processes of wires were easily removed or reduced during the forming process because the scratches typically have a relatively higher flaw angle.
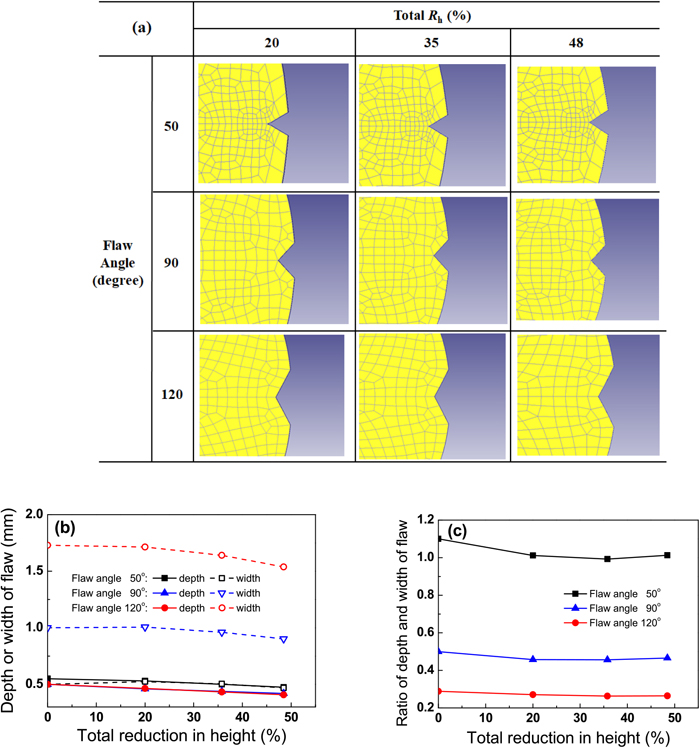
(a) Deformed shape and, comparison of (b) depth and width and (c) r value of surface flaw with flaw angle and total Rh. (Online version in color.)
Based on the author’s experience,6) the deformation behavior of a surface flaw depends on the strain distribution along the transverse direction of a specimen. In addition, the shape change of the surface flaw at the free surface can be related to the amount of lateral spreading in a wire during the flat rolling process. That is, the deformation behavior of the surface flaw in a flat-rolled wire can be dependent on the strain inhomogeneity and lateral spreading of a wire.
Figures 10 and 11 show the contour maps of the effective strain on the cross-section of the wire and the W value with parameters. The highest strain occurred at the center area of the wire regardless of the process conditions, n value, and flaw angle. Whereas, the free surface area had the lowest effective strain under all conditions. The strain inhomogeneity of the flat-rolled wire increased with increasing Rh per pass, roll diameter, and friction coefficient, and with decreasing n value. It is well known that strain inhomogeneity increases with increasing friction coefficient during compression-type forming processes such as simple compression and rolling. The increased strain inhomogeneity of the wire with increasing Rh per pass and roll diameter is highly related to the length of the contact area (L), which is defined as follows in the flat rolling process of a plate:36)
| (7) |
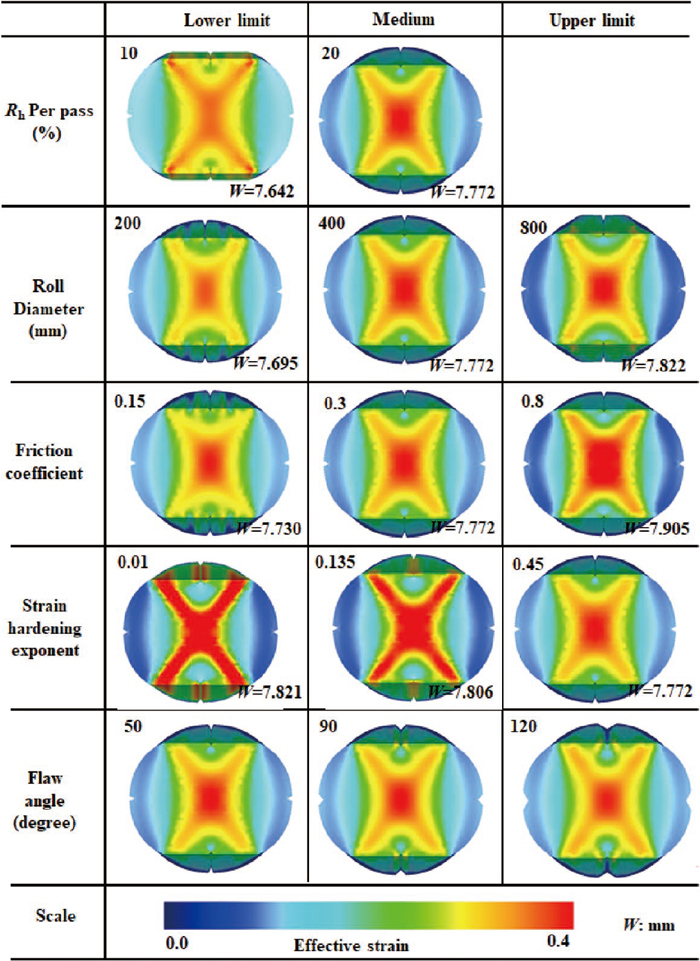
Comparison of effective strain and lateral spreading at first pass with process conditions, material properties, and flaw characteristics.
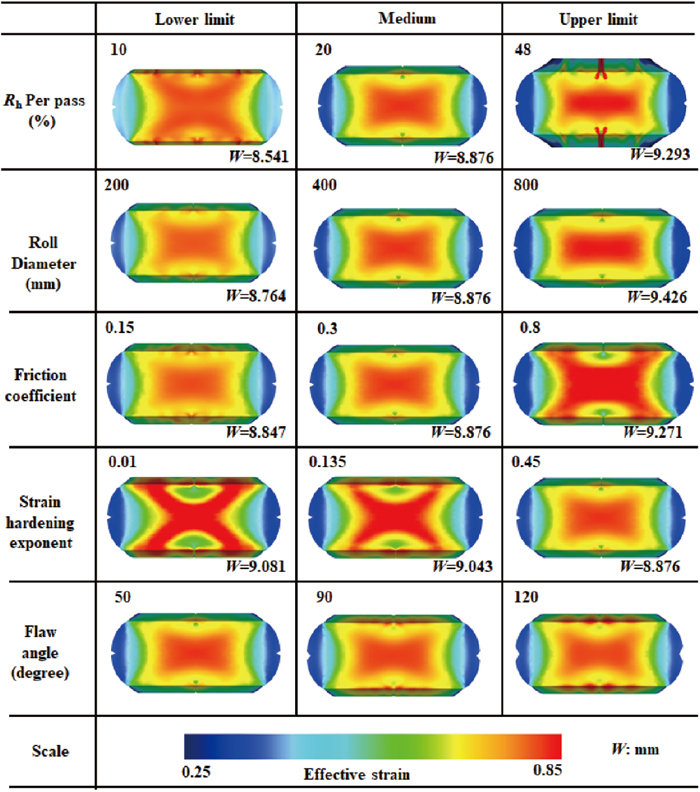
Comparison of effective strain and lateral spreading at third pass with process conditions, material properties, and flaw characteristics.
According to the above equation, L increased with increasing roll radius (R) and Δh during the flat wire rolling process, leading to an increase in the frictional effect, resulting in increased inhomogeneity.
To the best of the author’s knowledge, the higher strain homogeneity of the wire with higher n values can be simply explained based on the classical theory of plastic deformation. The center area of the wire was quickly strengthened under the compression-type plastic forming process, and subsequently the areas around the center can deform after the deformation of the center area because they are relatively soft in comparison with the center area.
Meanwhile, the effective strain was higher at the flat surface than at the free surface. This higher compressive strain at the flat surface area can induce an overlap-type surface flaw, whereas a small effective strain in the free surface can induce an open-type surface flaw as shown in Fig. 8.
Figure 12 summarizes the influence of the process conditions on the strain homogeneity, lateral spread, and r value of the wire during the flat rolling process. The trend of the change in W value was similar to that of the strain inhomogeneity. That is, the W value increased with Rh per pass, roll diameter, and friction coefficient. The behavior of the W value can be related to the strain inhomogeneity. As the strain inhomogeneity increased, it was clearly observed that the macroscopic shear bands were stronger and the near the wire-roll interface had a lower strain as shown in Figs. 10 and 11, which can cause a higher W value in the free surface of the flat-rolled wire. That is, in place of the wire-roll interface area, the free surface area of a wire can be deformed because of the mass balance during the flat wire rolling process as schematically shown in Fig. 13.

Schematic description showing the influence of process conditions on strain homogeneity, lateral spread, and r value of the wire during flat rolling process. (Online version in color.)
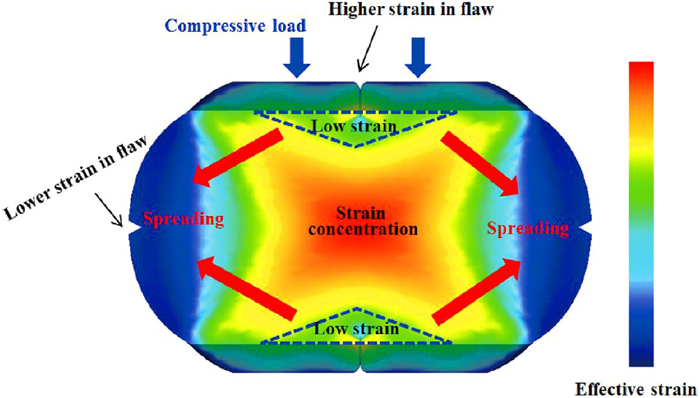
Schematic relationship of strain inhomogeneity and spreading of a wire during flat rolling process. (Online version in color.)
The r value decreased with increasing Rh per pass, roll diameter, and friction coefficient as shown in Fig. 12. Unfortunately, the surface flaw and strain homogeneity of the wire simultaneously decreased at the same process conditions. This means that the uniform distribution of strain and/or stress in the flat-rolled wire had a detrimental effect on reducing the surface flaw. In addition, the r value decreased with increasing W value of the wire. As the W value increased, the d of the surface flaw decreased and the w of the surface flaw increased because of the spreading effect on the free surface, resulting in a decrease in the r value. In summary, as the strain inhomogeneity increased, the W value increased, resulting in a decreasing surface flaw, that is, r value.
To confirm the above mechanism on the deformation behavior of the surface flaw, the deformation of the surface flaw was simulated with the best combination of parameters: Rh per pass of 48%, roll diameter of 800 mm, friction factor of 0.8, and n value of 0.54. The angle of the surface flaw was maintained at 50° for comparison purposes. The d of the surface flaw was reduced (Fig. 14(b)) and the r value dramatically decreased under the best combination condition (Fig. 14(c)) compared to the standard process condition.
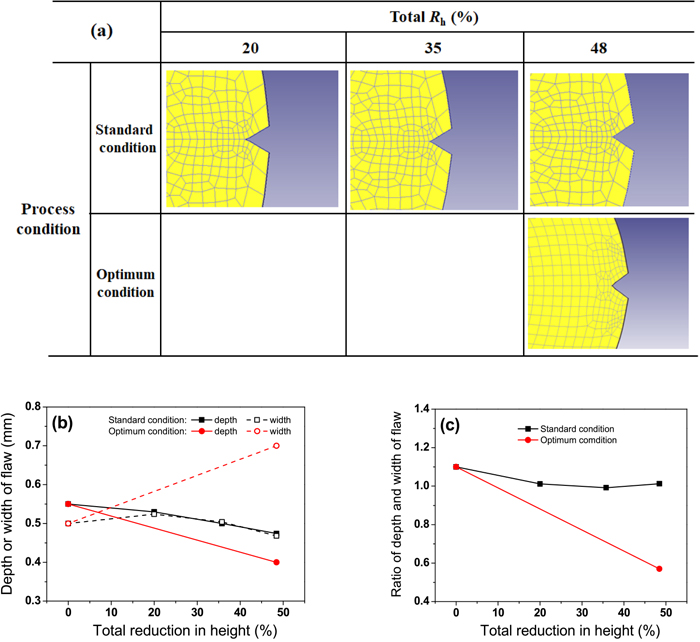
(a) Deformed shape and, comparison of (b) depth and width and (c) ratio of depth and width of surface flaw with process conditions and total Rh. (Online version in color.)
Overall, based on the systematic parametric study on the deformation behavior of a surface flaw in a wire during the flat rolling process using the numerical simulation, the longitudinal surface flaw in the free surface can be reduced by the following strategies: increasing the Rh per pass, roll diameter, friction coefficient, and n value. This suggestion can help to reduce the surface flaw of a wire during the flat rolling process. However, it should be noted that the above recommendations also increase the inhomogeneity of mechanical properties of the wire except for the effect of the n value. The effect of n value on the strain inhomogeneity, W value, and r value of a surface flaw is rather complicated; therefore, further research is necessary to determine the relationship among the above three factors with the n value.
Based on a systematic numerical study regarding the deformation behavior of a longitudinal V-shaped surface flaw in a wire during the flat rolling process, the following conclusions were derived.
(1) The surface flaw, that is, the r value, decreased with increasing Rh per pass, roll diameter, and friction coefficient. Unfortunately, the surface flaw and strain homogeneity of the wire simultaneously decreased under similar process conditions.
(2) The surface flaw slightly decreased with n value by increasing the width of the surface flaw. However, the effect of n value on the deformation of the surface flaw was not critical.
(3) This higher strain at the flat surface area induced an overlap-type surface flaw, whereas a small strain in the free surface induced an open-type surface flaw during the flat wire rolling process. This means that the surface flaw in the flat surface was much more detrimental than the surface flaw in the free surface.
(4) The deformation behavior of the surface flaw in the flat-rolled wire was highly related to the strain inhomogeneity and W value. As the strain inhomogeneity of the flat-rolled wire increased, the W value increased, resulting in a decreasing surface flaw, i.e., r value.
This work was supported by the National Research Foundation of Korea (NRF) grant funded by the Korea government (MSIT, South Korea) (Grant No. 2018R1D1A1B07050103).
b: width of contact area (mm)
d: depth of the surface flaw (mm)
h: height of the wire (mm)
k: shear yield stress (MPa)
K: strain hardening coefficient (MPa)
L: length of the contact area between wire and roll (mm)
m: shear friction factor
n: strain hardening exponent
r: ratio of the depth and width of the surface flaw
R: roll radius (mm)
Rh: reduction in height (%)
w: width of the surface flaw (mm)
W: lateral spread of wire (mm)
Subscripto: initial state
f: final state