Special Issue on "Recent Progress in Inclusion/ Precipitate Engineering"
Thermodynamics of Solid and Liquid MnS–CrS–FeS Phase in Equilibrium with Molten Fe–Cr–Mn–S Alloy
2021 年 61 巻 9 号 p. 2360-2369
詳細
2021 年 61 巻 9 号 p. 2360-2369
Thermodynamic property of solid MnS–CrS–FeS system was determined based on the combination between thermodynamic properties of liquid MnS–FeS, CrS–FeS, and MnS–CrS–FeS phase determined by the authors and reported phase diagram of MnS–FeS, CrS–FeS and MnS–CrS system. The determined parameters were verified by comparison with experimental results of equilibrium relationship between metal/sulfide in Fe–Cr–Mn–S system at 1793 K. By utilizing the determined parameters, phase equilibria involving sulfide phase in liquid Fe–Cr–Mn–S system was established. According to the phase equilibria information, controllability of MnS–CrS–FeS sulfide phase in typical stainless steel during solidification was evaluated.
Alloying elements such as Mn and Cr are widely used in steel. These two chemical elements have stronger affinity with sulfur than iron.1) During cooling and solidification of steel, because of the decrease of sulfide solubility in steel and sulfur segregation, sulfide inclusions which consist of MnS–CrS–FeS may form in Fe–Cr–Mn–S based materials such as stainless steel.2,3) It is very important to control the composition of MnS–CrS–FeS sulfide phase in terms of balancing properties of machinability and corrosion resistance4,5,6,7,8) of the steel product.
The mechanism of sulfide formation diagram was provided by Oikawa et al.3) He suggested that there are three types of sulfide formation mechanism: 1). Stable eutectic reaction proceeds by nucleation of sulfide crystals by high-melting particles; 2). Metastable monotectic reaction; 3). Stable monotectic reaction which proceeds through the formation of low-melting sulfides. On knowing the different sulfide formation mechanisms, to control sulfide formation, it is fundamentally important to know the equilibria involving sulfide phase in the Fe–Cr–Mn–S system during solidification of steel. To create the equilibrium relationships, thermodynamic properties of both metal phase and sulfide phase are necessary to know.
The thermodynamic information of liquid metal phase in Fe–Cr–Mn–S system, such as
About the thermodynamic information of sulfide phase, a ternary MnS–CrS–FeS sulfide phase should be taken as an investigated target in study of Fe–Cr–Mn–S system. Figure 1 is a schematic diagram of the combination of three binaries of FeS–MnS,13) CrS–MnS2,3) and FeS–CrS14) diagrams from different literatures. Melting point of MnS in FeS–MnS and CrS–MnS diagrams are 1610°C and 1655°C which were not unified in Fig. 1. In the following, a brief review regarding the three binaries will be given.

Schematic diagram of MnS–CrS–FeS system.
Among the three binaries, FeS–MnS system (or Fe–Mn–S system) is the system with the most complete information. FeS–MnS binary has been experimentally measured by Shibata.13) Liquidus line of Fe–Mn–S system has been experimentally measured by Vogel and Hotop.15) Quantitative modeling to calculate the phase diagram of Fe–Mn–S system was developed by Hillert and Staffanson,16) and Ohtani et al.17) In their modeling, liquid phase was considered as (Fe, Mn) (S, Va) where Va is a hypothetical vacant component. Thus, by utilizing a two-sublattice solution model ternary Fe–Mn–S system was turned into a reciprocal quaternary Fe–FeS–MnS–Mn system. They were able to reveal important features such as miscibility gaps in liquid phase. However, using their derived thermodynamic parameters, the estimated composition curves have a discrepancy against experimental results especially for sulfide phase at high temperatures. Hillert and Staffanson16) suggested that it is because the solution model for liquid phase is based upon the assumption that there is no positional disorder for sulfur at 50 at. pct on the section FeS–MnS.
Liquidus line of Fe–Cr–S phase diagram is experimentally measured by Vogel and Reinbach.14) Oikawa et al.18) set up the modeling to express the system and phase diagram of binary CrS–FeS was plotted using his derived thermodynamic parameters. However, only a few experimental results at high temperatures of this system were compared.
The binary phase diagram of CrS–MnS was provided by Kovach et al.2) In the diagram, solid solution boundary was based on the experimental result by Kiessling and Westman.19) However, at high temperatures, it is just an analogy to MnS–FeS system. No experimental information at high temperatures of this system was accessed.
Overall, in MnS–CrS–FeS system, the thermodynamic information at low temperatures is available from literatures, however, the thermodynamic information at high temperature is missing or do not agree well with experimental results.
In our recent study,11,12) thermodynamic properties of molten MnS–FeS, CrS–FeS, and MnS–CrS–FeS sulfide phase were determined by utilizing a simple regular solution model. With the certain composition range, good agreement between thermodynamic calculation and experimental results were achieved.
In this paper, based on the thermodynamic information of liquid MnS–FeS, CrS–FeS, and MnS–CrS–FeS phase from our previous work,11,12) by combination with phase diagram of MnS–FeS, CrS–FeS and MnS–CrS system from literatures, thermodynamic expression of solid MnS–CrS–FeS system was determined. The determined parameters were verified through metal/sulfide equilibrium experiments in Fe–Cr–Mn–S system at 1793 K. By utilizing the determined parameters, phase equilibria involving sulfide phase, both liquid and solid state, in liquid Fe–Cr–Mn–S system was established. According to the phase equilibria information, controllability of MnS–CrS–FeS sulfide phase in typical stainless steel during solidification was evaluated.
Metal/sulfide phase equilibria in Fe–Cr–Mn–S system at 1793 K were experimentally measured. A vertical tube resistance furnace was used for heating samples. The details of the apparatus were illustrated in our previous work.11) The starting materials used in this study were electrolytic iron powders (95%+ purity, Wako Pure Chemical Industries, Ltd.), iron sulfide lumps (50%+ purity, Wako Pure Chemical Industries, Ltd.), chromium lumps (99% purity, HIRANOSEIZAEMONSYOUTEN Co, Ltd.) and manganese flake (99% purity, HIRANOSEIZAEMONSYOUTEN Co, Ltd.). In each run, approximately 23 grams of the starting materials with designed proportions were mixed in an alumina crucible placed in an outer magnesia protecting crucible. Then the samples were placed in the hot zone of the vertical tube resistance furnace. The samples were heated in an argon atmosphere to 1793 K and held at the temperature for 4 hours. The temperature was controlled by a Pt-Rh (R-type) thermocouple positioned just below the sample. The holding time of 4 hours was considered enough for reaching metal/sulfide phase equilibrium as explained in our previous work.11) When the heating procedure was finished, the sample was quickly withdrawn from the furnace and quenched by impinging Ar gas on the surface of the sample.
After quenching, longitudinal section from each reaction product was cut off, embedded, ground and polished. SEM-EDS (Scanning Electron Microscopy with Energy Dispersive X-ray Spectroscopy) was used for microscopic analysis and to confirm the equilibrium composition of sulfide phase.
The equilibrium composition of metal alloy phase was determined from bottom cutting blocks of each reaction product. Specifically, the contents of Mn and Cr in metal alloy phase were determined by ICP-AES (Inductively Coupled Plasma- Atomic Emission Spectroscopy), and the content of S in metal alloy phase was determined by an inert gas fusion technique using LECO-CS844 Carbon/Sulfur Element Analyzer.
The experiment was carried out at a holding temperature of 1793 K. The starting materials were mixture of powder, lumps and flakes while the final product was dense regular-shaped alloy (Fe–Cr–Mn–S) as shown in Fig. 2. This indicated that the specimen of metal alloy phase was in liquid state at 1793 K. Although there isn’t an accurate reported phase diagram of Fe–Cr–Mn–S system, the liquidus temperature can be roughly estimated from the binary Fe–Cr20) and Fe–Mn20) phase diagrams. In Fe–Cr system, with an addition of up to 21 mass% of Cr, the liquidus temperature decreases from 1810 to 1786 K. In Fe–Mn system, with an addition of up to 2.5 mass% of Mn, the liquidus temperature decreases from 1810 to 1783 K. In addition, sulfur is also a low-melting point agent. As a result, with the proper addition of Cr, Mn, and FeS, the specimen of Fe–Cr–Mn–S alloy can melt completely at 1793 K.

Photo of sample after experiment. (Online version in color.)
Apart from metal alloy phase, sulfide phase was also noticed from Fig. 2. In the same manner as our previous work,11,12) sulfide composition was determined according to the sulfide inclusions entrapped in the top part of metal alloy instead of the sulfide top layer. The morphology of the sulfide inclusions was carefully checked under SEM-EDS. Typical microstructure of the cross section of equilibrated samples at 1793 K were shown in Figs. 3(a) and 3(b). In the figure, sulfur-rich phases indicated by dark regions are distributed in the matrix of iron-rich phase (light region). Two kinds of morphology of sulfur-rich phase were observed. One was spherical-like which are mostly distributed at top part of the sample while the other was particle-like which were dispersed along the whole cross section of the sample. As been illustrated in the previous work,11,12) the particle-like phases were precipitated products during quenching. Therefore, at 1793 K, the coexisting phases were liquid Fe-rich Fe–Cr–Mn–S metal alloy phase and spherical S-rich sulfide phase (the following mentioned sulfide phase in the article are all refers to the equilibrated spherical-like ones).

Typical micrograph of top of the cross section of sample 101–105 (example of sample 101) equilibrated at 1793 K. (Online version in color.)

Typical micrograph of top of the cross section of sample 201–204 (example of sample 202) equilibrated at 1793 K. (Online version in color.)
It was found that the morphology of sample 101–105 is large spherical like, and the diameters are about 40–50 μm shown as in Fig. 3(a). For sample 201–204, although the morphology of sulfide inclusions appears as round-like indicated as Fig. 3(b), the size is small about 15–20 μm.
For the sulfide phase it was difficult to distinguish the solid/liquid state from the morphology in the present work. The sulfide found had always spherical shape. This can be explained by the following.
Sulfur is added as FeS in this experiment and this FeS has a low melting point. When the sample was heated FeS melted first and then by reaction between metal and sulfide, MnS and CrS increased in the sulfide phase. By increase of the melting point of sulfide, liquid phase transformed to solid phase without significant morphology change.
Therefore, it was decided to distinguish the solid/liquid state from the thermodynamic calculation which will be further discussed in section 4.1.3. Also, this could explain the reason of size difference of sulfide particles.
3.2. Equilibria Composition of Fe–Cr–Mn–S System at 1793 KWith the clear identification of the equilibrium phases in section 3.1, the composition of sulfide phase was determined by SEM-EDS according to spherical sulfide and the composition of metal phase was determined by ICP and inert gas fusion technique using metal blocks from bottom part of the sample.
The chemical analyzed results of metal alloy phase and sulfide phase are shown in Table 1. The present system is a Fe–Cr–Mn–S quaternary system which suggests that a 3-dimentional space is necessary to express the 4 components. However, without considering the coordinate of S, the relationship between metal compositions and sulfide compositions can be presented in a two-dimensional plane as Fig. 4. Details regarding the method of plotting can be accessed from our previous paper.12) In the figure, open and solid symbols denote composition of metal phases and sulfide phases, respectively. Solid tie-lines between symbols indicate observation of two-phase equilibrium at that composition. From the figure, it can be observed that MnS/CrS ratio in sulfide phase increases with the increasing of Mn/Cr in metal alloy phase. A composition gap of sulfide phase between sample 101–105 and sample 201–204 was observed. As being mentioned in section 3.1, the size of the sulfide is different between sample 101–105 and sample 201–204. A transformation of liquid to solid state of sulfide phase is suggested to exist. The estimated liquidus-solidus boundary of sulfide phase was also plotted in the figure shown as the black dash-dotted lines, the specific calculation method of the boundary lines will be explained in detail in section 4.1.3.
| No. | Metal alloy-Experimental | Sulfide phase-Experimental | |||||
|---|---|---|---|---|---|---|---|
| [%S] | [%Cr] | [%Mn] | (%S) | (%Cr) | (%Mn) | (%Fe) | |
| 101 | 1.35 | 16.48 | 1.14 | 34.91 | 28.03 | 35.06 | 2.00 |
| 102 | 1.43 | 12.48 | 0.98 | 34.79 | 26.47 | 36.34 | 2.39 |
| 103 | 1.14 | 9.04 | 1.18 | 35.17 | 19.27 | 43.19 | 2.37 |
| 104 | 1.49 | 4.98 | 0.95 | 35.04 | 16.16 | 42.74 | 6.07 |
| 105 | 3.03 | 1.58 | 0.40 | 33.93 | 10.11 | 37.13 | 18.83 |
| 201 | 0.71 | 14.45 | 2.49 | 34.19 | 7.98 | 55.60 | 2.23 |
| 202 | 0.48 | 10.53 | 3.41 | 34.74 | 3.41 | 59.58 | 2.28 |
| 203 | 0.51 | 6.19 | 2.98 | 34.63 | 2.87 | 59.93 | 2.57 |
| 204 | 0.65 | 2.67 | 1.78 | 33.75 | 3.53 | 59.73 | 2.99 |

Equilibrium relations between metal and sulfide phase at 1793 K.
The solubility of Mn in the hexagonal FeS or CrS is very little2,17) while Fe and Cr dissolves in the cubic MnS phase to a considerable extent.19) As a result, there are two compounds in the solid MnS–CrS–FeS system: CrS–FeS and MnS–CrS–FeS phases. The compound with hexagonal structure is hereafter called the P-phase and the compound with cubic structure is called the Q-phase. In Fe–Cr–Mn–S system, little amount of Mn addition would change the sulfide composition from CrS–FeS to MnS–CrS–FeS phase, as a result, Q phase is the most interested phase of solid sulfide in present work.
In section 4.1.1 and 4.1.2, thermodynamic expressions of Q phase will be determined based on the combination of our previous study and information of phase diagram from literature. In section 4.1.3, by utilizing the chosen parameters comparison between calculation and experimental results will be illustrated.
4.1.1. Thermodynamic Expressions of Solid MnS–FeS SystemThe binary MnS–FeS system was controlled by three free energy functions:
| (1) |
| (2) |
| (3) |
The excess Gibbs free energy was described by using a simple regular solution model:
| (4) |
| (5) |
The following Gibbs free energy change of FeS in different phases can be taken directly from the study by Hillert and Stanffanson:16)
| (6) |
| (7) |
For the Gibbs free energy change of MnS from Liquid to Q phase, there are different expressions:
| (8) 16) |
| (9) 17) |
| (10) |
Overall, in Eqs. (1), (2), (3), the only unknown parameter is
By utilizing the above parameters, the phase boundaries between liquid and solid sulfide phase were calculated shown in Fig. 5. The calculated liquidus line agree well with experimental results by Shibata13) which suggests that the chosen parameter was appropriate to describe the MnS–FeS system.

The FeS–MnS phase diagram estimated from present chosen parameters.
The binary MnS–CrS system was controlled by three free energy functions:
| (11) |
| (12) |
| (13) |
In present work, the excess Gibbs free energy will be described by using a simple regular solution model:
| (14) |
| (15) |
The Gibbs free energy change of MnS from Liquid to Q phase is obtained shown in Eq. (10). One experimental information is known according to Kiessling and Westman19) is that there is 65 at% of Cr in the MnS lattice at the solubility limit at 1423 K (1150°C).
As a result, thermodynamic parameters to be determined in CrS–MnS system is i) hypothetical Gibbs energy of formation of CrS in the Q phase
According to a hypothetical phase diagram of CrS–MnS from Kovach et al.2) of Fig. 6, melting point of 1838 K (1565°C) was chosen for CrS in P phase. By comparing with Gibbs free energy provide by Oikawa et al.,18) the enthalpy term was modified to fit a melting point at 1838 K (1565°C).

The CrS–MnS phase diagram plotted analogy to FeS–MnS system (from Kovach2)).
For the melting point of CrS in Q phase, it was decided to choose a value of 1608 K (1335°C) by extrapolation of the liquidus of Q phase from Fig. 6. Consequently, to best fit the eutectic shape of the CrS–MnS diagram of Fig. 6 and also one set of experiment at 1423 K (1150°C), the following parameters were determined:
| (16) |
| (17) |
| (18) |
By utilizing the above parameters, phase diagram of CrS–MnS was calculated and plotted in Fig. 7. The calculated diagram agrees with the experiment at 1423 K (1150°C). However, at high temperature, there is no experimental information to compare. Sulfide phase formed at 1793 K in the present work can be used to confirm the correctness of the CrS–MnS boundaries at high temperature. This will be explained in the following.

The CrS–MnS phase diagram estimated from present chosen parameters.
The ternary MnS–CrS–FeS system was controlled by two free energy functions:
| (19) |
| (20) |
| (21) |
| (22) |
Using these results, Fig. 8 shows the calculated phase boundaries between liquid sulfide phase and Q phase of MnS–CrS–FeS system at 1793 K.

The calculated phase boundaries of MnS–CrS–FeS at 1793 K.
The estimated phase boundaries of sulfide phase was mentioned in Fig. 4 in section 3.2. Sulfide compositions of sample 101–105 locate at the estimated liquid sulfide region, under SEM, the morphology of these samples was large spherical like (40–50 μm) which suggests that sulfide forms as liquid state. However, for sample 201–204, although the morphology of sulfide inclusions appears as round-like (15–20 μm), the compositions of these samples locate at the estimated solid sulfide region. This can also explain the size difference. As the sulfide turns into solid state, the repulsion force between solid sulfide particles prevents them from agglomerating.
4.2. Phase Equilibria Involving MnS–CrS–FeS in Liquid Metal Alloy of Fe–Cr–Mn–S SystemOn knowing the thermodynamic expressions of MnS–CrS–FeS system, both liquid and solid state, equilibria relations between liquid metal alloy phase and sulfide phase of Fe–Cr–Mn–S system can be calculated.
The present system was an Fe–Cr–Mn–S quaternary system. Metal(liq.)/Sulfide equilibrium can be expressed as being controlled by the following chemical equations:
| (23a) |
| (23b) |
| (23c) |
Left-hand side of the chemical equations represent constituents of metal alloy phase which is in liquid state. Right-hand side of the chemical equations represent constituents of sulfide phase. The state of sulfide phase could be either liquid state or solid state.
When reaching equilibrium, the following conditions should be allowed:
| (24a) |
| (24b) |
| (24c) |
At a given temperature T, the equations were rewritten as:
| (25a) |
| (25b) |
| (25c) |
The activity coefficients of Mn, Cr and S in metal alloy phase were expressed as functions of [mass%Mn], [mass%Cr] and [mass%S] according to Wagner’s formalism21) as following:
| (26a) |
| (26b) |
| (26c) |
| j i | Mn | Cr | S |
|---|---|---|---|
| Mn | 0 | 0.0039 | −0.0399 |
| Cr | 0.0039 | −0.0003 | −0.0211 |
| S | −0.0214 | −0.0113 | −0.0266 |
In stainless steel, the Cr contents is usually up to 20 mass% and the effect of Cr on the Fe activity have to be considered. Fortunately, Fe–Cr liquid phase is nearly ideal solution,22) hence, it was assumed the Fe activity coefficient, γFe, was unity up to 20 mass% Cr.
Once a proper expression of
| (27) |
| (28a) |
| (28b) |
| (28c) |
Eventually, at a given temperature T, in Eq. (25), the variables are equilibrium concentrations of [mass%Mn], [mass%Cr] and [mass%S] in metal phase and XMnS and XCrS in sulfide phase. With five variables and three confined equations, there are two freedoms in this system.
4.3. Estimation of Sulfide Formation from Liquid Metal Alloy of Fe–Cr–Mn–S System at 1793 KAccording to section 4.2, when a temperature was selected, there are two freedoms were left in Fe–Cr–Mn–S/MnS–CrS–FeS system. The [mass% S] in liquid Fe–Cr–Mn–S system, which is in equilibrium with the sulfide of MnS–CrS–FeS system, can be calculated as a function of [mass% Cr], [mass% Mn] in liquid Fe–Cr–Mn–S system. The iso-[mass% S] lines indicated by dotted lines were obtained at 1793 K shown in Fig. 9(a). Also, the equilibria XMnS, XCrS and XFeS can be calculated as a function of [mass% Cr], [mass% Mn] in liquid Fe–Cr–Mn–S system. It is much convenient to use R ratio: XMnS/(XMnS+XCrS) to represent sulfide composition as FeS content is low in stainless steel. The iso-R ratio lines indicated by dash-dotted lines were obtained at 1793 K shown in Fig. 9(b). In both Figs. 9(a) and 9(b), the solid black line represents the boundary between the formation of liquid sulfide phase and solid sulfide phase.

Comparison between calculated and experimental sulfur solubility at 1793 K.
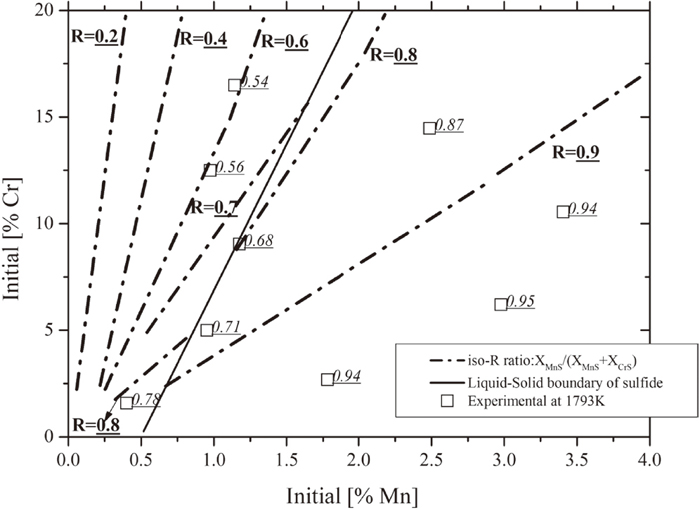
Comparison between calculated and experimental sulfide composition (R ratio) at 1793 K.
One most direct way to check the accuracy of the prediction is to compare between calculation and experimental results of metal/sulfide equilibrium at 1793 K. Experimental results indicated as the square symbols were plotted into Figs. 9(a) and 9(b) based on the equilibrium composition of [mass% Cr], [mass% Mn] in liquid Fe–Cr–Mn–S system from Fig. 4. The experimental results of [mass% S] and R ratio of each sample from Fig. 4 were attached and marked with underlined value. It can be noticed that for both [mass% S] and R ratio the experimental results agree well with predicted diagrams. This indicates the reliability of the phase equilibrium calculation. It also indicates that the extrapolation of thermodynamic properties of liquid sulfide phase from 1843 K to 1793 K is reasonable.
4.4. Estimation of Sulfide Formation during Solidification of Typical Stainless-steel CompositionAs can be noticed, the value of sulfur content of the plotted diagram in Fig. 9(a) are high for normal stainless steelmaking practice. In real stainless-steel making process, although the initial sulfur content is much lower than its solubility, sulfur content in liquid metal alloy tends increase to reach the solubility limit due to the segregation during solidification of metal alloy especially at the end of solidification temperature. Thus, the calculated phase relations between liquid metal alloy and sulfide phase in section 4.2 can also be utilized to estimate sulfide formation during solidification of typical stainless-steel composition.
4.4.1. Two Assumptions of Equilibrium Conditions during Solidification of Typical Stainless-steel Composition(1) Solidification Temperature Range of Fe–Cr–Mn Metal Alloy
For practical stainless-steel making compositions, such as Fe-(13–20 mass%) Cr-(0.5–2.5 mass%) Mn–S, there isn’t an accurate reported solidification temperature of metal alloy phase. However, it can be estimated roughly from the binary Fe–Cr20) and Fe–Mn20) phase diagrams. With an addition of 13–20 mass% of Cr, the solidus temperature of Fe–Cr system changes from 1803–1786 K. With an addition of 0.5–2.5 mass% of Mn, the solidus temperature of Fe–Mn system changes from 1803–1783 K. The temperature range is little. It is reasonable to calculate the equilibrium between liquid metal and sulfide phase using a representative temperature within the solidus temperature range. Since the sulfur content is usually controlled very low in real stainless steelmaking, it is most likely that sulfide forms at the last stage of solidification of metal alloy. Hence, in the following, 1783 K was chosen as a representative temperature to calculate the phase equilibrium between liquid metal and sulfide phase.
(2) Segregation of Solutes: Cr, Mn and S in Liquid Metal Alloy
According to binary Fe–Cr20) and Fe–Mn20) phase diagrams, Cr and Mn content do not segregate much between solid metal alloy and liquid metal alloy during solidification. Therefore, it is reasonable to assume that Cr and Mn content do not change much in liquid metal phase during solidification. As a result, Cr and Mn contents in liquid metal phase can be considered just as the initial alloying content.
During solidification of metal alloy, it is well known that sulfur content will concentrate into liquid metal phase. At the end of solidification, 1783 K, sulfur content could increase to its solubility limit to form sulfide phase.
4.4.2. Estimation of Sulfide Formation during Solidification of Typical Stainless-steel CompositionPhase relation diagram of iso-sulfur solubility line equipped with iso-R ratio lines at 1783 K was calculated and shown in Fig. 10.

Iso-[%S] solubility lines equipped with iso-XMnS/(XMnS+XCrS) lines at 1783 K.
To estimate the sulfide formation with typical initial compositions of Fe-15Cr-xMn-0.3S (x = 0.5–2.5), during solidification of metal alloy, the solute composition of Mn and Cr were assumed not changing while S content increases to the solubility limit at 1783 K. The sulfide formation can be estimated from Fig. 10. When sulfur content increases from initial 0.3 mass percentage to the corresponding value of sulfur solubility, sulfide forms and its composition can be estimated according to dash-dotted lines and the forming state can be distinguished according to the solidus-liquidus boundary line. The solid and dotted lines in Fig. 11 show the predicted sulfide compositions from present calculation, it can be noticed that with different initial Mn, the generated sulfide compositions were quantitatively controlled. At a critical Mn concentration about 1.3 mass%, sulfide changes from liquid state to solid state.

Comparison between estimated and experimental sulfide formation of Fe-15Cr-xMn-S system.
Experimental results of Oikawa et al.3) using Fe-15Cr-xMn-0.3S system and results of Kovach et al.2) and Ono and Kohno24) are plotted in Fig. 11. At the initial Mn contents of 0.5 and 1.7 mass percentage, the experimental results agree with the estimated curve. However, in the middle part of Mn contents, the experimental results and estimated results have a large discrepancy which indicates a difference of jump from liquid sulfide to solid sulfide. Experimental results from Oikawa suggest a jumping at lower temperature where sulfide phase contains lower Mn concentrations than at 1783 K. However, as it was mentioned in section 4.4.1, 1783 K is the end of solidification of metal alloy phase. If sulfide forms at a lower temperature than 1783 K, it means that sulfide will form at temperatures after solidification of metal alloy phase.
4.4.3. Discussions: Sulfide Formation MechanismIf sulfide forms at a temperature lower than metal solidification temperature. There are two possibilities.
a) In Fig. 12,3) if the initial sulfur content is low, during solidification of metal alloy phase, sulfur dissolves completely into solid metal once. Then at lower temperatures, sulfide precipitates from the solid metal alloy phase. If this is the real case, thermodynamic properties of solid Fe–Cr–Mn system is fundamentally necessary to know in the future to establish the equilibrium relationship between solid metal phase and sulfide phase.

Sulfide forming mechanisms.
b) In the experiments of Oikawa et al.,3) after heat treatment, the sample was cooled at a cooling rate of 30 K/min. If supercooling occurs during solidification, it is possible that sulfide forms at a temperature lower than the stable solidification temperature according to a meta-stable sulfide route provided by Oikawa et al.3) To calculate the phase equilibrium between liquid metal alloy and sulfide phase at a hypothetical supercooled temperature 1723 K, which is 60 K below the stable solidification temperature, in Fig. 13, metal/sulfide relationships were plotted. According to this diagram, sulfide formation in Fe-15Cr-xMn-0.3S (x = 0.5–2.5 mass%) were estimated again. The estimated results were shown in Fig. 14. In this plot, the estimated sulfide composition agrees with experimental results. A liquid-solid sulfide jumping point was also agree with each other. To confirm this hypothetical sulfide forming mechanism, the effects of cooling rate with sulfide formation should be investigated in the future work.

Iso-[%S] solubility lines equipped with iso-XMnS/(XMnS+XCrS) lines at 1723 K.

Comparison between estimated and experimental sulfide formation of Fe-15Cr-xMn-S system.
(1) Thermodynamic property of solid MnS–CrS–FeS phase was determined:
(2) Phase equilibrium between liquid metal alloy and sulfide phase in Fe-(13–20 mass%) Cr-(0.5–2.5 mass%) Mn–S system was calculated at a representative solidification temperature 1783 K. Iso-sulfur solubility lines equipped with iso-R: xMnS/(XMnS+XCrS) ratio lines were achieved. The calculated phase diagram can be directly used to explain the sulfide inclusion generated by different initial alloying contents under high sulfur situation. At low sulfur situation, sulfide will form according to two possible mechanisms: 1) sulfide will precipitate from solid metal phase 2) sulfide will form from a supercooled liquid metal phase. To make certain which one is the real mechanism, the following two factors should be considered in the future work: 1) the thermodynamic properties of solid Fe–Cr–Mn system in establish of the equilibrium between solid metal alloy and sulfide phase 2) the effect of cooling rate on sulfide formation.
The authors wish to thank Professor Tetsuya Nagasaka, Professor Takehito Hiraki and Professor Yasushi Sasaki (both Graduate School of Engineering, Tohoku University) for their valuable suggestions and encouragement. One of the authors (Yan Lu) gratefully acknowledges a scholarship provided by China Scholarship Council for his doctor study in Tohoku University. Also, financial support from ISIJ research grant and Nippon Steel Stainless Steel Corporation is gratefully appreciated.