Abstract
The kinetics of steam reforming of methane catalyzed by sponge iron was studied at temperatures between 875°C and 1050°C. Results shows that sponge iron acts as a catalyst and methane conversion is increased in higher temperatures and with a higher H2/H2O ratio in the inlet gas. A kinetic model based on chemical reaction control fits well the experimental data up to methane conversion of 0.5 with an apparent activation energy of 258 kJ/mol. Pore diffusion limits the reaction rate more intensely at higher conversions of methane, higher temperatures, and larger particle size (from 9 to 17 mm). Two types of industrial pellets were compared showing that microstructural properties such as porosity, pore size, and grain size impact reduction rate with hydrogen and the catalytic property of the obtained sponge iron.
1. Introduction
There is increasing pressure on steelmaking industries as they are large emitters of CO2.1) One of the alternatives to come to a net-zero CO2-emission in iron and steelmaking is the reduction of iron ore in shaft furnaces with H2 as the reducing agent, preferably obtained by water electrolysis using electricity generated by renewable sources.2,3)
The concept is based on direct reduction processes, that traditionally work with hot reducing gases composed mostly of CO and H2 flowing counter currently to a bed of iron ore pellets.2,3,4,5,6,7) The reducing gas mixture is produced via methane reforming that can be performed in an external reformer or inside the reduction shaft in which the reduced iron works as a catalyst.
The product is defined as sponge iron or direct reduced iron (DRI) that is fed in electric arc furnaces for melting and further processing to obtain steel. Sponge iron usually contains between 1.5 and 4.5 wt% of carbon that is useful in the melting process as it reduces the melting point of iron and works as a reductant for residual iron oxides or as fuel when it burns with injected oxygen.8,9,10)
The product obtained from reduction with pure H2 is free of carbon2) and therefore may bring difficulties in the melting step due to the high melting point of iron (1538°C). Therefore, some carburization is necessary, and this can be done by injecting methane in the reducing gas or the cooling zone of the reactor. One way to control the amount of carbon deposited is to add steam to the gas, and therefore both carburization and steam reforming of methane can happen.11)
Much work has been done in the fundamentals of iron ore reduction2,3,4,5,6,7,12,13,14,15,16) and carburization17,18,19,20,21,22,23,24,25,26) in gas-based direct reduction processes. The catalytic behavior of sponge iron has been studied27,28,29) regarding dry reforming of methane27) or in conditions similar to blast furnace operations.28,29) In both cases, gas compositions and temperatures are different from those of direct reduction processes.
Münster and Grabke17,30,31) studied the interaction of iron foils with methane-containing gases for both iron carburization by methane decomposition and steam reforming (Eq. (1)). A detailed mechanism is described in their papers and is related to the rapid decomposition of steam on the surface of the catalyst accompanied by methane decomposition that is the rate-determining step. Steam decomposition results in adsorbed oxygen on the surface of the catalyst, which reduces the quantity of available active sites for interaction with methane. The proposed rate equation is shown in Eq. (2).
|
C
H
4
(g)+
H
2
O(g)=CO(g)+3
H
2
(g)
| (1) |
|
-
r
C
H
4
=k⋅
1
1+K⋅
p
H
2
O
/
p
H
2
⋅
p
C
H
4
p
H
2
1/2
| (2) |
Where -rCH4 is the rate of methane reforming (mol·s−1·g−1), pi is the partial pressure of the gas i (atm), k is the kinetic constant (mol·atm−0.5·s−1·g−1), and K is the equilibrium constant for the water decomposition reaction, shown in Eq. (3).
|
H
2
O(g)=O(ads)+
H
2
(g)
| (3) |
In a paper published previously,11) the present authors showed results of the catalytic activity of sponge iron in steam reforming of methane. Gas composition with a higher H2/H2O ratio resulted in higher conversions of methane, which agrees with the mechanism proposed by Münster and Grabke.30,31) This can be a result of lower amounts of oxygen adsorbed in the internal surface of the pores. However, a quantitative analysis was not performed aiming at verifying whether the rate equation proposed by Münster and Grabke30,31) would fit the experimental data and whether diffusion limits the observed reaction rates.
Therefore, the objective of the present work is to present a kinetic analysis on steam reforming of methane catalyzed by sponge iron, discussing reaction mechanisms and rate control. Additionally, a comparison of the performance as catalysts for methane reforming of sponge irons produced from two different types of pellets is also presented.
2. Experimental Methods
Iron ore pellets for direct reduction produced by Vale and from another industrial producer (Pellet A) were used in this work. The chemical composition of such pellets is shown in Table 1. The pellet size distribution of Pellet Vale can be found in the previous paper11) with an average diameter of 12.6 mm. Pellet A was supplied in two size ranges that were combined in the same proportion, 8 mm to 12 mm and 12 mm to 16 mm, resulting in an average diameter of 12 mm.
Table 1. Chemical composition of iron ore pellets used in this work.
| wt% | Vale Pellet | Pellet A |
|---|
| Total Fe | 66.8 | 67.8 |
| SiO2 | 1.6 | 0.9 |
| Al2O3 | 0.5 | 0.2 |
| P | 0.03 | 0.03 |
| Mn | 0.08 | 0.03 |
| CaO | 1.8 | 1.0 |
| MgO | 0.60 | 0.69 |
| TiO2 | 0.04 | 0.18 |
| Loss on Ignition | 0.1 | 0.1 |
| CaO/SiO2 | 1.17 | 1.16 |
The detailed description of experimental apparatus and procedure can be found in the same previous paper.11) In summary, the experimental apparatus consisted of a gas injection system that controlled inlet flows of Ar, CH4, H2, and steam. The gases were directed to a double-walled metallic reactor that contained the bed of solids, either pellets or sponge iron. Inner diameter of the reactor was 48 mm. A thermocouple was placed inside the bed and was positioned at its half height to continuously measure the sample temperature. This reactor was hanging on a balance for monitoring weight and positioned inside an electric furnace. Off-gases were cooled, dried, and the content of CO and CO2 was determined using an infra-red gas analyzer.
To generate sponge iron for reforming experiments, 200 g of iron ore pellets were reduced at 950°C with 5 L/min (at 20°C and 1 atm) of pure H2 for 2 hours. Hydrogen was used as the reductant to avoid carbon deposition on the sponge iron in this step. The same procedure was repeated until the necessary quantity of sponge iron was obtained.
Pore structure of iron ore pellets and sponge iron was characterized by two different methods.
The first method is defined as sand filling that is computed by measuring the true density of the material and comparing it with the apparent density. The difference is then the overall porosity, considering open and closed pores. To measure the true density, the samples were pulverized at a particle size of less than 1 mm and were characterized by nitrogen pycnometry in equipment from Micromeritics, model AccuPyc II 1340. The apparent density was carried out by sand filling in a Micromeritics equipment model GeoPyc 1360. In this case, the equipment determined the volume of the samples, and together with the weights, the apparent densities were calculated.
The second technique was mercury intrusion in a Micromeritics AutoPore IV 9500 porosimeter applying pressures up to 4083 atm (60000 psi). This technique is only able to measure open porosity that is the pores that will be available for gases intake.
The cross-sections of some sponge iron particles were polished and observed in an optical microscope for a qualitative analysis of porosity and pore sizes.
The conditions of the methane-reforming experiments are listed in Table 2. To compare the potential for iron reduction and carburization by reaction with the gas, the compositions are also presented in Fig. 1 that is an equilibrium diagram considering all important reactions for the present system. Details on the construction of such diagram can be found elsewhere.32) Two compositions were chosen. Composition 1 lies in the region that iron is thermodynamically stable. Also, the ratio H2/H2O is 2 which is high enough to prevent iron oxidation by reaction with steam, and the ratio H2O/CH4 is 4 to avoid carbon deposition. The carbon activity in equilibrium with Composition 2 is higher for the temperature range of this work as H2O/CH4 ratio is 1.0 and the reducing potential is also higher since H2/H2O ratio is 4.4.
Table 2. Experimental conditions for tests of steam reforming of methane with sponge iron as a catalyst.
| Composition | vol.% | Temperature (°C) | Mass of sponge iron (g) | Total inlet flow rate (L/min at 20°C and 1 atm) |
|---|
| H2 | CH4 | H2O | Ar |
|---|
| 1 | 52 | 13 | 26 | 10 | 875, 900, 950, 1000, 1050 | 25, 50, 65, 85, 100 | 2.5 to 8.0 |
| 2 | 62 | 14 | 14 | 10 | 875, 950, 1050 | 25 and 50 | 2.5 to 12.0 |
The experimental procedure for the reforming experiments initiates by heating the system to the desired temperature under a flow of 1 L/min of Ar. In sequence, the gas mixture for reforming was injected at different flows while the temperature measured inside the bed of sponge iron was maintained constant within a ± 5°C interval from the set point. Different masses of sponge iron were used in different experiments. All parameters are listed in Table 2.
Methane conversion was calculated through a carbon balance, considering that no carbon deposited unto sponge iron, and that reacted methane would form either CO or CO2 that were continuously analyzed in the off gas.11)
Interrupted tests were performed to measure the carbon content in the DRI after reforming experiments. The carbon content was determined in a LECO CS-300 equipment.
Reforming experiments with sponge iron particles of different diameters were also performed. Vale pellets were sieved in two ranges: 8 mm to 10 mm and 16 mm to 18 mm, resulting in average sizes of 9 mm and 17 mm, respectively. These pellets were reduced in H2 according to the same procedure and reforming experiments were conducted at 1050°C with composition 1.
Pellet A was reduced with H2 following the same procedure as before. The produced sponge iron was used in experiments at 1050°C with the gas of composition 1. Results from reduction and reforming were used for comparing the behavior of the two types of pellets.
3. Results and Discussion
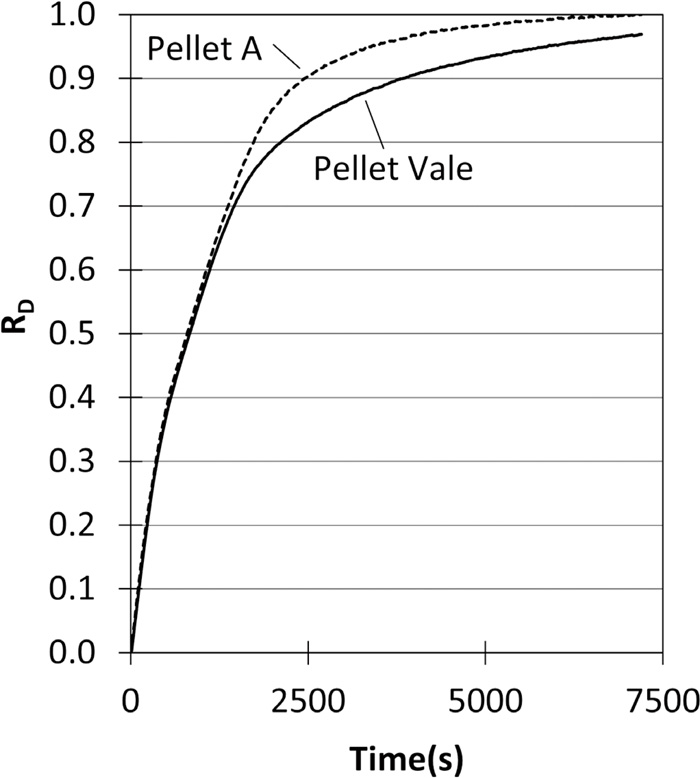
The reduction degree (RD) of Pellet Vale was 0.955 ± 0.005 for 24 performed tests11) under the same conditions. A typical curve showing the evolution of RD over time is shown in Fig. 2. RD was calculated by the ratio of measured mass loss to the mass of oxygen bonded to iron, considering that all iron in the pellets was in the form of Fe2O3.
Figure 3(a) shows the microstructure of sponge iron from Pellet Vale that contains larger pores forming a connected structure and smaller pores entering individual metal particles. Results of porosity measurements made with sand filling and mercury intrusion performed on Pellet Vale and sponge iron are listed in Table 3. During the reduction step, porosity increased from 28.7% to 64.8% determined by the sand filling method and from 17.89% to 58.80% by mercury intrusion. Differences in values from the two methods may be related to the fact the mercury intrusion is only capable of identifying open porosity and therefore the values are smaller.

Table 3. Density and pores properties in iron ore pellets and sponge iron determined by different methods.
| N2 pycnometry | Sand filling | Hg intrusion |
|---|
| Raw material | Sample | True density (g/cm3) | Porosity (%vol) | Porosity (vol.%) | Avg. pore size (μm) | Internal surface area (m2/g) |
|---|
| Vale Pellet | Pellet | 5.03 | 28.7 | 17.29 | 8.00 | 5.294 |
Sponge Iron
(after reduction) | 7.07 | 64.8 | 58.80 | 10.59 | 3.156 |
Sponge Iron
(after reforming) | | 64.7 | – | – | – |
| Pellet A | Pellet | 5.15 | 20.5 | 21.35 | 3.06 | 3.069 |
Sponge Iron
(after reduction) | 7.20 | 66.3 | 45.53 | 4.75 | 8.015 |
Sponge Iron
(after reforming) | | 62.7 | – | – | – |
Anyhow, a porous material is formed during reduction. Average pore size increased due to reduction and internal surface area decreased, mainly because of the lower presence of pores with sizes smaller than 0.1 μm in the sponge iron. These are the pores with the most impact on the total surface area.
The produced sponge iron obtained from Pellet Vale was used in the reforming experiments, which results are presented in Fig. 4. All obtained experimental points are presented in Tables A1 and A2 in the appendix. Error bars represent the confidence intervals with 95% confidence level calculated from reproducibility tests. Sponge iron act as a catalyst for the reforming of methane in all temperatures tested, as conversions are significant. Conversion increased at higher temperatures and higher values of the ratio W/FCH40. However, the reforming rate, that is the derivative of the presented curves, was higher at lower conversions and decreased as the ratio W/FCH40 increased.
It can be seen that the rate of reaction and methane conversions with Composition 2 were higher than with Composition 1 by comparing Figs. 4(a) and 4(b) at the same value of W/FCH40 and the same temperature.
The results of interrupted tests showed that no carbon deposition occur for composition 1, since the measured carbon content was 0.01 wt% for times up to 30 minutes. For composition 2, carbon content reached 0.5 wt.% after 30 minutes, meaning that only 4.9% of the injected methane was consumed by carbon deposition. This value is low enough for the consideration of no carbon deposition to be still valid, and calculation of methane conversion can be made based on the off-gas analysis as explained in section 2.
To verify the rate-determining step in the catalytic reforming of methane, the following steps are considered: gas diffusion through the gas stagnant film around the sponge iron, gas diffusion through pores, and chemical reaction at the inner pore surface.
3.1. Evaluation of Chemical Reaction at the Interface as the Rate-determining Step of Methane Reforming
The first step to be considered is the chemical reaction at the inner pore surface. The experimental setup is a packed bed reactor (PBR) filled with particles of sponge iron. Equation (4) gives the methane conversion along the bed of sponge iron in differential and integral form.33)
|
dX
d(W/
F
C
H
4
0
)
=-
r
C
H
4
or
∫
0
X
dX
-
r
C
H
4
=
W
F
C
H
4
0
| (4) |
where F
CH40 is the inlet molar flow rate (mol/s) of methane, X is methane conversion, and W is the mass (g) of sponge iron in the reactor.
The experiments were planned to vary both the mass of sponge iron (W) and the inlet flow rate of methane (FCH40) at different levels. The ratio W/FCH40 is proportional to the contact time between the gas and the solid, and higher contact times resulted in increased conversions of methane since the gas had more time to interact with the catalyst.
The model for kinetic control by the chemical reaction at the interface is shown in Eqs. (5) and (6), which are obtained by coupling the rate equation proposed by Münster and Grabke30,31) (Eq. (2)) with the mass balance for PBR in the integral form (Eq. (3)).
|
∫
0
X
dX
f(X)
=k⋅
W
F
C
H
4
0
| (5) |
|
f(X)=
1
1+K⋅p
H
2
O/p
H
2
⋅
pC
H
4
p
H
2
1/2
| (6) |
Where,
|
K=exp(
-
125 323-166.53⋅T
R⋅T
)
| (7) |
T is the temperature (K) and R is the universal gas constant (= 8.31 J/mol.K).
To calculate the expression in Eq. (6), the value of the equilibrium constant for the water decomposition reaction, K, is needed. This value was obtained by fitting the experimental data from Münster and Grabke30,31) in Eq. (2), which resulted in Eq. (7).
Plotting experimental data of gas composition 1 according to Eq. (4) results in Fig. 5. Data fitted well a straight line up to conversions of methane of 0.5 (closed circles). At 875°C and 900°C, most of the experimental points are below that limit of conversion and at higher temperatures, data clearly shows a different trend above conversion of 0.5 (open circles).
Figure 6 brings the same curves for data from experiments with gas composition 2. The data of gas composition 1 up to the conversion of 0.5 forming a straight line are also presented. Experimental data of composition 2 agrees well with the straight line for 875°C, in which methane conversion was smaller than 0.5. For higher temperatures, the data follow the straight line up to the point indicated by the arrows and deviate from the straight line above this point. Again, the point of deviation from the model is methane conversion of 0.5.
Finally, it is possible to determine the kinetic constants considering data from both gas compositions up to conversions of 0.5. The slopes of the straight lines in Fig. 7 are the kinetic constants, k, of Eq. (4) at different temperatures. The values of the slopes of curves from Figs. 5, 6, and 7 are presented in Table 4.
Table 4. Kinetic constants obtained from the slope of curves in
Figs. 5 and
7, based on the model for chemical reaction control.
| Temperature | 875°C | 900°C | 950°C | 1000°C | 1050°C |
|---|
k (mol·s−1·g−1·atm-1/2)
Composition 1 | 3.8·10−3 | 7.7·10−3 | 2.3·10−2 | 5.4·10−2 | 1.5·10−1 |
k (mol·s−1·g−1·atm-1/2)
Compositions 1 and 2 | 3.6·10−3 | | 2.3·10−2 | | 1.4·10−1 |
k (mol·s−1·g−1·atm-1/2)
Consolidated | 3.6·10−3 | 7.7·10−3 | 2.3·10−2 | 5.4·10−2 | 1.4·10−1 |
The Arrhenius plot of the consolidated kinetics constants is shown in Fig. 8 fitting well a straight line, which regression equation is showed in Eq. (8). Apparent activation energy is 258 kJ/mol. The activation energy calculated from the data of Münster and Grabke30,31) was 272 kJ/mol. The values are similar and in the expected range for methane reforming controlled by catalytic chemical reaction.
|
ln(k)=21.55-
258⋅
10
3
R⋅T
| (8) |
Conclusively, the model of chemical reaction control based on the mechanism proposed by Münster and Grabke30,31) explains well the experimental data obtained for conversions of methane up to 0.5.
3.2. Diffusion Limitations on the Rate of Methane Reforming
The reaction rate above conversions of 0.5 may be limited by diffusion. To verify the effect of diffusion through the gas stagnant film, the results from different masses of sponge iron and the same values of W/FCH40 will be compared. In Fig. 4 two results are presented with W/FCH40 = 20 g.h/mol at 1050°C: one with 25 g of sponge iron (closed circle) and the other with 50 g (open circle). For the latter, the inlet flow was doubled to keep the same value of W/FCH40, which reduces the width of the stagnant layer around the sponge iron. Methane conversion was very similar for both conditions showing that diffusion through the stagnant gas film is not impacting the rate of reaction. The same analysis can be conducted for many other points at different temperatures and gas compositions with the same conclusion.
In sequence, the effect of pore diffusion will be considered by comparing the catalytic effect of sponge iron particles of different average diameters (9, 12.6, and 17 mm). These results are presented in Fig. 9 for gas composition 1. Smaller sponge iron particles led to higher conversions of methane. This particle size influence was significant both at 1050°C and 875°C as can be seen in the similar variations in methane conversion indicated in Fig. 9.

Different gas species are interacting with the sponge iron during the steam reforming of methane and the diffusion of all can be taken into consideration. A simple and effective way of computing the effect of diffusion of methane on the rate of reforming is the Thiele modulus,33) which can be calculated according to Eq. (9) for a sphere and considering the first-order kinetics in respect to methane. It is possible to calculate the Thiele modulus for kinetic expressions in which adsorption of gas species and formation of intermediate compounds are relevant for reaction rate as is the case of Eq. (2). However, a more complex mathematical model is required like what has been done by Roberts and Satterfield.37) This is out of the scope of the present work and only methane diffusion will be taken into consideration for the sake of simplicity.
where,
r is the radius of the sponge iron (0.63 cm), k′ is the kinetic constant (s
−1), D
eff is the overall effective diffusivity of methane through the pores of sponge iron (cm
2·s
−1).
The values of k′, Deff and Ф1 can be found in Tables A1 and A2 in the Appendix, as well as the description of the method for calculating k′ and Deff.
Equation (10) shows the variation of methane concentration along the radius of sponge iron as a function of Thiele modulus. The result of such calculation is shown in Fig. 10.
|
C
C
H
4
C
C
H
4
s
=
1
x/r
sinh(
Φ
1
⋅x/r
)
/sinh
Φ
1
| (10) |
where,
CCH4 and
CCH4s are the concentration of methane along the radius (x) of the sponge iron and at the outer surface (x=r), respectively.

For values of Thiele below 1.1, methane concentration is close to the surface concentration. This means that the diffusion rate is fast enough to enable the gas to reach all the volume of the sponge iron while little is consumed and, therefore, diffusion has little effect on the rate of reforming. At intermediate values, from 1.1 to 5, the diffusion rate is lower, and methane is consumed more along the radius and only a fraction of the gas reaches the center of the sponge iron (x/r = 0). This fraction of methane reaching the center is smaller for higher values of Thiele´s modulus. At high values of Thiele modulus, above 5.0, only part of the sponge iron volume is accessed by the reacting methane. Therefore, not the entire volume or the entire pore surface is used in the catalytic reforming. Thiele modulus is usually below 0.75 in catalytic processes in which the rate is determined by a first-order chemical reaction at the interface with virtually no diffusion limitations. When the rate is determined by diffusion, Thiele modulus is usually above 3.33)
In the performed experiments, the values of the Thiele modulus change as methane reforming proceeds since gases partial pressures are changing impacting both the value of k′ and Deff (see Tables A1 and A2). For composition 1, values of Thiele modulus ranged from 1.13 to 3.78, showing that most of the experimental points lie in the region of mixed control. For composition 2, the values are higher and range from 1.35 to 9.43 showing diffusion plays a more important role. For both compositions, Thiele modulus increased for higher conversions and higher temperatures.
Diffusion limitations are less significant at lower conversions and lower temperatures, which agrees with the proposed model of control by chemical reaction at interface up to conversions of methane of 0.5. Nevertheless, there is a mixed control which can be the reason for the lower apparent activation energy (258 kJ/mol) of the present work in comparison to Münster and Grabke30,31) data (272 kJ/mol) in which diffusion limitations were not present.
By changing the sponge iron particle size from 9 mm to 17 mm, the Thiele modulus also changes. At 9 mm and 875°C for composition 1, Thiele modulus starts at 0.72 and Fig. 10 shows that at this condition, diffusion limitations are virtually eliminated. On the contrary, for 17 mm and 1050°C at the point of higher methane conversion, Thiele modulus is 12.8 and internal diffusion limits the reaction severely as shown in Fig. 10.
In summary, results have shown that the kinetic model of rate control by chemical reaction fits well experimental data up to conversions of 0.5. Pore diffusion is limiting the reforming reaction rate more severely at higher conversions, higher temperatures, and larger particle sizes. To describe completely the kinetics of methane reforming, a more complex mathematical model needs to be developed considering the diffusion of all species, which can be a topic for future work.
3.3. Effect of Type of Iron ore Pellet on the Catalytic Properties of Sponge Iron for Methane Reforming
The reduction of Pellet A was conducted in the same manner as Pellet Vale and the result is presented in Fig. 2. Reduction of Pellet A displayed similar behavior to that of Pellet Vale up to a reduction degree of 0.70. At this point, the rate of reduction of Pellet A becomes higher and the final reduction degree is 1.0, while Pellet Vale remained close to 0.95.
Reforming experiments were conducted with gas composition 1 at 1050°C and results are presented in Fig. 11. Conversions obtained with Pellet A were smaller than with Pellet Vale, but the conversion curves have the same shape, i.e., a higher conversion rate at the beginning that slows down as reaction proceeds. Therefore, there is no data to justify a change in the reaction mechanisms due to the change in the type of pellet from Pellet Vale to Pellet A.
Pellet A showed a lower porosity when compared to Pellet Vale measured by sand filling, i.e., total porosity. However, mercury intrusion showed the opposite with Pellet A having a higher porosity, which means this pellet have a higher open porosity than Pellet Vale. Nevertheless, the average pore size of Pellet A is lower than half of Pellet Vale. These differences in porosity and pore size are not expected to impact the rate of reduction since it was conducted with hydrogen that is a gas with high mobility.
Figure 3 shows the microstructures of sponge iron obtained from both pellets. The structure of the sponge iron from Pellet A presents smaller grains. This observation agrees with the average pore sizes measured by mercury intrusion, which were 10.59 μm and 4.75 μm for sponge iron from Pellet Vale and Pellet A, respectively. Smaller grains favor the reduction in the final stages (RD > 0.75) as reducing gas needs to diffuse through a dense metallic layer found around grains with non-reduced oxides at their center.38,39) In the case of Pellet A, where the grains are smaller, the diffusion distance to be covered by the reducing gas is smaller, leading to the completeness of the reaction within 2 hours.
Concerning the catalytic behavior in methane reforming, the sponge iron of Pellet A has a smaller average pore size and lower porosity. The effective diffusivity of methane (Deff) calculated for the sponge iron of Pellet Vale is 1.41 cm2/s at 1050°C for composition 1 at the first experimental point (X = 0.35). For the sponge iron of Pellet A, this value reduces to 1.01 cm2/s. This explains the observed lower rate of methane reforming since diffusion limitations are impacting reaction rate as already discussed. Moreover, this limitation is expected to increase at higher conversions of methane, which is shown in the experimental results as the gap between the two conversion curves enlarge as the reaction proceeds.
4. Conclusions
Methane reforming experiments were performed with sponge iron as a catalyst. The used gas mixtures were composed of H2, H2O, CH4, and Ar. System temperatures varied between 875°C and 1050°C and total pressure was 1 atm. The obtained results showed that:
• Sponge iron acts as a catalyst and it was possible to obtain methane conversions up to 87% due to steam reforming at 1050°C.
• A kinetic model based on chemical reaction control according to the mechanism proposed by Münster and Grabke30,31) fitted well the experimental data up to methane conversion of 0.5. Apparent activation energy is 258 kJ/mol.
• The effect of methane diffusion through the pores of sponge iron was estimated by calculating the Thiele modulus, considering a simple first-order rate equation. The results indicate a mixed control mechanism for the reaction sponge iron with a diameter between 9 and 17 mm. Diffusion limitation increases at higher conversions of methane, higher temperatures, and larger particle size. A more complete evaluation is required, using mathematical models to solve the mass balance, transport, and reaction of methane, hydrogen, and water vapor across the sponge iron radius.
• The use of Pellet A compared to pellet Vale results in a higher reduction degree by reaction with hydrogen for Pellet A. This can be credited to smaller grain size in Pellet A. On the other hand, the conversion of methane on catalytic reforming was higher for the sponge iron obtained from Pellet Vale. This sponge iron has a higher porosity and larger pore size resulting in higher diffusivity of methane and consequently, higher conversion.
Acknowledgments
The authors would like to thank the GASFERROSIL project (grant number: 224950/E30) financed by the Research Council of Norway and FIPT (The Foundation for the Support of the Institute for Technological Research) for supporting this project.
References
- 1) N. Pardo, J. Moya Rivera and K. Vatopoulos: Prospective Scenarios on Energy Efficiency and CO2 Emissions in the EU Iron and Steel Industry, EUR 25543, Publications Office of the European Union, Luxembourg, (2012), JRC74811.
- 2) F. Patisson and O. Mirgaux: Metals, 10 (2020), 922. https://doi.org/10.3390/met10070922
- 3) D. Spreitzer and J. Schenk: Steel Res. Int., 90 (2019), 1900108. https://doi.org/10.1002/srin.201900108
- 4) R. Takahashi, Y. Takahashi, J. Yagi and Y. Omori: Trans. Iron Steel Inst. Jpn., 26 (1986), 765. https://doi.org/10.2355/isijinternational1966.26.765
- 5) Y. Takenaka, Y. Kimura, K. Narita and D. Kaneko: Comput. Chem. Eng., 10 (1986), No. 1, 67. https://doi.org/10.1016/0098-1354(86)85047-5
- 6) A. Shams and F. Moazeni: JOM, 67 (2015), 2681. https://doi.org/10.1007/s11837-015-1588-0
- 7) H. Hamadeh, O. Mirgaux and F. Patisson: Materials, 11 (2018), 1865. https://doi.org/10.3390/ma11101865
- 8) M. Kirschen, T. Hay and T. Echterhof: Processes, 9 (2021), 402. https://doi.org/10.3390/pr9020402
- 9) S. K. Dutta, A. B. Lele and N. K. Pancholi: Trans. Indian Inst. Met., 57 (2004), No. 5, 467.
- 10) R. D. Morales, H. Rodríguez-Hernández and A. N. Conejo: ISIJ Int., 41 (2001), No. 5, 426. https://doi.org/10.2355/isijinternational.41.426
- 11) T. Ramos Ribeiro, J. B. Ferreira Neto, J. G. Rocha Poço, C. Takano, L. Kolbeinsen and E. Ringdalen: ISIJ Int., 61 (2021), 182. https://doi.org/10.2355/isijinternational.ISIJINT-2019-477
- 12) E. T. Turkdogan and J. V. Vinters: Metall. Mater. Trans. B, 2 (1971), 3175. https://doi.org/10.1007/BF02814970
- 13) N. Towhidi and J. Szekely: Ironmaking Steelmaking, 8 (1981), 237.
- 14) M. Ishigaki, R. Takahashi and Y. Takahashi: Bull. Res. Inst. Miner. Dressin. Metall., 38 (1982), 35.
- 15) A. A. El-Geassy, K. A. Shehata and S. Y. Ezz: Trans. Iron Steel Inst. Jpn., 17 (1977), 629. https://doi.org/10.2355/isijinternational1966.17.629
- 16) M.-H. Bai, H. Long, S.-B. Ren, D. Liu and C.-F. Zhao: ISIJ Int., 58 (2018), 1034. https://doi.org/10.2355/isijinternational.ISIJINT-2017-739
- 17) H. J. Grabke: Metall. Trans., 1 (1970), 2972. https://doi.org/10.1007/BF03037847
- 18) H. J. Grabke, E. M. Müller-Lorenz and A. Schneider: ISIJ Int., 41 (2001), S1. https://doi.org/10.2355/isijinternational.41.Suppl_S1
- 19) O. Ostrovski and G. Zhang: AIChE J., 52 (2006), 300. https://doi.org/10.1002/aic.10628
- 20) Y. He and P. C. Pistorius: Metall. Mater. Trans. B, 47 (2016), 1538. https://doi.org/10.1007/s11663-016-0619-8
- 21) J. Zhang and O. Ostrovski: ISIJ Int., 41 (2001), 333. https://doi.org/10.2355/isijinternational.41.333
- 22) Y. Iguchi, S. Sawai and K. Ohiwa: Metall. Mater. Trans. B, 32 (2001), 1161. https://doi.org/10.1007/s11663-001-0103-x
- 23) Y. Iguchi, K. Hori-I, T. Shibata and S. Hayashi: ISIJ Int., 44 (2004), 984. https://doi.org/10.2355/isijinternational.44.984
- 24) Y. Iguchi, K. Hori-I and T. Shibata: ISIJ Int., 44 (2004), 992. https://doi.org/10.2355/isijinternational.44.992
- 25) S. Hayashi and Y. Iguchi: ISIJ Int., 38 (1998), 1053. https://doi.org/10.2355/isijinternational.38.1053
- 26) K. Nishihiro, T. Maeda, K. Ohno and K. Kunitomo: ISIJ Int., 59 (2019), 634. https://doi.org/10.2355/isijinternational.ISIJINT-2018-393
- 27) O. G. Dam G. and H. R. Bueno C.: Method and Apparatus for the Direct Reduction of Iron, CA, CIPO, CA1336359, (1988).
- 28) M. Jampani: Ph.D. thesis, Carnegie Mellon University, (2016), https://doi.org/10.1184/R1/6720188.v1, (accessed 2021-09-15).
- 29) M. Jampani, J. Gibson and P. C. Pistorius: Metall. Mater. Trans. B, 50 (2019), 1290. https://doi.org/10.1007/s11663-019-01538-8
- 30) P. Münster and H. J. Grabke: Ber. Bunsenges. Phys. Chem., 84 (1980), 1068. http://doi.wiley.com/10.1002/bbpc.19800841029
- 31) P. Münster and H. J. Grabke: J. Catal., 72 (1981), 279. https://doi.org/10.1016/0021-9517(81)90010-5
- 32) T. R. Ribeiro, J. B. Ferreira Neto, J. G. R. Poço, C. Takano, L. Kolbeinsen and E. Ringdalen: J. Mater. Res. Technol., 13 (2021), 1576. https://doi.org/10.1016/j.jmrt.2021.05.033
- 33) H. S. Fogler: Elements of Chemical Reaction Engineering, Pearson Education, London, (2016), 957.
- 34) E. N. Fuller, P. D. Schettler and J. C. Giddings: Ind. Eng. Chem., 58 (1966), No. 5, 19. https://doi.org/10.1021/ie50677a007
- 35) R. S. Brokaw: Ind. Eng. Chem. Process Des. Dev., 8 (1969), 240. https://doi.org/10.1021/i260030a015
- 36) D. F. Fairbanks and C. R. Wilke: Ind. Eng. Chem., 42 (1950), 471. https://doi.org/10.1021/ie50483a022
- 37) G. W. Roberts and C. N. Satterfield: Ind. Eng. Chem. Fundam., 4 (1965), 288. https://doi.org/10.1021/i160015a009
- 38) A. Bonalde, A. Henriquez and M. Manrique: ISIJ Int., 45 (2005), 1255. https://doi.org/10.2355/isijinternational.45.1255
- 39) J. Szekely and J. W. Evans: Chem. Eng. Sci., 25 (1970), 1091. https://doi.org/10.1016/0009-2509(70)85053-9
Appendix
Calculation of Kinetic Constant, k′, Effective Diffusivity of Methane (Deff) and Thiele Modulus, Ф1, from Experimental Data of Methane Reforming
Equation (A1) presents the expression for calculating k′ from the consolidated values of k presented in Table 4.
|
k
′
=k⋅
1
1+Kp
H
2
O/p
H
2
⋅
1
p
H
2
1/2
⋅RT⋅
10
3
⋅
ρ
C
| (A1) |
Where, ρc is the apparent density of the sponge iron (2.97 g·cm−3) obtained from the porosity (58.80%) of sponge iron and true density of the sponge iron (7.07 g·cm−3).
The partial pressure of hydrogen and steam was calculated with a mass balance based on the known inlet gas flow and gas composition and the measured outlet gas concentrations of CO and CO2. It was considered that no accumulation occurred for any species.
Molecular methane diffusivity in the gas mixture was calculated from the binary diffusivities of all combinations of the components (CO, CO2, CH4, H2, H2O, and Ar). The model of Fuller, Schettler, and Giddings34) was used for the pairs of nonpolar gases. For pairs with at least one polar component, the model of Chapman-Ensok with Brokaw35) correction was chosen. Fairbanks and Wilke36) relation was used for calculating methane molecular diffusivity in the gas mixture from the binary diffusivities. Knudsen diffusivity was also calculated based on the average pore size of the sponge iron obtained from Vale Pellet (10.59 μm) presented in Table 3. The overall diffusivity was computed as a sum of two resistances, i.e., the sum of the inverse of Knudsen and molecular diffusivities for methane.
At last, the effective diffusivity (Deff) of methane was then calculated based on tortuosity (2.02) and porosity (58.8%) of sponge iron determined by mercury intrusion.
Table A1. Values of kinetic constant, k′, overall diffusivity of methane, D
g, and Thiele modulus, Ф, from experimental data for gas composition 1.
| T (°C) | W (g) | FCH40 (L/min†) | W/FCH40 (g.s/mol) | CO - dry (vol%) | CO2 - dry (vol%) | X | pH2 (atm) | 1−θ* (x 10−4) | k′ (s−1) | Deff (cm2/s) | Ф1 |
|---|
| 875 | 100 | 1.02 | 141610 | 2.62 | 0.69 | 0.22 | 0.57 | 27 | 3.65 | 1.14 | 1.13 |
| 875 | 100 | 0.64 | 226326 | 3.76 | 0.86 | 0.32 | 0.59 | 31 | 4.04 | 1.15 | 1.18 |
| 875 | 100 | 0.50 | 290050 | 4.50 | 0.93 | 0.38 | 0.61 | 33 | 4.34 | 1.15 | 1.22 |
| 875 | 100 | 0.40 | 362044 | 5.25 | 0.97 | 0.45 | 0.62 | 36 | 4.68 | 1.16 | 1.27 |
| 875 | 100 | 0.32 | 453775 | 5.77 | 0.98 | 0.50 | 0.63 | 39 | 4.94 | 1.17 | 1.30 |
| 900 | 50 | 1.02 | 71425 | 2.00 | 0.51 | 0.16 | 0.56 | 19 | 4.70 | 1.16 | 1.27 |
| 900 | 85 | 1.02 | 122153 | 3.54 | 0.80 | 0.29 | 0.59 | 23 | 5.62 | 1.17 | 1.38 |
| 900 | 50 | 0.40 | 182248 | 4.24 | 0.81 | 0.35 | 0.60 | 24 | 6.53 | 1.19 | 1.48 |
| 900 | 85 | 0.59 | 211305 | 5.25 | 0.95 | 0.45 | 0.63 | 28 | 6.93 | 1.19 | 1.52 |
| 900 | 50 | 0.32 | 228110 | 5.04 | 0.82 | 0.42 | 0.62 | 27 | 7.76 | 1.20 | 1.60 |
| 900 | 85 | 0.42 | 297056 | 6.35 | 0.97 | 0.55 | 0.65 | 32 | 7.45 | 1.20 | 1.57 |
| 900 | 85 | 0.32 | 390058 | 7.27 | 0.92 | 0.64 | 0.66 | 35 | 8.71 | 1.21 | 1.69 |
| 950 | 25 | 1.02 | 38151 | 2.06 | 0.43 | 0.16 | 0.56 | 11 | 8.56 | 1.24 | 1.66 |
| 950 | 25 | 0.54 | 72022 | 3.36 | 0.61 | 0.26 | 0.58 | 13 | 10.19 | 1.26 | 1.79 |
| 950 | 65 | 1.02 | 92019 | 4.56 | 0.53 | 0.35 | 0.60 | 14 | 11.45 | 1.27 | 1.89 |
| 950 | 25 | 0.32 | 121680 | 4.94 | 0.69 | 0.40 | 0.61 | 15 | 12.49 | 1.28 | 1.97 |
| 950 | 65 | 0.60 | 156510 | 6.13 | 0.63 | 0.50 | 0.63 | 17 | 13.21 | 1.28 | 2.02 |
| 950 | 65 | 0.42 | 223599 | 7.14 | 0.64 | 0.59 | 0.65 | 19 | 14.64 | 1.29 | 2.12 |
| 950 | 65 | 0.32 | 293713 | 7.91 | 0.57 | 0.67 | 0.66 | 21 | 16.31 | 1.30 | 2.23 |
| 1000 | 25 | 1.02 | 36224 | 2.95 | 0.25 | 0.21 | 0.57 | 7.3 | 12.86 | 1.32 | 1.97 |
| 1000 | 25 | 0.68 | 54350 | 3.81 | 0.36 | 0.28 | 0.58 | 8.0 | 15.97 | 1.35 | 2.17 |
| 1000 | 50 | 1.02 | 71951 | 5.08 | 0.44 | 0.39 | 0.61 | 9.1 | 17.28 | 1.35 | 2.25 |
| 1000 | 25 | 0.51 | 72405 | 4.63 | 0.42 | 0.35 | 0.60 | 8.7 | 19.38 | 1.37 | 2.37 |
| 1000 | 25 | 0.42 | 88818 | 5.47 | 0.48 | 0.42 | 0.62 | 9.5 | 18.60 | 1.36 | 2.33 |
| 1000 | 50 | 0.73 | 100562 | 6.01 | 0.50 | 0.47 | 0.63 | 10 | 20.18 | 1.37 | 2.42 |
| 1000 | 25 | 0.32 | 115590 | 6.50 | 0.49 | 0.52 | 0.64 | 11 | 21.30 | 1.37 | 2.48 |
| 1000 | 50 | 0.54 | 135929 | 6.86 | 0.52 | 0.55 | 0.64 | 11 | 22.34 | 1.38 | 2.54 |
| 1000 | 50 | 0.45 | 163226 | 7.42 | 0.52 | 0.61 | 0.65 | 12 | 23.29 | 1.38 | 2.59 |
| 1000 | 50 | 0.38 | 193214 | 7.79 | 0.50 | 0.65 | 0.66 | 13 | 24.77 | 1.39 | 2.66 |
| 1000 | 50 | 0.32 | 230041 | 8.29 | 0.49 | 0.70 | 0.67 | 13 | 25.77 | 1.39 | 2.71 |
| 1050 | 25 | 1.02 | 36839 | 4.44 | 0.62 | 0.35 | 0.60 | 5.6 | 22.67 | 1.41 | 2.53 |
| 1050 | 25 | 0.85 | 43863 | 4.74 | 0.66 | 0.38 | 0.61 | 5.8 | 33.18 | 1.45 | 3.01 |
| 1050 | 25 | 0.72 | 51188 | 5.24 | 0.69 | 0.42 | 0.62 | 6.2 | 34.23 | 1.45 | 3.06 |
| 1050 | 25 | 0.63 | 58509 | 5.73 | 0.71 | 0.47 | 0.63 | 6.6 | 36.02 | 1.46 | 3.13 |
| 1050 | 25 | 0.55 | 66991 | 6.08 | 0.73 | 0.50 | 0.63 | 6.8 | 37.84 | 1.46 | 3.21 |
| 1050 | 50 | 1.02 | 73470 | 6.54 | 0.71 | 0.54 | 0.64 | 7.2 | 39.27 | 1.47 | 3.26 |
| 1050 | 25 | 0.51 | 74434 | 6.43 | 0.72 | 0.53 | 0.64 | 7.1 | 41.02 | 1.47 | 3.33 |
| 1050 | 25 | 0.40 | 92147 | 6.96 | 0.74 | 0.59 | 0.65 | 7.6 | 40.60 | 1.47 | 3.31 |
| 1050 | 25 | 0.32 | 117747 | 7.55 | 0.71 | 0.64 | 0.66 | 8.2 | 43.15 | 1.47 | 3.41 |
| 1050 | 50 | 0.52 | 145526 | 8.26 | 0.72 | 0.72 | 0.68 | 9.0 | 46.02 | 1.48 | 3.51 |
| 1050 | 50 | 0.41 | 182856 | 8.76 | 0.70 | 0.77 | 0.68 | 9.7 | 50.31 | 1.49 | 3.66 |
| 1050 | 50 | 0.32 | 234629 | 9.17 | 0.68 | 0.82 | 0.69 | 10 | 53.56 | 1.49 | 3.78 |
*
1-θ=
1
1+K p
H
2
O/p
H
2
Table A2. Values of kinetic constant, k′, overall diffusivity of methane, D
g, and Thiele modulus, Ф, from experimental data for gas composition 2.
| T (°C) | W (g) | FCH40 (L/min†) | W/FCH40 (g.s/mol) | CO - dry (vol%) | CO2 - dry (vol%) | X | pH2 (atm) | 1−θ* (x 10−4) | k′ (s−1) | Deff (cm2/s) | Ф1 |
|---|
| 875 | 25 | 1.40 | 27666 | 1.15 | 0.28 | 0.09 | 0.64 | 53 | 5.71 | 1.25 | 1.35 |
| 875 | 25 | 1.18 | 32838 | 1.34 | 0.28 | 0.10 | 0.65 | 54 | 6.71 | 1.26 | 1.46 |
| 875 | 25 | 0.99 | 39125 | 1.55 | 0.28 | 0.12 | 0.65 | 56 | 6.85 | 1.26 | 1.47 |
| 875 | 25 | 0.80 | 48419 | 1.87 | 0.28 | 0.14 | 0.66 | 58 | 7.01 | 1.26 | 1.49 |
| 875 | 50 | 1.32 | 55030 | 2.12 | 0.29 | 0.16 | 0.66 | 60 | 7.27 | 1.26 | 1.51 |
| 875 | 25 | 0.70 | 55355 | 2.12 | 0.30 | 0.16 | 0.66 | 60 | 7.49 | 1.26 | 1.54 |
| 875 | 25 | 0.57 | 67957 | 2.48 | 0.33 | 0.19 | 0.67 | 63 | 7.51 | 1.26 | 1.54 |
| 875 | 50 | 1.06 | 68556 | 2.59 | 0.31 | 0.20 | 0.67 | 64 | 7.89 | 1.26 | 1.57 |
| 875 | 50 | 0.87 | 83543 | 3.13 | 0.34 | 0.24 | 0.68 | 70 | 7.97 | 1.26 | 1.58 |
| 875 | 25 | 0.46 | 84220 | 2.96 | 0.35 | 0.23 | 0.68 | 68 | 8.62 | 1.27 | 1.64 |
| 875 | 50 | 0.67 | 108467 | 3.84 | 0.37 | 0.30 | 0.69 | 78 | 8.44 | 1.27 | 1.63 |
| 875 | 25 | 0.35 | 110753 | 3.74 | 0.37 | 0.29 | 0.69 | 77 | 9.58 | 1.27 | 1.73 |
| 875 | 50 | 0.52 | 139719 | 4.67 | 0.38 | 0.37 | 0.70 | 91 | 9.47 | 1.27 | 1.72 |
| 875 | 50 | 0.42 | 173108 | 5.42 | 0.37 | 0.43 | 0.72 | 106 | 11.00 | 1.28 | 1.85 |
| 875 | 50 | 0.35 | 207728 | 6.04 | 0.35 | 0.49 | 0.73 | 120 | 12.64 | 1.28 | 1.98 |
| 950 | 25 | 1.68 | 22083 | 2.93 | 0.28 | 0.22 | 0.67 | 30 | 17.13 | 1.38 | 2.22 |
| 950 | 25 | 1.40 | 26438 | 3.34 | 0.29 | 0.25 | 0.68 | 32 | 24.87 | 1.40 | 2.65 |
| 950 | 25 | 1.18 | 31452 | 3.82 | 0.30 | 0.29 | 0.69 | 35 | 26.31 | 1.40 | 2.73 |
| 950 | 25 | 1.01 | 36806 | 4.23 | 0.30 | 0.32 | 0.70 | 37 | 28.27 | 1.41 | 2.82 |
| 950 | 50 | 1.67 | 43739 | 5.09 | 0.30 | 0.40 | 0.71 | 43 | 30.15 | 1.41 | 2.91 |
| 950 | 25 | 0.83 | 44702 | 4.84 | 0.31 | 0.38 | 0.71 | 41 | 34.94 | 1.42 | 3.13 |
| 950 | 25 | 0.69 | 53170 | 5.39 | 0.31 | 0.42 | 0.72 | 46 | 33.50 | 1.41 | 3.07 |
| 950 | 50 | 1.39 | 53498 | 5.51 | 0.30 | 0.43 | 0.72 | 47 | 37.10 | 1.42 | 3.22 |
| 950 | 50 | 1.18 | 62280 | 6.11 | 0.29 | 0.49 | 0.73 | 54 | 37.87 | 1.42 | 3.26 |
| 950 | 25 | 0.53 | 70228 | 6.24 | 0.30 | 0.50 | 0.73 | 56 | 43.02 | 1.42 | 3.47 |
| 950 | 50 | 1.03 | 72461 | 6.49 | 0.29 | 0.52 | 0.74 | 59 | 44.49 | 1.42 | 3.52 |
| 950 | 50 | 0.83 | 89369 | 7.13 | 0.28 | 0.59 | 0.75 | 71 | 46.94 | 1.42 | 3.62 |
| 950 | 25 | 0.41 | 89931 | 6.96 | 0.29 | 0.57 | 0.74 | 68 | 55.92 | 1.43 | 3.94 |
| 950 | 25 | 0.35 | 105680 | 7.32 | 0.28 | 0.61 | 0.75 | 75 | 53.32 | 1.43 | 3.85 |
| 950 | 50 | 0.59 | 127689 | 8.05 | 0.28 | 0.68 | 0.76 | 99 | 59.22 | 1.43 | 4.06 |
| 950 | 50 | 0.46 | 163713 | 8.53 | 0.28 | 0.74 | 0.77 | 124 | 77.05 | 1.43 | 4.62 |
| 950 | 50 | 0.35 | 213575 | 8.88 | 0.28 | 0.78 | 0.78 | 152 | 96.21 | 1.44 | 5.16 |
| 1050 | 25 | 1.54 | 23544 | 5.20 | 0.14 | 0.39 | 0.71 | 17 | 45.43 | 1.57 | 3.39 |
| 1050 | 25 | 1.40 | 26600 | 5.78 | 0.28 | 0.46 | 0.72 | 20 | 89.88 | 1.60 | 4.72 |
| 1050 | 25 | 1.18 | 31565 | 6.27 | 0.28 | 0.50 | 0.73 | 22 | 105.92 | 1.61 | 5.11 |
| 1050 | 25 | 0.94 | 38561 | 6.67 | 0.14 | 0.53 | 0.73 | 23 | 118.11 | 1.61 | 5.39 |
| 1050 | 50 | 1.68 | 43989 | 7.19 | 0.00 | 0.56 | 0.74 | 25 | 122.46 | 1.61 | 5.49 |
| 1050 | 50 | 1.40 | 52698 | 7.76 | 0.00 | 0.62 | 0.75 | 29 | 131.38 | 1.62 | 5.68 |
| 1050 | 25 | 0.64 | 54319 | 7.59 | 0.00 | 0.60 | 0.75 | 28 | 154.47 | 1.62 | 6.15 |
| 1050 | 50 | 1.18 | 62643 | 8.20 | 0.00 | 0.67 | 0.76 | 34 | 146.83 | 1.62 | 6.00 |
| 1050 | 25 | 0.51 | 70617 | 8.29 | 0.14 | 0.69 | 0.76 | 39 | 179.25 | 1.62 | 6.62 |
| 1050 | 50 | 1.02 | 72665 | 8.51 | 0.00 | 0.70 | 0.76 | 39 | 204.31 | 1.63 | 7.06 |
| 1050 | 25 | 0.41 | 84866 | 8.79 | 0.00 | 0.73 | 0.77 | 44 | 201.85 | 1.63 | 7.02 |
| 1050 | 50 | 0.84 | 87842 | 8.89 | 0.00 | 0.74 | 0.77 | 46 | 227.83 | 1.63 | 7.45 |
| 1050 | 25 | 0.35 | 102914 | 8.92 | 0.14 | 0.77 | 0.78 | 53 | 238.45 | 1.63 | 7.62 |
| 1050 | 50 | 0.58 | 127300 | 9.39 | 0.00 | 0.80 | 0.78 | 61 | 275.77 | 1.63 | 8.20 |
| 1050 | 50 | 0.45 | 164089 | 9.61 | 0.00 | 0.83 | 0.79 | 71 | 315.43 | 1.63 | 8.76 |
| 1050 | 50 | 0.35 | 211178 | 9.62 | 0.00 | 0.83 | 0.79 | 72 | 365.94 | 1.63 | 9.43 |
*
1-θ=
1
1+K p
H
2
O/p
H
2