Abstract
To clarify the relaxation behavior of compressive residual stress during the first push and pull loading cycle, an in situ X-ray stress measurement method was formulated, in which a fine particle peening-treated hourglass-shaped specimen was fixed on an axial-loading fatigue testing machine, and the surface stress of the specimen—which is the sum of applied stress and residual stress—was directly measured via X-ray diffraction without removing the specimen from the testing machine. A noticeable relaxation in compressive residual stress occurred under the first compressive loading process, and slight relaxation was observed then onward. During the first compressive loading, the surface stress decreased almost linearly as the applied compressive stress increased; however, when the stress exceeded a certain threshold value, the relation between the applied stress and the surface stress deviated from the linear relation. This threshold value is important with regard to compressive residual stress relaxation. Furthermore, the relaxation behavior during the first compressive loading process can be explained by a master diagram that shows the relationship between the applied stress and the stress measured via X-ray diffraction. The diagram consistently shows that with an increase in the applied compressive stress, there is an increase in the amount of relaxed residual stress.
1. Introduction
Despite the progress of science and technology research in metallurgy, accidents caused by metal fatigue continue to occur. One of the reasons for this is the environment in which the machines and structures are used becoming more severe every year. Thus, to ensure the safety of machines and structures that are intended to be used for a long period of time, it is necessary to improve the fatigue properties of the component parts. To improve the fatigue strength of steel, it is effective to suppress fatigue crack propagation by inducing compressive residual stress on the surface. However, it is known that compressive residual stress is relaxed by cyclic loading.1,2,3,4,5,6,7,8,9,10,11,12,13,14,15) Therefore, to improve fatigue properties, it is necessary to induce high and stable compressive residual stress. For this purpose, it is important to reveal the factors that strongly affect the residual stress relaxation and to clarify at which stage of the fatigue process the residual stress relaxation occurs.
Kodama3) reported that compressive residual stress on a steel surface induced by shot peening is notably relaxed during the first cycle of fatigue loading and changes logarithmically after the second cycle. Kodama concluded that the reason for the relaxation in the first cycle is that compressive loading stress is superposed on the compressive residual stress, and the value of the superposed stress exceeds the yield stress of the surface layer. Avilés et al.12) studied the effects of shot peening and low-plasticity burnishing on the fatigue strength of Ni–Cr–Mo alloy steel in view of compressive residual stress relaxation. They reported that the compressive residual stress is rapidly relaxed during the initial load cycle and stabilized after a certain number of cycles, and that the residual stress value after release is almost equal to the difference between the 0.2% proof stress and the loading stress of the material. The present authors13) investigated the effect of specimen hardness and shot particle hardness on the fatigue properties and the residual stress. We found that the improvement in fatigue properties by fine particle peening was more pronounced in a high-hardness specimen, and that this was due to the high compressive residual stress remaining after cyclic stress loading. Yonezawa et al.14) applied ultrasonic impact treatment to the end of welded joints of steels with three different hardnesses and investigated the residual stress relaxation behavior during cyclic tensile-tension and compression-compression loading. The results clarified that the amount of residual stress relaxation depends not only on the magnitude of the applied stress and the loading conditions but also on the yield stress of the material. Furthermore, they reported that the amount of residual stress relaxation under cyclic tensile-tension loading was dominated by the ratio of the maximum stress to the yield stress of the material.
The results of these papers indicate that the relaxation of compressive residual stress depends on the conditions of the surface treatment, the mechanical properties of the treated material, and the number of the cyclic stress applied, but in all cases, it is remarkable at the very beginning of the fatigue process. If the relaxation behavior of residual stress during the initial fatigue process can be evaluated in a quantitative manner, this will contribute to the extraction of factors controlling the fatigue properties of surface-treated materials. Arakawa et al.16) reported that the fatigue limit of materials with compressive residual stress on the surface can be estimated by using a modified Goodman diagram considering the shakedown of the surface compressive residual stress layer.
To investigate the relaxation behavior of compressive residual stress in the initial fatigue process, it is important to clarify the stress level at which the relation begins during the first cycle of cyclic tensile-compressive stress loading. Recently, in situ X-ray diffraction has been used to evaluate the stress state on the surface of a material by irradiating the specimen with X-rays under loading.17,18,19) For example, Wang et al.19) investigated the stress-strain relationship of the surface layer of shot-peened Ni–Al bronze by in situ X-ray diffraction. They also measured the change in residual stress at the beginning of the fatigue process (30 cycles). Using this method, the change in residual stress at the specimen surface during a single cycle of the fatigue process can be measured in detail, and the relaxation behavior of residual stress can be investigated in more detail. However, few studies have undertaken the detailed measurement of residual stress change during a single cycle of fatigue loading. Until now, the size of the specimen and the testing machine was limited to allow them to fit into an X-ray diffractometer. In recent years, however, advances in analytical equipment have enabled the development of portable X-ray diffractometers that can be used to analyze the surface of practical components.
In this study, we developed a residual stress measurement method that can measure the stress on the specimen surface while the specimen is fixed on an axial-loading fatigue testing machine and subjected to stress. The proposed method was used to measure the stress change at the specimen surface during a single cycle of tensile-compressive cyclic stress and clarify the relaxation behavior of residual stress during the fatigue process. Based on the results obtained, a method to evaluate the characteristics of compressive residual stress relaxation behavior during the fatigue process was proposed.
2. Experimental Methodology
2.1. Preparation and Evaluation of Specimens
The material used was carbon steel (JIS S45C) with tempering (820°C, 50 min, WQ; 650°C, 60 min, WC). Table 1 shows the chemical composition and Table 2 shows the mechanical properties. The material was machined to the configuration shown in Fig. 1, and the surface of the specimen was polished with emery paper (#100 to #600), and then subjected to fine particle peening (FPP) to introduce residual stress (FPP series). The conditions of FPP are shown in Table 3. FPP was performed while the specimen was mounted on a small lathe and rotated. In addition, to prepare specimens with no compressive residual stress, peened specimens were annealed in a vacuum furnace (temperature rising for 2 h to 600°C and held for 2 h) after FPP (FPP+An series).
Table 1. Chemical composition of S45C steel (mass%).
| C | Si | Mn | P | S | Cu | Ni | Cr | Fe |
|---|
| 0.47 | 0.21 | 0.75 | 0.015 | 0.014 | 0.12 | 0.06 | 0.14 | Bal. |
Table 2. Mechanical properties of medium carbon steel.
| Yield strength | Tensile strength | Elongation | Reduction of area |
|---|
| 715 MPa | 812 MPa | 18.5% | 60.5% |
Table 3. Fine particle peening conditions.
| Particle | High-speed tool steel |
| Particle diameter | 125–150 µm |
| Pressure | 0.6 MPa |
| Peening time | 30 s |
| Distance between the nozzle and the specimen | 200 mm |
Residual stress was measured by an X-ray diffraction method using an LXRD system (PROTO Manufacturing K.K., LXRD). The measurement was carried out with the quasi-side inclination method using a Cr tube and a collimator with a diameter of 1.0 mm. The residual stress values were calculated by the sin2ψ method. The residual stress distribution in the depth direction was also measured while the specimen surface was successively removed by electropolishing. Surface roughness was measured using a laser microscope.
Fatigue tests were carried out using a servo-hydraulic tension-compression test machine under axial loading with a stress ratio R of −1. The test frequency was 20 Hz, and the test was stopped if the specimen was not broken by the 107th cycle.
2.2. In situ X-ray Stress Measurement of Specimen Surface
In situ X-ray stress measurements were conducted using a servo-hydraulic tension-compression test machine and a portable type X-ray residual stress measurement machine (Pulstec Industrial Co., Ltd., μ-360s). A specimen was fixed on a fatigue test machine, and the X-ray residual stress measurement machine was placed as shown in Fig. 2 to measure the stress on the specimen surface under loading. Table 4 shows the conditions for stress measurement. In this study, a collimator with a diameter of 0.3 mm was used, considering the shape of the specimen. The stress values were calculated by the cosα method. The stress value on the specimen surface measured by X-rays is equivalent to the sum of the residual stress and the stress under load. Therefore, this method indirectly measures the value of residual stress in the stressed state. The applicability of this measurement method was examined using FPP+An specimens, which were annealed at 600°C for 4 h after FPP treatment to remove residual stress. The specimens were fixed in a fatigue testing machine, and the stress values on the specimen surface were measured by X-rays while the loading stress was varied in the range from −500 MPa to 500 MPa, and the relationship between the stress values and the loading stress was examined.

Table 4. Stress measurement conditions.
| Measurement method | cosα method |
| Tube voltage | 30 kV |
| Tube current | 1.5 mA |
| Collimator diameter | 0.3 mm |
| X-ray irradiation angle | 35° |
| X-ray irradiation time | 120 s |
| Characteristic X-ray | Cr-Kα |
| Diffraction plane | Ferrite 211 |
| X-ray elastic constant | 175 GPa |
The following procedure was used to investigate how the residual stress changes during one cycle of the fatigue process. The specimens were mounted in a fatigue testing machine, and the stress values on the specimen surface were measured by X-rays under no load. In this study, the stress value measured at zero loading stress was defined as the initial residual stress value. After that, the surface stress was measured by X-rays in one cycle of fatigue loading by changing the loading stress in a stepwise manner. The stress amplitudes were 300, 400, and 500 MPa; the stress ratio was R = −1; and all loading started from the compressive direction. The measurements were performed at the stress cycles of 1, 2, 3, 5, 10, 102, 103, 104, 105, 106, and 107. If the specimen fractured before the 107 cycles, the test was stopped at that time.
3. Results and Discussion
3.1. Results of Residual Stress Distributions and Fatigue Tests
Figure 3 shows the residual stress distributions of the FPP series and FPP+An series. The figure shows that about 300 MPa of compressive residual stress was generated at the surface of FPP series specimens. In contrast, the residual stress generated in the FPP+An series specimen was about −30 MPa, indicating that the compressive residual stress was removed by annealing. The arithmetic mean roughness Ra of the specimen surface was 3.5±0.5 μm for FPP and 3.7±0.8 μm for FPP+An (n = 4, mean±SD), indicating similar values. Therefore, in this study, the surface roughness had no effect on the stress measurement.
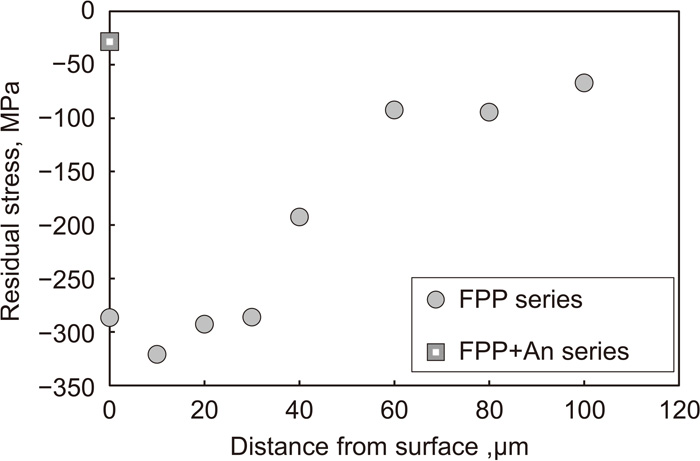
Figure 4 shows an S-N diagram for the FPP series. The figure shows that the fatigue life tended to increase as the loading stress value decreased, and the specimen did not fracture at the stress amplitude σa of 300 MPa. In the figure, the plots with an asterisk (*) show the results of the specimens with interrupted fatigue tests for in situ X-ray stress measurements. From this figure, the interruption of the fatigue test for the in situ X-ray stress measurement does not affect the fatigue life.
3.2. Validity of in situ X-ray Stress Measurement
The applicability of in situ X-ray stress measurement was examined using the FPP+An series, in which compressive residual stress was removed. Figure 5 shows the results of the in situ X-ray stress measurement for the FPP+An series. The vertical axis of the figure shows the stress value at the surface the specimen measured by X-ray diffraction, and the horizontal axis shows the stress applied to the specimen. The range of applied stress in the experiment was −500 MPa to 500 MPa. The results in the figure correspond to the stress change behavior during the first cycle of the fatigue test at a stress amplitude of 500 MPa. A strain gauge was used to confirm that plastic deformation does not occur under the stress loading condition. A linear relationship between the stress value measured by X-rays and the applied stress value was observed. The slope of the plot in the figure was calculated by the least-squares method, and the value was 0.9.

In the case of stress measurement by X-ray diffraction, the measured stress is the average value of individual grains in the irradiated area. Therefore, the measured value contains the statistical uncertainty inherent in stress measurement by X-ray diffraction. In this study, the recommended value of 175 GPa20) was used as the X-ray elastic constant to calculate the stress, but this value varies depending on the composition of the material and the volume ratio of the ferrite phase. In addition, the surface irradiated by X-rays is a curved surface, and unevenness due to FPP also exists.
Despite these uncertainties in the measurement, the slope of Fig. 5 is 0.9, and the error is about 10%. Therefore, it was concluded that the stress on the specimen surface could be measured with a reasonable reliability by the in situ X-ray stress measurement setup used in this study.
3.3. Relaxation Behavior of Compressive Residual Stress during First Cycle of Loading
To investigate how the compressive residual stress induced by FPP changes during the first cycle of fatigue loading, in situ X-ray stress measurements of the FPP series were carried out by changing the loading stress in a stepwise manner under a stress amplitude of 500 MPa. Figure 6 shows the measurement results for the first cycle. The initial residual stress value of this specimen was −429 MPa, which is plotted on the vertical axis in the figure. This value is different from the value shown in Fig. 3. This is mainly because the path length and penetration depth of the X-rays are different between the residual stress measurements by the sin2ψ and cosα methods, although the measured crystal planes are the same. In situ X-ray stress measurements were performed on the FPP series by increasing the compressive stress by 20 MPa, and the results are plotted with  symbols. From this figure, the stress value measured by X-rays changes linearly with the increase of the compressive applied stress up to about 180 MPa and the surface stress of −600 MPa. Since the stress on the specimen surface measured by X-ray diffraction is the sum of the loading stress and the residual stress, this result indicates that there is no change in the value of the residual stress.

However, the linear relationship between them begins to break down when the compressive applied stress exceeds −200 MPa and the surface stress exceeds −600 MPa. This indicates that the compressive residual stress starts to be relaxed by the compressive stress loading. Furthermore, when the compressive applied stress was increased to 500 MPa, the stress on the specimen surface measured by X-rays was −748 MPa. This indicates that the compressive residual stress, which was initially −429 MPa, decreased to −248 MPa at one-quarter cycle of the fatigue loading. Because this phenomenon was not observed in the FPP+An series (Fig. 5), the nonlinear relationship shown in Fig. 6 is a phenomenon unique to specimens with compressive residual stress.
When the compressive applied stress is decreased, the stress value measured by X-rays increases almost linearly with the applied stress (plotted with  in Fig. 6). Furthermore, in the process of increasing tensile stress (plotted with
  ) and decreasing tensile stress (plotted with
  ), the stress at the surface measured by X-rays changes linearly with the applied stress. As a result, the residual stress value at the end of the first cycle of fatigue loading was −205 MPa, and the amount of compressive residual stress relaxed was 224 MPa.
To discuss the effect of loading stress on the relaxation behavior of compressive residual stress, the same experiment was carried out by varying the loading stress amplitude. Figure 7 shows the results of in situ X-ray stress measurements at a stress amplitude of 400 MPa. As in the case of a stress amplitude of 500 MPa (Fig. 6), the linear relationship between the applied stress and the surface stress begins to break down at a compressive applied stress of about 180 MPa and a surface stress value exceeding −600 MPa. In the process of unloading of compressive stress and loading and unloading of tensile stress, the relation is almost linear. The initial residual stress of the specimen was −394 MPa, the compressive residual stress value at the end of the first cycle was −280 MPa, and the amount of compressive residual stress released was 114 MPa. Figure 8 shows the results of the same experiment with a stress amplitude of 300 MPa. As can be seen from the figure, there is an almost linear relationship between the applied stress and the surface stress measured by X-rays in all processes of compression and tension. These results indicate that the change behavior of the surface stress measured by X-rays depends on the applied stress amplitude. When the loading direction is reversed, the measurement data exhibit a discontinuity. This is thought to be caused by the method to fix the specimen in the equipment. When the specimen is held by a screw, as in this study, the nut is usually fastened while a tensile load is applied to avoid backlash. However, this fastening procedure could not be performed in our experiment because the test was started with a compressive load. Therefore, when the load was reversed, especially when the test force was 0 N (no load), the fastener became unstable (allowing the specimen to move), and the resulting measurement results are discontinuous.


We now focus on the results for stress amplitudes of 500 and 400 MPa, where the relaxation of residual stress occurred during the compression loading process. In both cases, the residual stress started to be relaxed when the surface stress measured by X-rays exceeded −600 MPa. In contrast, for the stress amplitude of 300 MPa, where the residual stress was hardly released, the stress measured by X-rays did not exceed −600 MPa. The results indicate that the threshold value for the relaxation of residual stress in the FPP series is about −600 MPa, as measured by X-rays. Zhuang et al.5) studied the residual stress relaxation behavior of nickel alloys with different cold working rates and proposed a residual stress relaxation model that considers the yield point and Bauschinger effect, which change with cold working. However, in this study, although fatigue tests were conducted under conditions where no macroscopic yielding occurred, the threshold at which compressive residual stress relaxation occurred could be clearly measured based on in situ X-ray stress measurements.
It is generally considered that the relaxation of residual stress occurs due to the yielding of the residual stress layer. Therefore, this threshold is related to the yielding behavior of the specimen surface. To clarify this point, compression tests were conducted on FPP specimens to investigate the relationship between nominal stress and strain. The results are shown in Fig. 9, which shows that the linear relationship between nominal stress and strain is broken at about −600 MPa because of the yielding of compression. Therefore, the threshold value at which the relaxation of compressive residual stress occurs corresponds to the stress value at which the specimen begins to yield during compression. This suggests that it may be possible to discuss whether the relaxation of residual stress occurs by comparing the stress measured by X-rays (sum of loading stress and residual stress) with the threshold value. Figure 10 summarizes the amount of compressive residual stress released at the end of the first cycle based on the results of Figs. 6, 7, and 8. From the figure, the amount of compressive residual stress relaxed increases with the increase in stress amplitude. This means that the applied stress has a great influence on the amount of relaxation of residual stress, which indicates that the magnitude of applied stress is an important factor to be considered when discussing the relaxation behavior of compressive residual stress in the fatigue process.

The previous section described the dependence of the relaxation of compressive residual stress on the applied stress in the first cycle. In this section, the effect of the number of cycles on the relaxation behavior of compressive residual stress is investigated based on in situ X-ray stress measurements after the second cycle. Figure 11 shows the results of in situ X-ray stress measurements after the second cycle for the FPP series (σa = 500 MPa) which is same specimen shown in Fig. 6. From the figure, the relationship between the applied stress and surface stress values is almost linear in all cycles, and there is no significant deviation from the linear relationship as observed in the compressive loading process of the first cycle.

However, in the previous section, it was shown that the threshold value for the relaxation of compressive residual stress in the FPP series is about −600 MPa. As seen in the results of the 2nd to 10th cycles shown in Figs. 11(a)–11(d), the stress value measured by X-rays reached −700 MPa when the minimum stress was applied, exceeding the threshold value of −600 MPa. As seen in Figs. 11(a)–11(f), although the linear relationship between the applied stress and the surface stress is maintained, the plot gradually moves upward as the number of cycles increases.
Figure 12 shows the results of the change in the residual stress during the fatigue process. The residual stresses in the figure were measured by X-rays without loading while the specimen was mounted in the fatigue testing machine. Regardless of the magnitude of the loading stress, the compressive residual stress value decreases significantly in the 1st cycle and then changes slowly until the 10th cycle. After that, when the stress amplitude is 400 MPa and 300 MPa, there is almost no relaxation of residual stress, whereas when the stress amplitude is 500 MPa, the compressive residual stress continues to relax gradually until failure.

These results suggest that the microstructural changes that lead to the relaxation of residual stress may occur after the second cycle. Martin et al.21) studied the microstructural changes in shot-peened carbon steel during the fatigue process in detail using transmission electron microscopy, and found that the dislocation arrangement due to cyclic stress loading is a factor that leads to the relaxation of compressive residual stress. Therefore, to clarify the relaxation behavior of residual stress during the fatigue process after the second cycle, it is necessary to study the microstructure change in detail.
In addition to microstructural changes, the relaxation of residual stress is also caused by changes in the constraint state due to crack initiation and propagation. For example, in the case of the specimen with a stress amplitude of 300 MPa shown in Fig. 12, the residual stress relaxed rapidly after the number of cycles exceeded 106. To clarify this reason, we observed the surface of the specimen after 107 cycles of the applied stress of 300 MPa. However, the presence of fatigue cracks could not be observed.
3.5. Investigation of Factors Governing Residual Stress Relaxation
To summarize the results of the experiments and the previous literature, we can conclude that it is important to examine the change behavior of residual stress during the first cycle of compressive stress loading to evaluate the relaxation behavior of compressive residual stress introduced by surface modification. Figure 13 summarizes the results of the first cycle of compressive stress loading from the in situ X-ray stress measurements conducted in this study. The horizontal axis is the sum of the loading stress and the initial residual stress because the magnitude of the initial residual stress differs from specimen to specimen. Furthermore, the results of in situ X-ray stress measurement of FPP specimens under compressive stress up to −800 MPa are indicated by ◇, and the results of FPP+An specimens shown in Section 3.2 are indicated by ●. The figure shows that the experimental data are within a narrow band for all specimens. This result indicates that the factor controlling the relaxation of compressive residual stress is not the applied stress, but the sum of the applied stress and the initial residual stress. In this section, we propose an approach to evaluate the relaxation behavior of residual stress by considering Fig. 13 as a master curve.

Figure 14 schematically shows the change in the stress value on the specimen surface during the initial compressive loading process, corresponding to the third quadrant of the experimental results shown in Figs. 6, 7, and 8. This figure shows that when the applied stress is relatively small, there is a linear relationship between the applied stress and the surface stress measured by X-rays, but when the loading stress exceeds a certain threshold, the linear relationship breaks down. In the unloading process after the minimum stress is reached, the relationship between the two is linear. Further, the difference between the initial surface residual stress and the surface stress when the loading stress is zero again is the amount of compressive residual stress released in the initial compression process.

In Section 3.3, it was mentioned that the amount of residual stress relaxed depends on the magnitude of the loading stress. Figure 14 describes this phenomenon. The figure shows that (i) for loading stresses within the range where the relationship between the two does not deviate from linear (below σC,th), the initial compressive residual stress is hardly released, and (ii) as the applied compressive stress increases from σC1 to σC2, the amount of relaxation of compressive residual stress increases. This master curve changes depending on the type of material, heat treatment, and method of introducing the residual stress, but if this curve can be obtained accurately, the amount of compressive residual stress relaxation can be estimated quantitatively without conducting fatigue tests.
As is already known, compressive residual stress contributes to the improvement of fatigue properties, so it is very important to understand the stability of compressive residual stress against cyclic stress. In this study, the stress on the surface of specimens during the first cycle of compression was measured by X-rays to obtain a master curve, and it was shown that it is possible to evaluate the relaxation of compressive residual stress during the fatigue process. In the future, the relaxation behavior of compressive residual stresses introduced into base materials with different strength levels will be investigated using in situ X-ray stress measurements to clarify the characteristics of stable compressive residual stresses that are effective for improving fatigue properties.
4. Conclusion
Introducing compressive residual stress is one of the most effective ways for improving the fatigue properties of steel. However, because compressive residual stress is unstable under cyclic loading, it is necessary to clarify its relaxation behavior. In this study, a method to use X-rays to measure the surface stress of loaded specimens was developed. Then, the method was used to investigate the stress change on the specimen surface during one cycle of loading for specimens in which the compressive residual stress was introduced by fine particle peening. The relaxation behavior of the compressive residual stress during the fatigue process was studied and discussed. The conclusions can be summarized as follows:
(1) By measuring the stress on the surface of loaded specimens using in situ X-ray stress measurement, it is possible to understand the behavior of residual stress change during a single cycle of fatigue loading. Therefore, by using this method, it is possible to study the relaxation behavior of residual stress in more detail than before.
(2) As the compressive load increases, the surface stress measured by X-rays decreases almost linearly, but the relationship deviates from linearity when a certain threshold is exceeded. This threshold is equivalent to the point at which the relaxation of compressive residual stress begins and is an important factor in discussing the relaxation of residual stress.
(3) The relaxation of compressive residual stress occurred notably under compressive stress loading in the first cycle of the fatigue process. This relation behavior can be expressed by a master curve using the sum of the loading stress and the initial residual stress as parameters. By using this curve, the experimental results, in which the amount of residual stress relaxation increases with the increase of loading stress, can be explained without contradiction.
Acknowledgments
The authors would like to thank Pulstec Industrial Co., Ltd. for lending us portable X-ray residual stress measurement equipment (μ-360s) to carry out this study.
References
- 1) T. Nishihara, S. Taira, T. Mitani and T. Morimoto: Trans. Jpn. Soc. Mech. Eng., 14 (1948), 107 (in Japanese). https://doi.org/10.1299/kikai1938.14.48-1_107
- 2) T. Nishihara, S. Taira, H. Tsuneda and H. Ochiai: Trans. Jpn. Soc. Mech. Eng., 18 (1952), 112 (in Japanese). https://doi.org/10.1299/kikai1938.18.68_112
- 3) S. Kodama: J. Jpn. Soc. Mech. Eng., 75 (1972), 1026 (in Japanese). https://doi.org/10.1299/jsmemag.75.642_1026
- 4) S. Yonetani and S. Isoda: Tetsu-to-Hagané, 75 (1989), 1362 (in Japanese). https://doi.org/10.2355/tetsutohagane1955.75.8_1362
- 5) W. Z. Zhuang and G. R. Halford: Int. J. Fatigue, 23 (2001), 31. https://doi.org/10.1016/S0142-1123(01)00132-3
- 6) D. Yonekura, J. Noda, J. Komotori, M. Shimizu and H. Shimizu: Trans. Jpn. Soc. Mech. Eng. A, 67 (2001), 1155 (in Japanese). https://doi.org/10.1299/kikaia.67.1155
- 7) M. A. S. Torres and H. J. C. Voorwald: Int. J. Fatigue, 24 (2002), 877. https://doi.org/10.1016/S0142-1123(01)00205-5
- 8) J. C. Kim, S. K. Cheong and H. Noguchi: Int. J. Fatigue, 56 (2013), 114. https://doi.org/10.1016/j.ijfatigue.2013.07.001
- 9) T. Ochi, S. Kozawa and M. Kubota: Tetsu-to-Hagané, 97 (2011), 486 (in Japanese). https://doi.org/10.2355/tetsutohagane.97.486
- 10) S. Kikuchi, Y. Nakamura, K. Nambu and M. Ando: Mater. Sci. Eng. A, 652 (2016), 279. https://doi.org/10.1016/j.msea.2015.11.076
- 11) S. Kikuchi, R. Yakura, N. Fujitsuna, H. Takaoka, T. Ikegami, M. Matsuda, T. Miura, A. Ueno and T. Sakai: J. Soc. Mater. Sci., Jpn., 66 (2017), 893 (in Japanese). https://doi.org/10.2472/jsms.66.893
- 12) A. Avilés, R. Avilés, J. Albizuri, L. Pallarés-Santasmartas and A. Rodríguez: Int. J. Fatigue, 119 (2019), 338. https://doi.org/10.1016/j.ijfatigue.2018.10.014
- 13) S. Kikuchi, Y. Hirota and J. Komotori: J. Soc. Mater. Sci., Jpn., 60 (2011), 547 (in Japanese). https://doi.org/10.2472/jsms.60.547
- 14) T. Yonezawa, H. Shimanuki and T. Mori: Q. J. Jpn. Weld. Soc., 37 (2019), 44 (in Japanese). https://doi.org/10.2207/qjjws.37.44
- 15) S. Kikuchi, K. Nambu, Y. Nakamura and H. Akebono: Tetsu-to-Hagané, 106 (2020), 765 (in Japanese). https://doi.org/10.2355/tetsutohagane.TETSU-2020-013
- 16) J. Arakawa, T. Hanaki, Y. Hayashi, H. Akebono and A. Sugeta: Fatigue Fract. Eng. Mater. Struct., 43 (2020), 211. https://doi.org/10.1111/ffe.13097
- 17) M. Qin, V. Ji, Y. N. Wu, C. R. Chen and J. B. Li: Surf. Coat. Technol., 192 (2005), 139. https://doi.org/10.1016/j.surfcoat.2004.05.026
- 18) L. Xie, Y. Wen, K. Zhan, L. Wang, C. Jiang and V. Ji: J. Alloy. Compd., 666 (2016), 65. https://doi.org/10.1016/j.jallcom.2016.01.119
- 19) C. Wang, C. Jiang, Y. Zhao, M. Chen and V. Ji: Appl. Surf. Sci., 420 (2017), 28. https://doi.org/10.1016/j.apsusc.2017.05.108
- 20) JSMS Committee on X-ray Study of Mechanical Behavior of Materials, ed.: Standard for X-Ray Stress Measurement by The cos α Method -Ferritic Steels-, JSMS, Kyoto, (2020), 22 (in Japanese).
- 21) U. Martin, I. Altenberger, B. Scholtes, K. Kremmer and H. Oettel: Mater. Sci. Eng. A, 246 (1998), 69. https://doi.org/10.1016/S0921-5093(97)00755-7


