Abstract
Knowledge of the distribution of metal chloro complexes in hydrochloric acid solutions is fundamental for constructing an efficient hydrometallurgical process. The condition of chemical species in the aqueous phase is important for understanding adsorption reactions as well as the properties of functional groups. The distribution of ferric aqua and chloro complexes was determined by fitting thermodynamic models to a series of UV-vis absorption spectra. In addition, X-ray absorption spectra of individual species were obtained by decomposition of a series of raw spectra by the distribution of ferric aqua and chloro complexes, and each structure was determined. Analyses using the UV-vis and X-ray absorption spectra complement each other and offer more reliable results than the conventional methods. Five ferric aqua and chloro complexes of [FeIII(H2O)eq4(H2O)ax2]3+, [FeIIIClax2(H2O)eq4]+, [FeIIICleq3(H2O)ax2]0, [FeIIICl4]–, and [FeIIICleq4Clax2]3– were observed and the thermodynamic parameters of the formation reactions were successfully determined.
1. Introduction
Understanding the distribution of metal aqua and chloro complexes in chloride aqueous solutions is important for building an efficient hydrometallurgical process. Recently, Billards et al.1) mentioned that understanding chemical species in aqueous phase is as important as the development of a functional group to adsorb concerned solutes.
Distributions of metal chloro complexes have been investigated since the concept of complexes was published.2) In the early stage, the distributions of metal chloro complexes were discussed qualitatively, and then quantitative analysis developed with the progress and the improvement of UV-vis absorption spectroscopy, which reflects the chemical condition of solutes in aqueous solutions.3) Then X-ray absorption spectroscopy enabled discussion of the geometric configuration of complex species.4) There lacked one other tool, which was factor analysis based on statistical work.
In recent years, the above three tools were combined to investigate the distributions of metal chloro complexes, and attained great advantages compared with methodologies used decades ago.3) However, a preconception reported in the literature sometimes mislead the direction of research and its conclusions. Analysis must be conducted statistically, eliminating preconceptions.
Fe is one of the most important base metals for modern society, and it is a main component of steels and an impurity for other metals or alloys. The distribution of ferric aqua and chloro complexes in hydrochloric acid solutions is required basic knowledge, not only for purification of Fe but also for removal of Fe using the hydrometallurgical route. High purity metals are indispensable for revealing the nature of metallic elements.5,6) Understanding the intrinsic properties of metals contributes to the development of novel functional materials.
In addition, the structure of ferric aqua and chloro complexes is important issue for understanding the corrosion in the environment in aqueous solution. Photometry hardly detects what species dissolves into aqueous solution from the surface of materials. On the other hand, X-ray absorption spectroscopy is expected to be able to detect a structure of a chemical species near an electrode, which should be determined by comparison with species in aqueous solution. Knowledge of dissolution species will contribute to understanding the nature of electrochemical reactions involving ferric aqua and chloro complexes.
A wide variety of distributions of ferric aqua and chloro complexes analyzing UV-vis absorption spectra, X-ray absorption spectra, and X-ray diffraction patterns have been reported.7,8,9,10,11,12,13,14,15,16,17,18,19,20) Among them, Liu et al.17) and Uchikoshi20) reported there were five ferric aqua and chloro complex species. They supposed that the coordination numbers of Cl ligands increased one by one starting from zero. There is, however, a possibility that the coordination numbers of Cl consist of non-consecutive numbers as the distribution of cobalt chloro complexes has been reported.21,22,23) Attention must be paid to the combination of the coordination numbers in analysis.
In addition, the analysis of UV-vis absorption spectra might leave ambiguity in the distribution of metal chloro complexes. In order to reduce and eliminate the ambiguity, analysis of X-ray absorption spectra should be combined. Their results complement each other.
One purpose of the present study was to determine the distribution of ferric aqua and chloro complexes in hydrochloric acid solutions using fitting analysis of thermodynamic models to UV-vis and X-ray absorption spectra. Another purpose was to discuss the limitations of the analysis procedure.
2. Experimental Procedure
2.1. Preparation of UV-vis and X-ray Absorption Spectra of Ferric Chloride Aqueous Solutions
Sample solutions were prepared from reagent grade chemicals purchased from FUJIFILM Wako Pure Chemical Corporation and distilled and deionized water with a resistivity greater than 180 kΩ·m, purified by RFD260NC and made by ADVANTEC TOYO KAISHA, LTD. Three series of solutions with different concentrations of ferric species were prepared, as listed in Table 1. In the present study, UV-vis and X-ray absorption spectra (XAS) in the transmission and the fluorescence modes were acquired and different concentrations of the ferric species were prepared for measurement; 358 μmol·dm−3 for UV-vis absorption, 5 mmol·dm−3 and 0.5 mol·dm−3 for XAS measurement in the fluorescence and the transmission modes, respectively. The ferric species and chloride concentrations of sample solutions for UV-vis absorption spectra were determined by chelate titration and neutralization. Those for XAS measurement were determined by the charge of chemical reagents of FeCl3·6H2O and raw hydrochloric acid solution. A XAS sample solution without Cl ion for the transmission mode was prepared using ferric sulfate hydrates, FeIII2(SO4)3(H2O)6~9. An aliquot of sulfuric acid solution was added to prevent hydrolysis.
Table 1. Composition of ferric chloride aqueous solutions for UV-vis and X-ray absorption spectroscopy.
| UV-vis sample solutions* | XAS sample solutions |
|---|
| Fluorescence mode | Transmittance mode |
|---|
| Total Cl, MCl/mol∙dm−3 | Total Fe, MFe/mol∙dm−3 | Total Cl, MCl/mol∙dm−3 | Total Fe, MFe/mol∙dm−3 | Total Cl, MCl/mol∙dm−3 | Total Fe, MFe/mol∙dm−3 | Path length, l/mm |
|---|
| 0.10 | 0.000358 | 0.12 | 0.00500 | 0.00† | 0.500 | 1.0 |
| 0.21 | 0.000358 | 0.84 | 0.00500 | 1.51 | 0.500 | 1.0 |
| 0.47 | 0.000358 | 1.57 | 0.00500 | 2.36 | 0.500 | 1.0 |
| 1.04 | 0.000358 | 2.29 | 0.00500 | 3.23 | 0.500 | 0.5 |
| 1.51 | 0.000358 | 3.02 | 0.00500 | 4.09 | 0.501 | 0.5 |
| 1.96 | 0.000358 | 3.74 | 0.00500 | 4.95 | 0.500 | 0.5 |
| 2.55 | 0.000358 | 4.47 | 0.00500 | 5.82 | 0.501 | 0.5 |
| 2.98 | 0.000358 | 5.19 | 0.00500 | 6.68 | 0.500 | 0.5 |
| 3.45 | 0.000358 | 5.93 | 0.00500 | 7.54 | 0.500 | 0.5 |
| 3.92 | 0.000358 | 6.65 | 0.00500 | 8.40 | 0.501 | 0.5 |
| 4.34 | 0.000358 | 7.38 | 0.00500 | 9.26 | 0.499 | 0.5 |
| 5.00 | 0.000358 | 8.10 | 0.00500 | 10.1 | 0.501 | 0.5 |
| 5.48 | 0.000358 | 8.82 | 0.00500 | 11.0 | 0.500 | 0.5 |
| 6.02 | 0.000358 | 9.55 | 0.00500 | | | |
| 6.45 | 0.000358 | 10.3 | 0.00500 | | | |
| 7.43 | 0.000358 | 11.0 | 0.00500 | | | |
| 8.14 | 0.000358 | | | | | |
| 8.53 | 0.000358 | | | | | |
| 9.01 | 0.000358 | | | | | |
| 9.43 | 0.000358 | | | | | |
| 9.84 | 0.000358 | | | | | |
| 10.3 | 0.000358 | | | | | |
| 10.8 | 0.000358 | | | | | |
*The path length was fixed at 10 mm. †For Fe aqueous species, FeIII2(SO4)3(H2O)6~9 was dissolved in H2O, followed by the addition of aliquot of sulfuric acid solution to avoid hydrolysis.
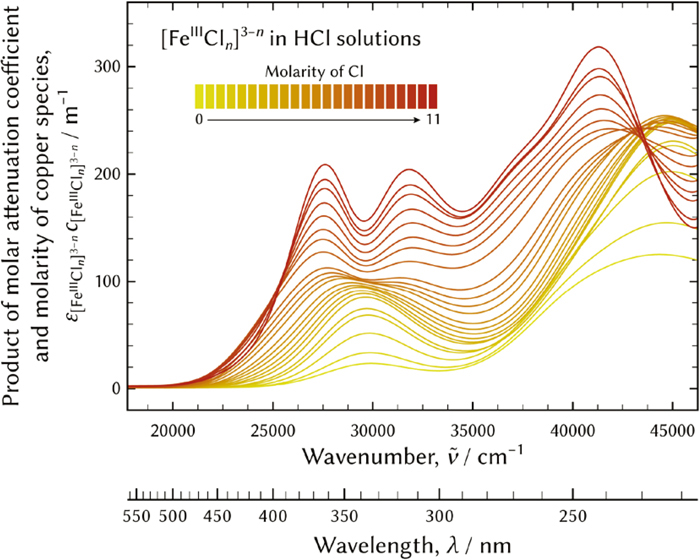
UV-vis absorption spectra were measured using a V-770 Ultraviolet-Visible spectrometer (JASCO Corporation) operating in the dual beam mode with quartz cuvettes with a path length of 10 mm. The measurement was conducted at 25°C and the spectra were averaged from at least five measurements. The spectra were recorded as functions of wavelength from 216 nm to 566 nm in 1 nm increments and the abscissa was converted into wavenumber in the range from 46260 cm−1 to 17730 cm−1 in 90 cm−1 increments. The absorption was interpolated using a cubic spline algorithm.24)
The products of the molar attenuation coefficients of ε and the ferric species molarities of c, a′, that is to say the quotients of absorption (a) divided by the path length (l), were employed for practical analysis. In addition, the absorption was corrected using the following equation according to the Lambert-Beer law, because the molarity of the ferric species deviated due to errors in weighing.
|
εc=
a
′
=
a
l
×
358×
10
-6
c
,
| (1) |
358
μmol·dm
−3 was the average molarity of the ferric species in UV-vis sample solutions.
Figure 1 shows
a′ as functions of wavenumber,
ν˜
The Fe K edge XAS were collected at Photon Factory with a ring energy of 2.5 GeV in Japan. BL-9A and BL-9C were used for the fluorescence mode and the transmission mode, respectively. Sample solutions were filled up in a cell made from rigid vinyl chloride with a 20 mm-diameter window. Polyimide film was pasted on as the window material. The path lengths for the transmission mode were adjusted to acquire appropriate spectra as listed in Table 1. The path length for the fluorescence mode was fixed at 1.0 mm, which provided enough thickness for measurement. The incident X-rays were monochromatized by a silicon double-crystal monochromator and the net planes were (111). I0 and I1 ionization chambers were filled with 70%He/30%N2 and 25%Ar/75%N2, respectively. Signal was detected using a silicon drift detector for the fluorescence mode.
Figure 2 shows X-ray absorption near the edge structure (XANES) (a) and (c), and extended X-ray absorption fine structure (EXAFS) (b) and (d) spectra measured in the fluorescence and the transmission modes, respectively. The spectral characteristics gradually changed with the increase in the molarity of Cl, and the tendencies were quite similar in both modes, although the EXAFS spectra over ~7 Å−1 measured in the fluorescence mode were noisier than those measured in the transmission mode. The similarity in spectral characteristics indicated that the distribution and the structures of the ferric aqua and chloro complexes were consistent even though the molarity of the ferric species was a hundred times more concentrated.
2.2. Analysis Procedure
The analysis procedure conducted in the present study has been described in the literature.20,22,25,26) Therefore, only a brief explanation is given here.
The analysis is based on the Lambert-Beer law represented by the following equations.
|
a
′
v
˜
=
∑
i=0
N
ε
i,
v
˜
c
i
,
A
′
=
C
tr
E,
| (2) |
where the subscript of
ν˜indicate the properties observed at the wavenumber of
ν˜ i is ferric aqua and chloro complexes and
N is the number of the significant species.
Ctr represents a transposed matrix of
C. As expressed by
Eq. (2), absorption spectra can be decomposed into a distribution matrix of
C and a molar attenuation coefficients matrix of
E.
At the beginning, the number of ferric aqua and chloro complexes must be determined, and the novel index of the first derivative test20) was used. The absorption matrix of A′ was decomposed by singular value decomposition and two unitary matrices were obtained. The basis vectors of the significant components had to be smoother than non-significant components. The non-significant components represented experimental errors. The smoothness was evaluated using the sum of the difference quotients of the individual components.
Possible thermodynamic models were built according to the number of significant components. The formation reactions of ferric aqua and chloro complexes and their formation constants of βn could be built as follows.
|
[F
e
III
]
3+
+n
[Cl]
-
=
[F
e
III
C
l
n
]
3-n
,
| (3) |
|
β
n
=
a
[F
e
III
C
l
n
]
3-n
a
[F
e
III
]
3+
a
[Cl]
-
n
=
γ
[F
e
III
C
l
n
]
3-n
m
[F
e
III
C
l
n
]
3-n
γ
[F
e
III
]
3+
m
[F
e
III
]
3+
(
γ
[Cl]
-
m
[Cl]
-
)
n
,
| (4) |
where
a,
γ, and
m are activity, activity coefficient, and molality, respectively. In the solutions, the formation reaction of HCl was also taken into account for the assessment of the distribution. The logarithm of the dissociation constant of HCl was 0.800.
20) Two mass balance and neutrality equations were derived from the relevant formation reactions of [Fe
IIICl
n]
3–n and HCl.
|
m
F
e
II
I
total
=
∑
n
m
[F
e
III
C
l
n
]
3-n
,
| (5a) |
|
m
Cl
total
=
m
[HCl]
0
+
m
[Cl]
-
+
∑
n
n
m
[F
e
III
C
l
n
]
3-n
,
| (5b) |
|
m
[H]
+
+
∑
n
(3-n)
m
[F
e
III
C
l
n
]
3-n
-
m
[Cl]
-
=0,
| (5c) |
Activity coefficients of charged species and neutral species were assessed using the modified Debye-Hückel model of
Eq. (6a)20) and the Sechénow equation of
Eq. (6b),
27) respectively.
|
log
10
γ=-
A
γ
z
k
2
I
1+
B
γ
a
∘
k
I
+
b
γ,HCl
I
+
b
γ
sq
,HCl
+
b
γ
7/2
,HCl
I
7/2
+
Γ
γ
,
| (6a) |
|
log
10
γ
[F
e
III
C
l
3
]
0
=
b
γ,
[F
e
III
C
l
3
]
0
I+
Γ
γ
,
| (6b) |
where
åk is the distance of closest approach for the
k ion and was 4.0 Å, 5.0 Å and 9.0 Å for mono-, di-, and trivalent species, respectively. Among them, only
å[H]+ for proton was 9.0 Å. The explanation of the other terms is provided in supporting information. The distribution of ferric aqua and chloro complexes was assessed using the EQBRM algorithm developed by Anderson and Crerar.
28)
The thermodynamic parameters necessary for assessment were the formation constants of βn in Eq. (4) and the Setchénow coefficient of bγ,[FeIIICl3]0 in Eq. (6b). These parameters were also used as fitting parameters for fitting analysis.
The fitting the thermodynamic models to UV-vis absorption spectra shown in Fig. 1 was carried out as follows.
1. Assessment of a distribution of ferric aqua and chloro complexes, Cβn,
2. Assessment of the molar attenuation coefficients of individual species corresponding to Cβn,
|
E
β
n
=
C
β
n
tr
-1
×
A
′
,
| (7) |
Distorted molar attenuation coefficients were obtained unless Cβn was appropriate.
3. Aβn′ was re-assessed by Cβn × Eβn and compared with the original A′ using R-factor.
|
R=
∑
i
∑
j
(
a
ij
′
-
a
β
n
,ij
)
2
,
| (8) |
where
aij′ and
aβn,ij denote the elements in original
A′ and
Aβn′ corresponding to the fitting parameters derived using
Cβn and
Eβn. The fitting parameters giving a minimum
R-factor were the optimized thermodynamic parameters.
Equation (2) can be applied to any absorption spectra obeying the Lambert-Beer law. Therefore, the series of XAS, X, and those of the individual species, χ, are related as follows.
where
CXAS is the distribution of ferric aqua and chloro complexes in the sample solutions for XAS measurement. The equation can be applied to both XANES and EXAFS spectra, and the spectra of the individual species were acquired. The theoretical model was fitted to the individual EXAFS spectra in
k-space (
k = 3 Å
−1 to 11 Å
−1) using Artemis and FEFF 6L.02.
29,30)
3. Results and Discussion
3.1. The Speciation of Ferric Aqua and Chloro Complexes
The sum of the difference quotients of the individual components was evaluated as a function of the number of components, and is shown in Fig. 3. The slope of the line changes when the number of components is five; therefore, the number of significant components was determined as five.
The maximum coordination number of Cl could be assumed to be six due to the ionic radius estimation,31) because six-coordination was possible (1.366 < rCl−/rFe3+ < 2.414) while the ionic radius ratio was too large to form eight-coordination (rCl−/rFe3+ < 1.366).
|
r
C
l
-
r
F
e
3+
=
167 pm
78.5 pm
=2.127,
when six-coordination is assumed, and
r
C
l
-
r
F
e
3+
=
167 pm
92 pm
=1.815,
when eight-coordination is assumed,
| (10) |
where
rCl− and
rFe3+ are the ionic radius of Cl
– and Fe
3+, respectively. The minimum coordination number must be zero because ferric species could be dissolved in acid solutions without Cl ions. Thus, the possible combinations of the coordination numbers of Cl ligands were the 15 combinations. The combination had to include zero and the maximum had to be less than or equal to six.
Fitting every possible thermodynamic model to UV-vis absorption spectra, the minimum R-factor was obtained with the combination of the (02346) model as shown in Fig. 4. The R-factor of the (02345) model was the second smallest and comparable to that of the (02346) model. FEFF fitting analysis was used not only with the (02346) model but also with the (02345) model.
Table 2 shows the formation reactions and the equilibrium constants of the ferric chloro complexes of the (02346) model. The distribution of ferric aqua and chloro complexes and the molar attenuation coefficients of the individual species of the (02346) model were assessed using the optimized thermodynamic parameters listed in Table 2 and according to Eqs. (2), (3), (4), (5), (6), (7), and are shown in Fig. 5. The chemical formulas in the figure include H2O ligands whose coordination numbers were determined later in the EXAFS analysis section.
Table 2. Logarithm of formation constants for the ferric aqua and chloro complexes.
| Formation reaction | Logarithms of cumulative formation constants, log10βn |
|---|
| [FeIII]3+ + 2[Cl]− = [FeIIICl2]+ | 2.28 |
| [FeIII]3+ + 3[Cl]− = [FeIIICl3]0 | 2.02 |
| [FeIII]3+ + 4[Cl]− = [FeIIICl4]− | 0.25 |
| [FeIII]3+ + 6[Cl]− = [FeIIICl6]3− | −5.50 |
Setchénow coefficient for a neutral species of [FeIIICl3]0, bγ,[FeIIICl3]0 = 0.156.
Coordination of H2O ligands is omitted for simple expression.
The existence range of [FeIII]aq.3+ was narrower than those of the other species. The quantity of [FeIII]aq.3+ decreased rapidly with the increase in Cl molarity and it was negligible in over 2 mol·dm−3 Cl solutions. Contrastingly, [FeIIICl2]+, [FeIIICl3]0 and [FeIIICl4]– existed in a wide range, which was almost equal to the examined concentration range.
The existence range of [FeIIICl4]– corresponds to the adsorption range of the trivalent iron species on a strong base anion-exchanger, which adsorbs in the range over 2 mol·dm−3 Cl.32) The negatively charged ferric chloro complexes form in the range over 4 mol·dm−3 to 6 mol·dm−3 Cl in the literature.17,20) The distribution obtained in the present study agrees with adsorption behavior more than the previous reports.17,20)
The absorption bands of [FeIIICl4]– and [FeIIICl6]3– were different from each other and the rest of the ferric aqua and chloro complexes. This implies that the structures were also very different as well, because the adsorption band reflects the geometry configuration. Furthermore, the structures of [FeIIICl2]+ and [FeIIICl3]0 might have some common characteristics due to similarities in the absorption bands.
3.2. The Structures of Ferric Aqua and Chloro Complexes
The distributions of ferric aqua and chloro complexes in the sample solutions for the transmission and the fluorescence modes must be obtained prior to the assessment of the XANES and the EXAFS spectra of the individual species using Eq. (9a). Those distributions are shown in Fig. 6, and they were assessed using the optimized thermodynamic parameters listed in Table 2. The decomposition results of the raw XANES and EXAFS spectra, namely the pure spectra of the individual species, are shown in Fig. 7.


The compositions of [FeIII]aq.3+ for both the transmission and fluorescence modes were somewhat lower than the others. This implies that the spectrum quality was low and analysis would be less reliable. Therefore, the Fe K edge XAS of the sample solution dissolving FeIII2(SO4)3(H2O)6~9 was acquired for structure analysis of [FeIII]aq.3+ species. In Figs. 7(a) and 7(b), the XANES and the EXAFS spectra of [FeIII]aq.3+ obtained by the decomposition of the raw spectra deviate from the spectrum obtained from the sample solution dissolving FeIII2(SO4)3(H2O)6~9, in which [FeIII]aq.3+ would certainly be formed due to the perfect dissociation of electrolytes in dilute sulfuric acid solutions.10)
The XANES and the EXAFS spectra of [FeIIICleq4Clax2]3– differed in the transmission and the fluorescence modes. The composition of the sample solutions for the transmission mode was somewhat poorer to that for the fluorescence mode. Therefore, the fitting result of [FeIIICleq4Clax2]3– obtained from the fluorescence mode would be more reliable, even though the spectrum is noisier than the other.
Both the EXAFS and XANES spectra of [FeIIIClax2(H2O)eq4]+, [FeIIICleq3(H2O)ax2]+, and [FeIIICl4]– collected in the transmission and the fluorescence modes were consistent. Reliable analysis would be expected for these species.
The results of the FEFF fitting analysis of the (02346) model are shown in Tables 3 and 4, and the illustrations of the fitting analysis are demonstrated in the supporting information. The R-factor between an observed spectrum and a fitted model, the difference of the absorption edge to the assumed model of ΔE, and a Debye-Waller factor of σ2 were used as indices to determine whether an assumed model was appropriate or not. These indices have their own recommended ranges.30)
|
R≤0.05,
|
ΔE
|<10,
0.002≤
σ
2
≤0.03.
| (11) |
The model was inappropriate if any of the indices was out of the ranges. Analysis of the (02345) model was conducted as well. FEFF fitting analysis of [Fe
IIICl
5] failed, thus the (02345) model was discarded.
Table 3. The results of the FEFF fitting to the resultant EXAFS spectra of the individual ferric aqua and chloro complexes in the hydrochloric acid solutions acquired in the transmission mode.
| Coord. num. of Cl | Species | Geometric configuration | R-factor, R/– | Path | Coord. number | Edge to model ΔE/eV | Shell distance, R/Å | Debye-Waller factor, σ2/Å2 |
|---|
| 0 | [FeIII(H2O)eq4(H2O)ax2]3+* | distorted octahedron | 0.0425 | Fe–Oeq | 4 | −0.548 | 1.928 | 0.0044 |
| Fe–Oax | 2 | 2.026 | 0.0044 |
| 2 | [FeCl2(H2O)4]+ | distorted octahedron | 0.0171 | Fe–O | 4 | −1.10 | 2.024 | 0.0068 |
| Fe–Cl | 2 | −3.09 | 2.183 | 0.0099 |
| 3 | [FeCl3(H2O)2]0 | trigonal bipyramid | 0.0180 | Fe–O | 2 | −3.84 | 2.014 | 0.0025 |
| Fe–Cl | 3 | −2.23 | 2.280 | 0.0069 |
| 4 | [FeCl4]− | planar square | 0.0206 | Fe–Cl | 4 | −3.97 | 2.278 | 0.0078 |
| [FeCl4]− | tetrahedron | 0.0206 | Fe–Cl | 4 | −3.86 | 2.279 | 0.0079 |
| 6 | [FeCleq4Clax2]3− | distorted octahedron | 0.0250 | Fe–Cleq | 4 | −6.42 | 2.198 | 0.0073 |
| Fe–Clax | 2 | 2.662 | 0.0262 |
*[FeIII]aq.3+ species dissolved in sulfuric acid solution.
Table 4. The results of the FEFF fitting to the resultant EXAFS spectra of the individual ferric aqua and chloro complexes in the hydrochloric acid solutions acquired in the fluorescence mode.
| Coord. num. of Cl | Species | Geometric configuration | R-factor, R/– | Path | Coord. number | Edge to model ΔE/eV | Shell distance, R/Å | Debye-Waller factor, σ2/Å2 |
|---|
| 0 | [FeIII(H2O)eq4(H2O)ax2]3+ | distorted octahedron | 0.0507 | Fe–Oeq | 4 | −2.57 | 1.914 | 0.0028 |
| Fe–Oax | 2 | 2.014 | 0.0068 |
| 2 | [FeCl2(H2O)4]+ | distorted octahedron | 0.0165 | Fe–O | 4 | −3.69 | 2.006 | 0.0061 |
| Fe–Cl | 2 | −4.42 | 2.187 | 0.0111 |
| 3 | [FeCl3(H2O)2]0 | trigonal bipyramid | 0.0381 | Fe–O | 2 | −1.67 | 2.023 | 0.0027 |
| Fe–Cl | 3 | −3.39 | 2.261 | 0.0075 |
| 4 | [FeCl4]− | planar square | 0.0388 | Fe–Cl | 4 | −6.10 | 2.270 | 0.0061 |
| [FeCl4]− | tetrahedron | 0.0378 | Fe–Cl | 4 | −5.95 | 2.271 | 0.0061 |
| 6 | [FeCleq4Clax2]3− | distorted octahedron | 0.0367 | Fe–Cleq | 4 | −2.18 | 2.204 | 0.0049 |
| Fe–Clax | 2 | 2.610 | 0.0232 |
Several possible configuration geometries were assumed and fitted to. Due to the difference in the measurement modes, the raw spectra obtained by the fluorescence mode were noisier than those obtained by the transmission mode. Therefore, the R-factor obtained by the fluorescence mode is slightly worse than that obtained by the transmission mode. Tables 3 and 4 show the results of only the most possible structures. The complete lists including the results of inappropriate structures are shown in the supporting information. The most possible structures are illustrated in Fig. 8.

The results except [FeIIICleq4Clax2]3– are consistent in both measurement modes, where the differences in the shell distances are less than 1%. Hence, these results are robust. In addition, the condition around ferric species was consistent both in diluted (5 mmol·dm−3 for the fluorescence mode) and concentrated (500 mmol·dm−3 for the transmission mode) molarity of ferric species, although a mutual interaction of the concentrated charged species was concerned.
In particular, the structures of the ferric aqua and chloro complexes whose coordination number of Cl– was two, three, or four were successfully determined to be a distorted octahedron of [FeIIIClax2(H2O)eq4]+, a trigonal bipyramid of [FeIIICleq3(H2O)ax2]+, and a tetrahedron or a planar square of [FeIIICl4]–. The geometry configuration of [FeIIICl4]– could not be determined because every index yielded a preferable value for both structures. This is a good example to explain how the EXAFS spectrum is sensitive to the distance between the absorbing atom and the ligands but less sensitive to the geometry configuration. Further investigation is needed to determine the structure precisely.
The R-factor of [FeIII(H2O)eq4(H2O)ax2]3+ measured in the fluorescence mode was over the recommended range (Eq. 11), while the shell distances of the ligands were consistent with those measured using the solution dissolving FeIII2(SO4)3(H2O)6~9 in the transmission mode. It was estimated that the excess of R-factor was due to noisier spectra being measured in the fluorescence mode compared to those in the transmission mode, hence the excess was acceptable.
The difference in the shell distances between the center atom of FeIII and Clax at the axial position of [FeIIICleq4Clax2]3– was 2%, while those measured in the transmission and the fluorescence modes were 2.662 Å and 2.610 Å, respectively. The differences in the shell distances of [FeIIICleq4Clax2]3– was twice as those of the other ferric aqua and chloro complexes. The results obtained by the fluorescence mode were more reliable than in the transmission mode, because more composition was present in the series of sample solutions for the fluorescence mode, as discussed and shown in Fig. 6.
Figure 9 summarizes the XANES spectra of the individual species, which could be referred to as standard spectra. The spectrum of [FeIII(H2O)eq4(H2O)ax2]3+ was acquired using the solution dissolving FeIII2(SO4)3(H2O)6~9 measured in the transmission mode. The spectra of [FeIIIClax2(H2O)eq4]+, [FeIIICleq3(H2O)ax2]+, and [FeIIICl4]– were measured in the transmission mode. Only the spectrum of [FeIIICleq4Clax2]3– was measured in the fluorescence mode. X-ray absorption spectroscopy should be used in the transmission mode because it is the most robust measurement technique. However, the spectrum of [FeIIIClax2(H2O)eq4]+ measured in the transmission mode was less reliable, as discussed above.

A representation of the XANES spectrum using theoretical calculation is quite difficult. The metal aqua and chloro complex is one of the simplest complexes. Therefore, the XANES spectra obtained in the present study can be experimental standard spectra and contribute toward the development of theoretical calculation.
3.3. Verification of the Distribution and Structures of Ferric Aqua and Chloro Complexes
The distribution obtained in the present study has never been published before. It consists of a distorted octahedron of [FeIII(H2O)eq4(H2O)ax2]3+, a distorted octahedron of [FeIIIClax2(H2O)eq4]+, a trigonal bipyramidal [FeIIICleq3(H2O)ax2]+, a tetrahedron or a planar square of [FeIIICl4]–, and a distorted octahedral [FeIIICleq4Clax2]3–, and the combination of the coordination number of Cl ligands was determined as (02346).
It was common sense that the coordination number of ligands consecutively increases, starting at zero. The distributions of ferric aqua and chloro complexes reported in the literature were in accordance with the (0123...) model in most cases.17,20) The same assumption was also made for other metal chloro complexes, for instance, copper, silver, cobalt, and so on.26,33,34,35,36,37) In addition, the maximum coordination number was given intuitively or by referring to the literature, not theoretically.
Recently, it has been reported that combinations consisting of non-consecutive natural numbers were possible for cobalt chloro complexes.21,22,23) The possible maximum coordination number should be estimated considering the ionic radius, as in the present study. It is deduced that multiple combinations of the coordination numbers of ligands are possible; therefore, statistical treatment is necessary to extract the most likely combination.
Still, there may be multiple combinations left after statistical extraction; there were two possible combinations of the (02345) and (02346) models in the present study. Another analysis should be employed in order to eliminate inappropriate models for that case. EXAFS analysis was performed on both the models and the (02345) model was eliminated due to failure of the FEFF fitting analysis of the [FeIIICl5]2– complex species.
Ultimately, it was concluded that there were five ferric aqua and chloro complexes in the hydrochloric acid solutions and their thermodynamic parameters were successfully determined. However, the structure of [FeIIICl4]–, a tetrahedron or a planar square, could not be determined. In order to determine the structure, the stabilities in energy of both geometric configurations should be calculated using the ab initio technique.
4. Conclusion
The distribution of ferric aqua and chloro complexes in hydrochloric acid solutions was successfully determined using analysis involving fitting thermodynamic models to UV-vis absorption spectra based on factor analysis and introducing statistical treatment. Moreover, the structures of ferric aqua and chloro complexes were also successfully determined except for [FeIIICl4]– complex species. The latter deserves further investigation.
The results obtained in the present study provide basic knowledge to construct an efficient hydrometallurgical process. In addition to an industrial application, the results offer basic knowledge, determined experimentally, to reveal the nature of chemicals, and will contribute to understanding chemistry.
Supporting Information
Another decomposition of UV-vis absorption spectra of ferric aqua and chloro complexes shown in Fig. 1 using multivariate curve resolution alternative least squares, the estimation method of activities of relevant species, and the examples and the complete lists of the FEFF fitting analysis of the examined geometric configurations. These materials are available on the Journal website at https://doi.org/10.2355/isijinternational.ISIJINT-2021-323.
Acknowledgment
The synchrotron radiation experiments of X-ray absorption spectroscopy were performed at BL-9A and BL-9C of Photon Factory under the approval of the Photon Factory Program Advisory Committee (Proposal No. 2019G127). A part of this work was supported by JSPS KAKENHI Grant Number JP18H01759.
References
- 1) I. Billard and L. Švecová: J. Solution Chem., 47 (2018), 1291. https://doi.org/10.1007/s10953-018-0797-x
- 2) A. Werner: Ber. Dtsch. Chem. Ges., 44 (1911), 1887. https://doi.org/10.1002/cber.19110440297
- 3) J. Brugger, W. Liu, B. Etschmann, Y. Mei, D. M. Sherman and D. Testemale: Chem. Geol., 447 (2016), 219. https://doi.org/10.1016/j.chemgeo.2016.10.021
- 4) G. Bunker: Introduction to XAFS: A Practical Guide to X-ray Absorption Fine Structure Spectroscopy, Cambridge University Press, Cambridge, UK, (2010), 1.
- 5) S. Suzuki, K. Mimura and M. Isshiki: Bull. Iron Steel Inst. Jpn., 10 (2005), 491 (in Japanese).
- 6) M. Uchikoshi: Bull. Iron Steel Inst. Jpn., 22 (2017), 695 (in Japanese).
- 7) G. W. Brady: J. Chem. Phys., 29 (1958), 1371. https://doi.org/10.1063/1.1744725
- 8) C. L. Standley and R. F. Kruh: J. Chem. Phys., 34 (1961), 1450. https://doi.org/10.1063/1.1731765
- 9) G. W. Brady, M. B. Robin and J. Varimbi: Inorg. Chem., 3 (1964), 1168. https://doi.org/10.1021/ic50018a023
- 10) L. G. Sillén and A. E. Martell: Stability Constants of Metal-Ion Complexes, 2nd ed., Section I, Special Publication No. 17, Chemical Society, London, (1966), 271.
- 11) D. L. Wertz and M. L. Steele: Inorg. Chem., 19 (1980), 1652. https://doi.org/10.1021/ic50208a044
- 12) D. L. Wertz and M. D. Luter: Inorg. Chem., 20 (1981), 3118. https://doi.org/10.1021/ic50223a075
- 13) M. D. Luter and D. L. Wertz: J. Phys. Chem., 85 (1981), 3542. https://doi.org/10.1021/j150623a036
- 14) M. Magini: J. Chem. Phys., 76 (1982), 1111. https://doi.org/10.1063/1.443078
- 15) G. Giubileo, M. Magini, G. Licheri, G. Paschina, G. Piccaluga and G. Pinna: Inorg. Chem., 22 (1983), 1001. https://doi.org/10.1021/ic00148a035
- 16) B. R. Tagirov, I. I. Diakonov, O. A. Devina and A. V. Zotov: Chem. Geol., 162 (2000), 193. https://doi.org/10.1016/s0009-2541(99)00150-3
- 17) W. Liu, B. Etschmann, J. Brugger, L. Spiccia, G. Foran and B. McInnes: Chem. Geol., 231 (2006), 326. https://doi.org/10.1016/j.chemgeo.2006.02.005
- 18) J. Brugger: Comput. Geosci., 33 (2007), 248. https://doi.org/10.1016/j.cageo.2006.06.011
- 19) I. Persson: J. Solution Chem., 47 (2018), 797. https://doi.org/10.1007/s10953-018-0756-6
- 20) M. Uchikoshi: Bull. Chem. Soc. Jpn., 92 (2019), 1928. https://doi.org/10.1246/bcsj.20190195
- 21) W. Liu, S. J. Borg, D. Testemale, B. Etschmann, J.-L. Hazemann and J. Brugger: Geochim. Cosmochim. Acta, 75 (2011), 1227. https://doi.org/10.1016/j.gca.2010.12.002
- 22) M. Uchikoshi: J. Solution Chem., 47 (2018), 2021. https://doi.org/10.1007/s10953-018-0831-z
- 23) M. Uchikoshi and K. Shinoda: Struct. Chem., 30 (2019), 945. https://doi.org/10.1007/s11224-018-1245-7
- 24) The R Core Team: R: A Language and Environment for Statistical Computing, R Foundation for Statistical Computing, Vienna, (2021), 1677. https://cran.r-project.org/doc/manuals/r-release/fullrefman.pdf
- 25) M. Uchikoshi: J. Solution Chem., 46 (2017), 704. https://doi.org/10.1007/s10953-017-0597-8
- 26) M. Uchikoshi and K. Shinoda: Struct. Chem., 30 (2019), 61. https://doi.org/10.1007/s11224-018-1164-7
- 27) J. Setschenow: Z. Phys. Chem., 4U (1889), 117. https://doi.org/10.1515/zpch-1889-0409
- 28) G. M. Anderson and D. A. Crerar: Thermodynamics in Geochemistry, Oxford University Press, Oxford, UK, (1993), 505.
- 29) B. Ravel and M. Newville: J. Synchrotron Radiat., 12 (2005), 537. https://doi.org/10.1107/s0909049505012719
- 30) S. Calvin: XAFS for Everyone, CRC Press, Boca Raton, (2013), 291.
- 31) R. D. Shannon: Acta Crystallogr., Sect A, 32 (1976), 751. https://doi.org/10.1107/s0567739476001551
- 32) T. Kekesi, K. Mimura and M. Isshiki: Hydrometallurgy, 63 (2002), 1. https://doi.org/10.1016/s0304-386x(01)00208-0
- 33) J. Bjerrum, A. S. Halonin and L. H. Skibsted: Acta Chem. Scand. A, 29 (1975), 326. https://doi.org/10.3891/acta.chem.scand.29a-0326
- 34) L. H. Skibsted and J. Bjerrum: Acta Chem. Scand. A, 32 (1978), 429. https://doi.org/10.3891/acta.chem.scand.32a-0429
- 35) E. Benguerel, G. P. Demopoulos and G. B. Harris: Hydrometallurgy, 40 (1996), 135. https://doi.org/10.1016/0304-386x(94)00086-i
- 36) C. H. Gammons and Y. Yu: Chem. Geol., 137 (1997), 155. https://doi.org/10.1016/s0009-2541(96)00160-x
- 37) J. F. Boily and T. M. Seward: Geochim. Cosmochim. Acta, 69 (2005), 3773. https://doi.org/10.1016/j.gca.2005.03.015