Abstract
Present day, the production of hot metal (HM) via the blast furnace route remains an integral part of the global steel industry. With global pressure to curb greenhouse gas emissions, injection of hydrogen is considered a promising solution while ironmaking transitions to alternate technologies. A comprehensive heat and mass balance model calibrated to an operating blast furnace was used to assess the operational limits of hydrogen injection through the tuyeres, replacing Pulverised Coal Injection (PCI). Constrained by a minimum top gas temperature and minimum Raceway Adiabatic Flame Temperature (RAFT), the maximum injection rate was determined to be 19.5 kg-H2/t-HM when replacing 37.4 kg-PCI/t-HM (i.e. a replacement ratio of 1.9 kg-PCI/kg-H2 or 1.54 kg-C/kg-H2). At the maximum hydrogen injection rate, the specific CO2,eq emissions were seen to decrease by 8% in the top gas. In the case where the increased level of hydrogen increases stack reduction efficiency, the maximum hydrogen injection rate is decreased, while the replacement ratio is increased significantly. A maximum hydrogen injection rate of 14.3 kg-H2/t-HM with a replacement ratio of 4.5 kg-PCI/kg-H2 was achieved when the stack reduction efficiency was 100%, with a CO2,eq emission decrease of 14%. The optimal scenario for injection of hydrogen was determined to be maintaining a constant production rate, allowing the RAFT to decrease, and replacing PCI.
1. Introduction
The blast furnace has long supported the high demand for Hot Metal (HM) in steel production, with incremental improvements in efficiency and productivity through application of new technologies and processes. With global pressure to curb greenhouse gas emissions, the steel industry may need to transition to alternate technologies that enable lower levels of emissions to be achieved in a holistic way i.e. across the whole steelworks site. During this transition however, multiple strategies have been proposed to decrease the direct emissions of the blast furnace, such as iron carbon agglomerates, hydrogen enrichment, and oxygen blast furnace with top gas recycling.1) One of these strategies which is considered to be achievable in the near future is hydrogen (green) injection into the blast furnace.1,2,3,4) Injection of pure (green) hydrogen is considered advantageous as it can be generated on site (no geographical dependence as with natural gas) and does not disturb the integrated steelworks energy balance as with coke ovens gas.5)
The blast furnace process relies heavily on coke and auxiliary fuels for generation of heat and carbon monoxide reducing gas (from combustion). The primary purpose of introducing additional hydrogen into the blast furnace is to replace a portion of the carbon-based reduction with hydrogen. This aids in decreasing greenhouse gas emissions, as hydrogen produces water as a by-product of reduction instead of carbon dioxide. However, as coke also provides a gas permeable structure at high temperature, decreasing the coke rate is limited using hydrogen, with the lowest coke rates achieved being approximately 260 kg-coke/t-HM.6) In addition, indirect reduction with hydrogen is endothermic, altering the heat distribution within the furnace.7)
Numerical models of the blast furnace are a common tool used for operator guidance and development of new operating conditions. In recent years, modern blast furnaces have adopted various auxiliary injectant practices in order to decrease cost and optimise material utilisation. Pulverised Coal Injection (PCI) and Natural Gas (NG) injection are two commonly used auxiliary fuels, both of which increase the hydrogen content of the blast furnace. With the current focus on hydrogen enrichment, multiple studies have utilised numerical models to understand the effect of injecting hydrogen into the tuyeres of the blast furnace. As well as this, operational trials of hydrogen injection are underway, such as the single tuyere injection performed by Thyssenkrupp.8)
With injected hydrogen entering and exiting the raceway in the same form, the initial effect of hydrogen injected at a temperature below that of the blast is to decrease the Raceway Adiabatic Flame Temperature (RAFT). Because of this, higher injection temperatures are clearly beneficial to decreasing the impact of hydrogen in the raceway.9) However, with hydrogen heating technology still in its infancy, heating of hydrogen is expected to incur significant logistical and financial difficulty.10)
It has been demonstrated that when operating with hydrogenous fuels (such as PCI and NG), the minimum RAFT can be significantly decreased. Geerdes (2016) accredits this to the increased hydrogen content of the bosh gas decreasing the total ‘chemical and thermal’ energy requirement of the lower zone, due to the decrease in direct reduction of wustite (FeO) with coke.
When assessing injection of hydrogen into the blast furnace, one approach follows that of Nogami, et al. (2012). This involves maintaining the sensible heat supply rate to the lower zone nearly constant through a constant bosh gas flow rate and RAFT, typically achieved by adjusting oxygen enrichment and blast flow rate.10,12,13,14,15) Maintaining this condition when injecting hydrogen has been shown to increase production rate and decrease the top gas temperature. Tang, et al. (2021) attributed these changes to the higher degree of reduction decreasing residence time, and increased oxygen enrichment burning more coke and creating more space for the burden descent. When assessing injection of unheated hydrogen under the system constraints described above, Castro, et al. (2017) determined 20.25 kg-H2/t-HM replaces 27 kg-coke/t-HM (in Case 2 of their study) and Tang, et al. (2020) determined 10.8 kg-H2/t-HM replaces 45 kg-coke/t-HM, corresponding to replacement ratios of 1.3 and 4.2 kg-coke/kg-H2 respectively. Sato, et al. (2015) determined a maximum hydrogen injection of 26 kg-H2/t-HM with a constant RAFT, replacing 66 kg-coke/t-HM (replacement ratio of 2.5 kg-coke/kg-H2).
Spanlang, et al. (2020) used a Rist based heat and mass balance model to assess coke replacement with hydrogen. In their study, the RAFT was allowed to decrease, with the top gas temperature remaining constant. Under these constraints, 18 kg-H2/t-HM was shown to decrease the RAFT by 278°C and replace 54 kg-coke/t-HM (replacement ratio of 3 kg-coke/kg-H2).
The large range of replacement ratios seen in literature demonstrates that the extent to which hydrogen can replace coke is dependent on many operational factors and constraints. That is, the replacement ratio reflects other changes made to the modelled operations in conjunction with hydrogen injection, so it is important that these changes are clearly identified and assessed.
Based on a comprehensive two-stage heat and mass balance model,18) this study aims to assess the operational limits of hydrogen injection and determine the extent to which hydrogen can replace carbon in the blast furnace. As coke rate is already optimised to provide for permeability, the primary focus of this study is replacement of PCI with hydrogen. As well as this, the use of hydrogenous fuels has been shown to decrease the thermal requirement of the lower zone, and it is thus appropriate to assess the limits of hydrogen injection with a decreased RAFT. Finally, the replacement ratio of carbon by hydrogen will be investigated.
2. Methodology
2.1. Heat and Mass Balance Modelling
Numerical modelling is a common tool used to simulate the internal state of the blast furnace and to predict a range of operating parameters that cannot easily be measured. A range of modelling techniques have been developed over the years, with increasingly sophisticated models being developed for specific purposes.19) A comprehensive two stage heat and mass balance model with facility to calibrate to an operating blast furnace was used in this study.18) The model was calibrated to an operating blast furnace, of which the operating conditions were used as a Base Case scenario.
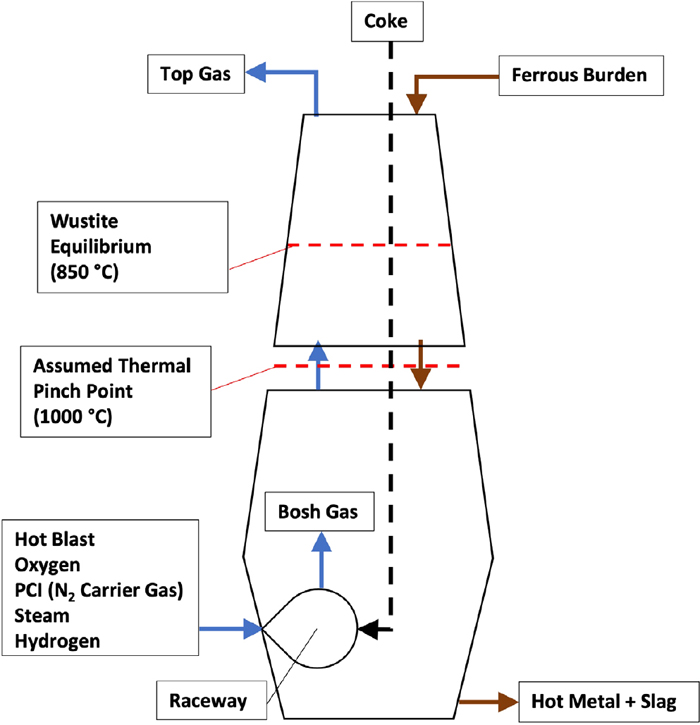
The model operates under the assumption that a chemical and thermal reserve exists in the furnace, in which the gas and wustite are in near-equilibrium.20) This is encompassed by a thermal reserve that extends downwards to the boundary at which the rate of solution loss becomes significant, and which divides the furnace into two ‘stages’ through which the heat and mass balance can be performed. The split into upper and lower zones is defined at the thermal pinch point where solid and gas temperatures are closest. At this point, the solid and gas are both assumed to be at 1000°C. The chemical reserve zone composition is calculated at a set solid temperature of 850°C, with the gas temperature determined by the upper zone heat balance. A general overview of calculation regions used in the model is shown in Fig. 1.
Stack Reduction Efficiency (SRE) describes the extent to which the ferrous burden approaches equilibrium with the gas in the chemical reserve zone. Since the SRE in the Base Case is determined by calibration to an operating blast furnace, it follows that predictions made when assessing hydrogen injection at the same equilibrium temperature of 850°C will be consistent. The SRE of the Base Case scenario was 0.91.
The injectant stream includes hot blast air, steam, oxygen enrichment, PCI (with nitrogen carrier gas) and hydrogen where appropriate. Some constant parameters were considered to be:
• Hot blast air entering at 1153°C
• Hot blast air natural humidity of 10.6 g/Nm3
• Hot metal temperature of 1522°C
• Hot metal carbon content of 5.0%
• Slag temperature of 1572°C
• Slag basicity (CaO/SiO2) of 1.2
• Slag MgO content of 5.9%
The minimum bosh gas (gas leaving the raceway) rate is determined by the gas requirement to reach equilibrium with wustite, which is in turn dictated by the hot metal production. An implication of this is that the bosh gas and production rate are inherently linked and cannot be simultaneously constrained.
The top gas temperature and composition are a result of heat transfer and reactions occurring between the gas and the solids in the shaft (above the thermal pinch point). The composition of the rising gas, specifically the oxidation degree of the hydrogenous and carbonaceous species (commonly termed utilisation,
η
CO
=
C
O
2
CO+C
O
2
,
η
H2
=
H
2
O
H
2
+
H
2
O
) is particularly complex, as it is the result of multiple simultaneous reactions between both the gas and solid phases. Some of these reactions, such as the Water Gas Shift Reaction (WGSR) can be catalysed in the presence of specific associations of iron.21) Consequently, the influence of hydrogen enrichment on the relative utilisation rates of hydrogen (ηH2) and carbon monoxide (ηCO) has not been well-characterised. For this study, the hydrogen utilisation for all cases was assumed to be linearly proportional to the carbon monoxide utilisation, such that ηH2=1.006·ηCO, as determined for the Base Case.
It is worth noting that the RAFT calculation involves solid coke, for which the sensible heat input is calculated at 75% of the RAFT (making the calculation implicit). While the input enthalpy to the raceway can be well defined for injectants, coke is graphitised as it descends through the furnace, decreasing in Gibbs energy.22,23) This is explicitly accounted for through the heat of graphitisation, which is assumed to be recovered at the raceway at the rate of −753 kJ/kg-C in the present modelling.
2.2. Heat and Mass Balance Constraints
When assessing the injection of hydrogen into the blast furnace, key operational constraints must still be met, such as hot metal and slag temperatures to maintain fluidity. As well as this, assumptions made in the development of the two-stage heat and mass balance model, such as the approach to equilibrium of the gas with Wustite in the chemical reserve zone, are assumed to remain valid under hydrogen enrichment. As stated, in this study, assumptions for key parameters under enriched hydrogen conditions were extrapolated from a real blast furnace operation, used as a Base Case. The composition of coke and PCI used in all cases are presented in Table 1. The operating conditions of the Base Case blast furnace are shown in Table 3.
Table 1. Composition of coke and PCI used for modelling.
| Component | C (wt%) | H2 (wt%) | N2 (wt%) | O (wt%) | SiO2 (wt%) | Al2O3 (wt%) | CaO (wt%) | MgO (wt%) | Total Ash (wt%) |
|---|
| Coke | 85.92 | 0.40 | 1.27 | – | 7.30 | 3.61 | 0.22 | 0.07 | 12.41 |
| PCI | 80.77 | 3.84 | 1.53 | 3.79 | 4.61 | 3.41 | 0.28 | 0.11 | 9.77 |
Table 3. Operating parameters of Base Case and at maximum hydrogen injection for all cases.
| Parameter | Base Case | Case 1 | Case 2 | Case 3 | Case 4 |
|---|
| Production Rate (t/d) | 7748 | 7748 | 7195 | 7748 | 7748 |
| Hydrogen Rate (kg/t-HM) | 0 | 19.54 | 18.82 | 18.98 | 14.29 |
| Coke Rate (kg/t-HM) | 364 | 364 | 364 | 333 | 364 |
| PCI Rate (kg/t-HM) | 140 | 102.6 | 104.1 | 140 | 75.6 |
| Slag Rate (kg/t-HM) | 313 | 307 | 307 | 306 | 303 |
| Blast Air Rate (Nm3/t-HM) | 899 | 790 | 802 | 720 | 888 |
| Oxygen Enrichment (%) | 2.14 | 4.03 | 3.65 | 6.18 | 0.49 |
| Bosh Gas Flow Rate (Nm3/h) | 431784 | 464043 | 431784 | 452809 | 454989 |
| Top Gas Temperature (°C) | 138 | 119 | 119 | 118 | 118 |
| RAFT (°C) | 2251 | 2051 | 2051 | 2050 | 2051 |
The primary differences between the four cases were the unconstrained variables used to close the various balances being performed (primarily carbon, oxygen, iron and heat balances). The primary controls of each case are shown in Table 2 and discussed in detail below. A simplified overview of the calculation method with these constraints is shown in Fig. 2.
Table 2. Primary constraints and variables for each case.
| Case Number | 1 | 2 | 3 | 4 |
|---|
| Production Constraint | 7748 t/d
hot metal | 431784 Nm3/hr
Bosh Gas Flow | 7748 t/d
hot metal | 7748 t/d
hot metal |
| Carbon Source Varied | PCI | PCI | Coke | PCI |
| Stack Reduction Efficiency | 0.91 | 0.91 | 0.91 | 1.00 |
Cold hydrogen injection is known to decrease the RAFT, which can be maintained through the use of oxygen enrichment at the expense of top gas temperature.10) Because of this, a minimum top gas temperature and RAFT were established. The minimum top gas temperature was set as 118°C to be maintained above the acid dew point of the gas, and a minimum RAFT was established as 200°C below the Base Case RAFT (minimum of 2050°C).11,24,25) These constraints were met in a stage-wise fashion, with the RAFT being maintained until the minimum top gas temperature had been reached, before being allowed to decrease to the constrained limit. These constraints were applied in all cases assessed.
A key point of the modelling in this study was to maintain consistency in the blast furnace operation between the Base Case and cases assessing hydrogen injection. Hence, operating parameters such as hot blast temperature and hot metal temperature were maintained constant in all cases.
Steam injection is used for rapid thermal control of the raceway and as such, may not be practically constrained to the hot metal production. Despite this, to maintain consistency and comparability between cases assessing hydrogen injection the steam rate was maintained proportional to the hot metal production. The effect of constraining the steam rate to the hot blast rate and a fixed daily rate on the replacement ratio of hydrogen was separately assessed.
As discussed, a common constraint applied to the blast furnace when assessing hydrogen injection is to maintain the bosh gas flow rate in combination with a constant RAFT resulting in an increase in furnace production rate.10,12,14) In the present modelling, with the minimum top gas temperature and RAFT established, separate scenarios were evaluated to compare hydrogen injection under a constant production rate (Case 1) and constant bosh gas flow rate (Case 2). With modern blast furnaces operating close to minimum coke rates, it was of most interest to simulate the replacement of PCI with hydrogen. As such, for both cases, the coke rate was maintained constant.
The primary controls over the furnace operating parameters were thus: the blast flow rate, an unconstrained variable used to control furnace production rate in Case 1, or bosh gas flow rate in Case 2; oxygen enrichment (unconstrained variable used to control RAFT or top gas temperature); and PCI rate (unconstrained variable used to meet the carbon balance and determine the change in fuel requirements under hydrogen injection).
As previous studies have focussed on replacing coke with hydrogen, an additional scenario was undertaken for comparison. This case, Case 3 in Table 2, had identical constraints to Case 1 except for the replacement of coke instead of PCI (i.e. constant PCI rate).
It is expected that the characteristics of hydrogen reduction in the furnace will lead to an increased SRE.7) This is supported by limited experimental studies which have indicated that the utilisation of hydrogen increases.26,27,28) However, as the effect of hydrogen on the SRE has not been well-quantified, the SRE was maintained constant in Cases 1, 2 and 3. An additional case, Case 4, was undertaken to determine the sensitivity of the system to the SRE. Constraints in Case 4 were identical to Case 1 (constant production rate), with the maximum hydrogen injection rate re-evaluated at the maximum theoretical SRE of 1.
3. Results and Discussion
Following the determination of the maximum hydrogen injection for each case, the conditions of key stages in the blast furnace, namely the hot blast, bosh gas and top gas conditions are presented. Fuel replacement behaviour and how it is influenced by steam control is discussed. Finally, the sensitivity of the results to the SRE is presented.
3.1. Determining Hydrogen Injection Limits
Figure 3 shows the changes in constrained parameters (top gas temperature and RAFT) with increasing hydrogen injection for Cases 1, 2 and 3. It should be noted that Case 4 is not shown as it was only calculated at the maximum possible hydrogen injection.

In Fig. 3, the stage-wise approach to the minimum RAFT and top gas temperature is evident. At approximately 3 kg-H2/t-HM the top gas temperature falls to the constrained limit of 118°C, while the RAFT is maintained constant. At higher rates of hydrogen injection, the RAFT progressively decreases until the limit of 200°C drop in RAFT is reached at approximately 19.5 kg-H2/t-HM (Case 1) and 19 kg-H2/t-HM (for Cases 2 and 3). Thus, the hydrogen injection limit was seen to only vary by 2.5% between the three scenarios, with the maximum hydrogen injection being 19.5 kg-H2/t-HM in Case 1 at a constant production rate. The similarity between each case in Fig. 3 indicates that with this combination of applied constraints (bosh gas/production rate, PCI/coke replacement), the effect of changing parameters as a consequence of hydrogen injection on the RAFT and top gas temperature (and thus the maximum hydrogen injection) is similar. The limit of 19.5 kg observed in this study is consistent with the results of Sato, et al. (2015) who showed that hydrogen injection must be less than 26 kg-H2/t-HM based on heat flow ratio, if the RAFT was kept constant.
Table 3 shows the operating parameters of all cases at the determined maximum hydrogen injection rate. Unconstrained control variables are shaded grey.
3.2. Hot Blast Conditions
The hot blast rate and oxygen enrichment were primary controls to compensate the thermal effects of hydrogen in the furnace. Specific flow rates of nitrogen in the hot blast, as well as the total gaseous injectant volume (Air + Hydrogen + Steam + Oxygen enrichment) and degree of oxygen enrichment are shown in Fig. 4.
In all cases the general trend of the total volume of gas injected is similar. For hydrogen injection rates less than ~3 kg-H2/t-HM, where the RAFT is maintained through the increase in oxygen enrichment, the total blast volume is seen to decrease leading to the decrease in top gas temperature seen in Fig. 3. As the hydrogen injection rate increases, where the RAFT is allowed to decrease (Fig. 3), the total volume of injected gas increases. This increase in the total gas injected counteracts the negative effects of oxygen enrichment on the top gas temperature.
In Fig. 4 the blast conditions for Case 1 and 2 are similar, however when comparing these cases with Case 3 some key differences between replacing coke and PCI are evident. With the decrease in coke charged to the top of the blast furnace, the sensible heat requirement of the rising gas to heat the material in the upper stack (above the thermal reserve) is also decreased.29) Because of this, in general, the impact of oxygen enrichment on the top gas temperature is decreased, allowing a higher oxygen enrichment. The effects of this higher oxygen enrichment are seen in the total blast rate and nitrogen content of the blast, which are lower than Cases 1 and 2.
3.3. Bosh Conditions
Shown in Fig. 5 is the bosh gas flow rate and production rate with increasing hydrogen injection for Cases 1, 2 and 3. The specific bosh gas flow rate per tonne of hot metal produced, is also shown.

It is seen in Fig. 5 that while the production rate increases when the ‘thermal state’ of the furnace is maintained i.e. during constant RAFT, up to ~3 kg-H2/t-HM, the production rate decreases in Case 2, when the bosh gas flow rate is maintained but the RAFT decreases. This relationship is demonstrated by the specific bosh gas flow rate, which is seen to increase in a similar way for all cases. The increase in HM production when RAFT is maintained is described by Tang, et al. (2021) as being primarily due to the oxygen enrichment increasing (Fig. 4) the consumption of coke and accelerating the burden descent (and production rate) of the furnace. Thus, when the RAFT is no longer maintained by oxygen enrichment, it is seen that the production rate decreases due to the increase in specific bosh gas consumption. This relationship implies that for furnaces operating closer to thermal limits in the top gas (and are thus limited in their use of oxygen enrichment), it may be more difficult to maintain a constant production rate when injecting hydrogen as bosh gas rate increases. However, it is worth noting that the impact of this increase in bosh gas volume will be at least partially offset by decreased gas density and viscosity. As well as this, the effect of hydrogen on the softening and melting behaviour of burden is expected to improve the cohesive zone characteristics.28,30) With the cohesive zone being the primary bottleneck for gas flow, a higher bosh gas flow rate may be feasible under hydrogen enrichment.
A consequence of the decreased gas flow at constant RAFT in Cases 1 and 3 is that the top gas temperature decreases more significantly than in Case 2, where the gas flow rate is held constant. This effect is also demonstrated in Fig. 3, where the minimum top gas temperature is reached at 2.68 kg-H2/t-HM for Cases 1 and 3, and 2.9 kg-H2/t-HM for Case 2.
While the total bosh gas consumption for Case 3 was lower than Cases 1 and 2, it was seen that the combined specific consumption of CO and H2 in the bosh gas was slightly higher in Case 3. As well as this, all hydrogen injection cases had higher concentrations of total reducing gas (CO + H2) in the bosh gas. With the increased reducing agent, the Degree of Direct Reduction (DDR) was seen to decrease by ~25% from 0.30 to ~0.22. This decrease in direct reduction decreases the heat requirement of the bosh, facilitating the lower RAFT. The composition and total specific flow rate of the bosh gas at the maximum hydrogen injection of each case is shown in Fig. 6.
3.4. Top Gas Conditions
The top gas composition is a product of multiple reactions occurring throughout the furnace between the rising gas and descending solids. Alongside the carbon solution loss reaction (Eq. (1)), the WGSR (Eq. (2)) and water-gas reaction (Eq. (3)) will become relatively more significant in determining the balance of hydrogen and carbon utilisation as the hydrogen content of the bosh increases.
|
H
2
O+
C
coke
→
H
2
+CO
| (3) |
The occurrence of these reactions introduces significant complexity to the determination of the top gas composition,12) as especially the WGSR can be catalysed by some iron phases, such as magnetite, and not others.21) The primary effect of the WGSR is to swap oxygen between hydrogenous and carbonaceous components of the gas, such that if the reaction proceeds to increase the utilisation of carbon, it will decrease the utilisation of hydrogen and vice versa.
In experimental blast furnace studies, injection of hydrogenous gas into the tuyeres of the blast furnace has been observed to have conflicting effects on the relationship between carbon and hydrogen utilisation. Watakabe, et al. (2013) found that tuyere injection of 100 Nm3/t-HM Coke Ovens Gas (COG, containing 57 vol% H2, 31 vol% CH4 and 12 vol% N2) decreased ηCO from 0.422 to 0.407 and increased ηH2 from 0.382 to 0.422. In laboratory studies, Higuchi, et al. (2020) simulated injection of 300 Nm3/t-HM reformed COG (containing 60 vol% H2, 30 vol% CO and 10 vol% N2) and also observed a decrease in ηCO from 0.472 to 0.458 and an increase in ηH2 from 0.345 to 0.386. However, Nakano, et al. (2018) observed an increase in ηCO when injecting COG through the tuyeres of an experimental blast furnace. From these limited results, the effect of high hydrogen enrichment on the relationship between ηH2 and ηCO in an operating blast furnace is still unconfirmed. Because of this, the relationship calibrated to the operating Base Case blast furnace was assumed to remain valid, such that ηH2=1.006·ηCO.
The specific flow rate of each top gas component for the maximum hydrogen injection of all cases is shown in Fig. 7. The calculated value of ηCO (eta-CO) is also shown. It should be noted that the water content of the top gas is inclusive of water evaporated from charged burdens.

From Fig. 7, it is seen that ηCO (and thus ηH2) decreases for Cases 1, 2 and 3. While the hydrogen concentration of the rising gas is higher (see Fig. 6), the amount of oxygen to be removed from the descending burden is the same. In addition, Figs. 6 and 7 both show an increase in the total H2 + C components of the gas. Thus, with the total increase in reducing gas, the utilisation of both components decreases. Despite this, as reduction by hydrogen increases in Cases 1, 2 and 3, the carbon (monoxide) concentration of the rising gas decreases when compared to the Base Case (see Fig. 6) resulting in a similar decrease in the specific emissions of CO2 in the top gas of approximately 14% (from 336 Nm3-CO2/t-HM to ~290 Nm3-CO2/t-HM). While the direct CO2 emissions from the blast furnace decrease, the CO contained in the top gas is likely to eventually become CO2 and should thus be considered in the emissions. From the Base Case to Cases 1, 2, and 3, the total resulting emission decrease (CO + CO2) is thus from 693 Nm3/t-HM to ~636 Nm3/t-HM, or 8%. This is a total emission reduction of 110 kg-CO2,eq/t-HM.
3.5. Fuel Replacement Trends with Hydrogen
Coke replacement has been the primary focus of many previous studies assessing hydrogen injection. With the vast majority of global blast furnaces operating with PCI,31) it is of interest to understand how hydrogen can be used to replace PCI. As well as this, the replacement of PCI instead of coke reduces the potential impact of hydrogen injection on an integrated steel works, where the coke production rate is varied to match the blast furnace consumption, as the COG used for auxiliary heating and power generation will largely remain unchanged. Besides this, the replacement of solid injectant with gas has significant potential advantages, such as decreased ash loads and char generation from the solid-gas reaction (combustion).11) In order to express fuel replacement trends with hydrogen injection the Replacement Ratio (R) is used, shown in Eq. (4).
|
R=
m
Fuel,Base
-
m
Fuel
m
H2
| (4) |
mFuel,Base represents the specific mass rate of the fuel being replaced (in this study, PCI or coke) in the Base Case, mFuel represents the specific mass rate of fuel being replaced in each hydrogen injection case, and mH2 represents the specific mass rate of hydrogen injected. It should be noted that R reflects the decrease in solid fuel rate from all operational modifications. Because of this, particular attention has been paid in this study to maintain consistency in all possible operating parameters to assess the impact of only the injection of hydrogen.
Shown in Fig. 8 is the replacement ratio of PCI (Cases 1 and 2) and coke (Case 3). As well as the replacement ratio of each fuel, the replacement of the carbon content only of each fuel is also shown via dotted lines. The replacement ratio of carbon is calculated as RC=RFuel·wC,Fuel, where wC,Fuel denotes the mass fraction of carbon in the fuel being replaced.

From Fig. 8, the replacement ratio of PCI is seen to be higher than that of coke. The carbon only component of each fuel also demonstrates a lower replacement ratio when replacing coke with hydrogen compared to PCI. At the maximum hydrogen injection, the replacement ratio of PCI is seen to be ~1.9 kg-PCI/kg-H2 (Cases 1 and 2), while the replacement ratio of coke is seen to be 1.64 kg-coke/kg-H2 (Case 3). From this relationship, it can be inferred that the replacement ratio of coke with PCI under these conditions is ~0.86 kg-coke/kg-PCI. This value is consistent with that expected for the PCI quality,31,32) indicating that the primary differences in replacement of coke and PCI with hydrogen are related to the replacement of coke with PCI.
The replacement ratio at the lowest calculated hydrogen injection of ~2.7 kg-H2/t-HM is seen to be lower than at higher hydrogen injection rates. As seen in Fig. 3, this injection rate corresponds to the change in constraints, up to which the RAFT was maintained. In order to maintain the RAFT, the oxygen enrichment increases more significantly compared to higher injection rates where the RAFT is allowed to decrease, as seen in Fig. 4. This higher oxygen enrichment reflects the additional energy required to maintain the thermal state of the RAFT. This energy requirement increases the amount of fuel required, thus decreasing the initial replacement ratio. It is worth noting that as the following replacement ratios reflect all changes to the process, this initial increase in fuel requirement impacts all replacement ratios, producing the monotonically increasing curve seen in Fig. 8.
From Fig. 8, the replacement of PCI with hydrogen is seen to be more effective on a pure carbon basis than replacement of coke based on the assumed qualities of PC and coke. At the maximum injection rates, Cases 1 and 2 (PCI is replaced) achieve a replacement ratio of 1.54 kg-C/kg-H2 and 1.56 kg-C/kg-H2 respectively, whereas the replacement ratio of Case 3 is ~9% lower at 1.41 kg-C/kg-H2. From this, alongside having less impact on blast furnace permeability and potentially the integrated steelworks energy balance, replacement of PCI is seen to be more favourable from a pure carbon replacement perspective.
In comparison with previous studies that replaced coke, the replacement ratio of 1.64 kg-coke/kg-H2 determined for Case 3 falls between that of Castro, et al. (2017) and Spanlang, et al. (2020) (1.3–3 kg-coke/kg-H2).
3.6. Effect of Steam Control on Fuel Replacement
Steam injection is typically used for rapid thermal control of the raceway and has a significant effect on the fuel rate. In this study, the production rate is maintained constant with hydrogen injection for all cases except Case 2, with steam injection fixed on a daily rate and hence proportional to the hot metal production. As Case 2 has a variable production rate, the specific steam injection rate will vary if the daily steam injection is maintained constant. As previously discussed, to maintain comparability between the cases, steam injection was fixed proportional to the hot metal production in Case 2. However, with steam injection also serving other purposes, decreasing the daily rate of steam may not be practical. For this reason, the sensitivity of the replacement ratio to the way in which steam is varied was assessed. In addition to fixing the steam rate proportional to the hot metal production, the replacement ratio was assessed when the steam rate was constrained proportional to the hot blast rate as well as on a fixed daily rate. Figure 9 shows the PCI replacement ratio of Case 2 with various methods of steam control.

From Fig. 9, it is clear that the steam control has a significant effect on the produced replacement ratio ‘trend’. When steam is blast proportional, the replacement ratio is between 2–7.4% higher than other steam control methods. As noted previously in Fig. 5, the production rate is initially seen to increase before decreasing as the hydrogen injection rate increases above ~2.7 kg-H2/t-HM. Thus, when the steam rate is maintained constant on a daily rate, the specific steam rate follows the same trend as the production rate. With the initial increase in production rate, the specific steam injection is decreased and as such, the initial replacement ratio is higher. Conversely, with further hydrogen injection the production rate decreases, and thus the specific steam rate increases. This leads to the lower replacement ratio when compared to a constant specific steam rate seen in Fig. 9.
From Fig. 4, the total blast rate is initially seen to decrease before increasing above ~2.7 kg-H2/t-HM. With the steam rate decreasing in proportion to the blast air, the energy requirement to maintain the RAFT is decreased significantly, and thus the replacement ratio increases. This initial increase in the replacement affects further hydrogen injection rates, reducing the upward trend of the replacement ratio seen in the daily and hot metal proportional steam constraints. In addition to the steam rate decreasing in proportion to the blast air, the production rate also decreases as discussed above. This compounds the effect on the specific steam injection rate, leading to the higher replacement ratio seen in Fig. 9.
3.7. Sensitivity to Stack Reduction Efficiency
Stack Reduction Efficiency (SRE) is a term used to describe the extent to which the gas and solid phases reach equilibrium in the chemical reserve zone of the furnace, defining the composition of both phases. As discussed, in Cases 1–3, the SRE was maintained at a constant value calibrated to an operating blast furnace (SRE = 0.91). While the effect of hydrogen on the SRE is not yet well-characterised, compared with carbon monoxide, hydrogen reduction has superior kinetics and equilibrium driving force at high temperatures.7) These characteristics are likely to improve the ability of the gas to reach equilibrium with solids in the chemical reserve zone, and thus increase the SRE. The few available experimental studies have also indicated that the utilisation of hydrogen is likely to increase.26,27,28) To assess the upper limits of this increase, the hydrogen injection limit was re-assessed with SRE = 1 in Case 4. A SRE of 1 is a hypothetical and unobtainable upper limit, used for modelling purposes only. This analysis was performed under the same constraints as Case 1, with the maximum hydrogen injection re-calculated with the modified SRE.
As seen in Table 3, the maximum hydrogen injection for Case 4 was determined to be 14.3 kg-H2/t-HM, significantly lower than cases in which the SRE was maintained constant. The hydrogen was also seen to replace ~64 kg-PCI/t-HM, corresponding to a replacement ratio of 4.5 kg-PCI/kg-H2. This replacement ratio was higher than Case 1, as the effect of simultaneously adding hydrogen and increasing the SRE is compounded. Hence, depending on the occurrence and extent of an increased hydrogen concentration increasing the SRE, the real replacement ratio could be as high as 4.5 kg-PCI/kg-H2, similar to the high replacement ratios observed by Yilmaz, et al. (2017).
The Rist diagram is a useful graphical tool to visualise the operating conditions in the blast furnace.33,34) Shown in Fig. 10 is a comparison of the Rist diagrams for the Base Case and Cases 1 and 4.
When comparing Case 1 to the Base Case in Fig. 10, the assumption of a fixed SRE is demonstrated by the pivoting of the operating line around point R. From this pivot, with the increase in hydrogen and oxygen in the blast, point E is seen to move downwards, and point A left, representing the decrease in the top gas utilisation seen in Fig. 7.
The operating line for Case 4 is seen to pass through point W, representing the assumption that SRE = 1. When compared to Case 1, the resulting operating line in Case 4 represents the compound movement of injecting hydrogen (seen in Case 1) and increasing the SRE to 1. With Point R approaching Point W as SRE increases, the slope of the line is seen to decrease. It should be noted that the movement of the W point is extremely small, as the determination of the equilibrium composition at 850°C is close to the point where H2 and CO have similar theoretical utilisations. The increased SRE essentially allows the gas to achieve a higher utilisation through the chemical reserve zone. This decreases the amount of CO and H2 required to remove oxygen from the burden, and thus also increases the utilisation in the top gas. With the utilisation of gas increased, the amount of solution loss occurring is decreased which results in a lower top gas volume. Overall, the total specific CO2,eq emissions are seen to decrease by ~14%, offsetting 190 kg-CO2,eq/t-HM. It should be noted that while the specific emissions of Case 4 are higher than that of Cases 1, 2 and 3, the efficiency of the process has increased, meaning that less hydrogen and unutilised carbon leave through the top gas. This is beneficial as green hydrogen is likely to be a valuable commodity for some time.
When comparing Case 4 to Case 1 in Fig. 10, the decreased slope of the operating line corresponds to a lower total C + H2 requirement. Because of this, the CO + H2 requirement of the bosh gas is also lower, as seen in Fig. 6. A result of the decreased gas requirement is that the effect of adding hydrogen on the RAFT is amplified: Both the sensible heat effect of hydrogen and the reduced energy from CO generation decrease the RAFT under hydrogen injection. This restricts the maximum injection rate through the constrained RAFT decrease, but also increases the achievable replacement ratio.
Case 4 indicates that if hydrogen has the effect of increasing the SRE, its impact on blast furnace efficiency can be drastically improved. The compounding effect of the increase in SRE and hydrogen utilisation results in a higher replacement ratio and lower injection limit. The extent to which hydrogen increases the SRE in a real blast furnace is yet to be determined. With in-furnace hydrogen behaviour (such as the relationship between ηH2 and ηCO, and extent of WGSR) and its influence on the SRE, the real impact of hydrogen will fall somewhere between the two results (between 8–14% reduction in CO2,eq).
4. Conclusion
A comprehensive two-stage heat and mass balance model calibrated to an operating blast furnace (a Base Case) was used to assess operational limits to hydrogen injection in the blast furnace. Various scenarios were simulated to provide operational comparisons with different model constraints associated with production rate-bosh gas rate and coke-PCI replacement. As well as these constraints, the sensitivity of the model to an increase in the stack reduction efficiency with injection of hydrogen in the blast furnace was assessed. Relative to the Base Case operation, it was noted that:
(a) Hydrogen injection is primarily limited by a decrease in the top gas temperature (minimum 118°C) and RAFT (minimum 2050°C).
(b) When the RAFT is allowed to decrease, the specific bosh gas consumption is increased. Thus, under constant bosh gas flow rate a productivity decrease is observed. Because of this, it is necessary to accommodate a higher bosh gas rate to maintain a constant production rate.
(c) Under constant stack reduction efficiency, the maximum hydrogen injection rate was determined to be 19.5 kg-H2/t-HM, replacing 37.2 kg-PCI/t-HM (replacement ratio of 1.9 kg-PCI/kg-H2) or 19 kg-H2/t-HM replacing 31 kg-coke/t-HM (replacement ratio of 1.64 kg-coke/kg-H2).
(d) The replacement ratio of PCI with hydrogen was seen to be higher than that of coke by 9% on a pure carbon basis.
(e) Where it was assumed that the addition of hydrogen increases the stack reduction efficiency to 1.0, the maximum hydrogen injection rate was decreased to 14.3 kg-H2/t-HM. However, since the hydrogen utilisation is increased (less hydrogen leaves through the top gas), the replacement ratio could be as high as 4.5 kg-PCI/kg-H2.
(f) Injection of hydrogen was determined to reduce direct blast furnace CO2,eq emissions by ~8% if the SRE remains constant, and up to 14% if the SRE increases to its hypothetical upper limit of 1.
Acknowledgements
The authors gratefully acknowledge industrial partner BHP for their financial support and permission to publish this paper. The authors also gratefully acknowledge the valuable discussions and input from BlueScope Steel.
References
- 1) J. Zhao, H. Zuo, Y. Wang, J. Wang and Q. Xue: Ironmaking Steelmaking, 47 (2020), 296. https://doi.org/10.1080/03019233.2019.1639029
- 2) Y. Chen and H. Zuo: Ironmaking Steelmaking, 48 (2021), 749. https://doi.org/10.1080/03019233.2021.1909992
- 3) Y. Liu, Z. Hu and Y. Shen: Metall. Mater. Trans. B, 52 (2021), 2971. https://doi.org/10.1007/s11663-021-02156-z
- 4) Y. Zhuo, Z. Hu and Y. Shen: Fuel, 302 (2021), 120804. https://doi.org/10.1016/j.fuel.2021.120804
- 5) M. Sato, K. Takahashi, T. Nouchi and T. Ariyama: ISIJ Int., 55 (2015), 2105. https://doi.org/10.2355/isijinternational.ISIJINT-2015-264
- 6) A. Babich: Ironmaking Steelmaking, 48 (2021), 728. https://doi.org/10.1080/03019233.2021.1900037
- 7) D. Spreitzer and J. Schenk: Steel Res. Int., 90 (2019), 1900108. https://doi.org/10.1002/srin.201900108
- 8) thyssenkrupp: Injection of hydrogen into blast furnace: thyssenkrupp Steel concludes first test phase successfully, https://www.thyssenkrupp-steel.com/en/newsroom/press-releases/thyssenkrupp-steel-concludes-first-test-phase-successfully.html, (accessed 2021-11-23).
- 9) C. Yilmaz, J. Wendelstorf and T. Turek: J. Clean. Prod., 154 (2017), 488. https://doi.org/10.1016/j.jclepro.2017.03.162
- 10) J. Tang, M. Chu, F. Li, Z. Zhang, Y. Tang, Z. Liu and J. Yagi: J. Clean. Prod., 278 (2021), 123191. https://doi.org/10.1016/j.jclepro.2020.123191
- 11) M. Geerdes: Iron Steel Technol., 13 (2016), 82.
- 12) H. Nogami, Y. Kashiwaya and D. Yamada: ISIJ Int., 52 (2012), 1523. https://doi.org/10.2355/isijinternational.52.1523
- 13) H. M. Long, H. Wang, W. Zhao, J. X. Li, Z. Liu and P. Wang: Ironmaking Steelmaking, 43 (2016), 450. https://doi.org/10.1080/03019233.2015.1108480
- 14) J. A. de Castro, C. Takano and J.-i. Yagi: J. Mater. Res. Technol., 6 (2017), 258. https://doi.org/10.1016/j.jmrt.2017.05.007
- 15) H. Wang, M. Chu, C. Bi, Z. Liu and W. Dai: 8th Int. Symp. on High-Temperature Metallurgical Processing, Springer, Cham, (2017), 21. https://doi.org/10.1007/978-3-319-51340-9_3
- 16) J. Tang, M. Chu, F. Li, C. Feng, Z.-g. Liu and Y.-s. Zhou: Int. J. Miner. Metall. Mater., 27 (2020), 713. https://doi.org/10.1007/s12613-020-2021-4
- 17) A. Spanlang, W. Wukovits and B. Weiss: BHM Berg- Hüttenmänn. Monatsh., 165 (2020), 243. https://doi.org/10.1007/s00501-020-00963-6
- 18) J. Mathieson, H. Rogers, M. Somerville, P. Ridgeway and S. Jahanshahi: Proc. METEC InSteelCon 2011 Conf., Steel Institute VDEh, Düsseldorf, (2011), 1.
- 19) P. B. Abhale, N. N. Viswanathan and H. Saxén: Miner. Process. Extr. Metall., 129 (2020), 166. https://doi.org/10.1080/25726641.2020.1733357
- 20) J. G. Peacey and W. G. Davenport: The Iron Blast Furnace, Pergamon Press, Oxford, UK, (1979), 1.
- 21) A. Kemppainen, T. Alatarvas, M. Iljana, J. Haapakangas, O. Mattila, T. Paananen and T. Fabritius: ISIJ Int., 54 (2014), 801. https://doi.org/10.2355/isijinternational.54.801
- 22) K. Jacob and S. Seetharaman: Metall. Mater. Trans. B, 25 (1994), 149. https://doi.org/10.1007/BF02663188
- 23) S. Gupta, Z. Ye, R. Kanniala, O. Kerkkonen and V. Sahajwalla: Fuel, 113 (2013), 77. https://doi.org/10.1016/j.fuel.2013.05.074
- 24) M. Geerdes, R. Chaigneau, I. Kurunov, O. Lingiardi and J. Ricketts: Modern Blast Furnace Ironmaking, An Introduction, IOS Press, Amsterdam, (2015), 1.
- 25) M. Jampani, J. Gibson and P. C. Pistorius: Metall. Mater. Trans. B, 50 (2019), 1290. https://doi.org/10.1007/s11663-019-01538-8
- 26) S. Watakabe, K. Miyagawa, S. Matsuzaki, T. Inada, Y. Tomita, K. Saito, M. Osame, P. Sikström, L. S. Ökvist and J.-O. Wikstrom: ISIJ Int., 53 (2013), 2065. https://doi.org/10.2355/isijinternational.53.2065
- 27) K. Nakano, Y. Ujisawa, K. Kakiuchi, K. Nishioka, K. Sunahara, Y. Matsukura, H. Yokoyama, H. Sakai and R. Sugitani: 8th Int. Cong. on Science and Technology of Ironmaking (ICSTI 2018), (Vienna), ASMET, Leoben, (2018), 889.
- 28) K. Higuchi, S. Matsuzaki, K. Saito and S. Nomura: ISIJ Int., 60 (2020), 2218. https://doi.org/10.2355/isijinternational.ISIJINT-2020-063
- 29) S. Dutta and Y. Chokshi: Basic Concepts of Iron and Steel Making, Springer Nature, Singapore, (2020), 1.
- 30) Y. Qie, Q. Lyu, C.-c. Lan, S.-h. Zhang and R. Liu: J. Iron Steel Res. Int., 27 (2020), 132. https://doi.org/10.1007/s42243-019-00303-0
- 31) S. Dutta and Y. Chokshi: Basic Concepts of Iron and Steel Making, Springer Nature, Singapore, (2020), 89.
- 32) P. Bennett and T. Fukushima: 12th Int. Conf. on Coal Science (ICCS), Cairns, Australian Insitute of Energy, Perth, (2003), 1.
- 33) A. Rist and N. Meysson: J. Met., 19 (1967), 50. https://doi.org/10.1007/BF03378564
- 34) D. M. Kundrat, T. Miwa and A. Rist: Metall. Trans. B, 22 (1991), 363. https://doi.org/10.1007/BF02651235


