1. Introduction
Since nonmetallic inclusions have either a detrimental or a beneficial effect on the quality of steel, the control of inclusions in steel has been well concerned by steelmakers. On the one hand, effective utilization of fine oxides is conducive to the heterogeneous nucleation of transformation and precipitation,1,2) and the inhibition of austenite grain growth.3,4) On the other hand, the problem of nozzle clogging, for instance, is caused by the deposition of large-sized inclusions and clusters with high melting point on the inner wall of submerged entry nozzle, which leads to the unstable casting and causes the crack defects on slab.5,6,7,8,9) Therefore, the control of inclusions characteristics—such as chemical composition, number, shape and size distribution—is of great significant to improve the processing and properties of steel.
As an important alloying element in high-quality steel, rare earth (RE) has been widely used to improve the heat resistance, corrosion resistance and mechanical properties of products.10,11,12) However, the inevitable formation of RE-inclusions with high melting point can lead to serious nozzle clogging, which was mainly caused by the agglomeration of RE-inclusions and their clusters.13,14,15) Bi et al.16) and Nabeel et al.17) found large-sized RE-oxide clusters in stainless steel by using the electrolytic extraction method, and the number of these clusters increased with time. Moreover, the strong agglomeration behavior of RE-oxide and RE-aluminates inclusions in molten steel was observed in situ by confocal laser scanning microscopy (CLSM).18) In order to alleviate the harm of high melting point and large-sized inclusions in molten steel, the two methods of modifying them to liquid ones or to disperse ones are considered to be effective. In our earlier study,19) stable spherical SiO2–Al2O3–RE2O3 liquid inclusions were controlled in RE–Si–Al–O system. Besides Si and Al, Mg is a common deoxidizer in the steelmaking process, which is capable of modifying the original inclusions in molten steel. Many investigations have focused on modifying Al2O3 based inclusion to MgO·Al2O3 or MgO inclusions by magnesium treatment in recent years.20,21,22) More importantly, MgO-contained inclusions, viz., MgO·Al2O3 and MgO tended to disperse in molten steel, so as to attenuate the harm of large-sized Al2O3.23,24) By using CLSM observation, the agglomeration tendency of MgO-containing Aluminate inclusions was much weaker than that of pure Al2O3 inclusions owing to the poor attractive force among MgO-containing inclusions in molten steel.25,26,27,28) Inspired by the role of Mg in modifying inclusions, it is certainly worthwhile for industrial purpose if casting process and product quality of Al-killed RE-steel can be improved through from modifying RE-inclusions by Mg addition. Generally speaking, the evolution behavior of inclusions in molten steel is greatly affected by different addition amounts and order of deoxidizers. Specifically, if the addition conditions of Mg and RE are appropriate, large-sized RE-clusters can be modified to disperse MgO-containing inclusions. However, the evolution of inclusions composition and size distribution under different conditions of Mg and RE addition, especially the transformation from RE-inclusion to MgO-containing inclusion, has not been reported yet.
In the present work, Fe-21Cr-11Ni stainless steel was chosen as the target steel. The laboratory-scale experiments were carried out to reveal the effect of different Ce and Mg addition amounts and order on inclusions evolution in Al-killed molten steel. In order to investigate the composition, morphology, especially size changes of inclusions, the samples were taken at different time after Ce and Mg additions, and then were analyzed by scanning electron microscopy and energy dispersive spectroscopy (SEM-EDS), and the thermodynamics of the inclusions formation during co-deoxidation with Al, Mg and Ce was discussed in detail. Moreover, although the in-situ observation by CLSM mentioned above has revealed the role of Mg in refining inclusions, the transient evolution of RE-cluster modified by Mg was not be explored. A novel CLSM experiment was performed in this study to observe the evolution of cluster-like RE-inclusions in Mg-containing molten steel. The current study aims to develop a new method and a theoretical support for improving the nozzle-clogging problem and the product quality of RE-steel from the perspective of inclusion control.
2. Methodology
2.1. High-temperature Simulation Experiments
Five sets of laboratory-scale experiments (namely A, B, C, D and E) were performed in a MoSi2 furnace. Approximately 500 g raw materials with a fixed composition ratio were placed into a high-purity fused MgO crucible. The detailed process of experiments with different Ce and Mg addition order was provided through Figs. 1(a) to 1(c). The melt was heated to 1873 K (1600°C) under an argon atmosphere at a flow rate of 5.0 L·min−1 and was held for 30 min to achieve sufficient homogenization. In the experiment A, a certain amount of Al wire was added and kept for 30 min to deoxidize. Sample A-S1 was then taken by a quartz pipe and quenched in an ice bath, while Sample A-S2 was taken 30 min after the addition of Ni–Mg alloy, which was wrapped by iron sheet to avoid oxidation. It was noted that the melts after Al and Ce addition were held for 30 min to complete the reactions. Thereafter, Ce–Fe alloy was inserted into the melt, and two samples (A-S3 and A-S4) were taken at 5 min and 30 min after Ce addition. Compared to experiment A, experiments C and D were treated with Ce followed by Mg treatment. Experiment B can be regarded as the control group of experiment C and D, and was treated with the same amount of Ce without Mg treatment, then sampling at 5 min, 10 min and 30 min after Ce addition. Experiment E was carried out to prepare Mg-containing samples, which were only treated by Mg and was sampled in the next 30 min for subsequent CLSM experiment. The change of oxygen activity in melts during experiments was measured by an electrolyte oxygen probe, the method of which was introduced in the earlier work.23,42) Specifically, the first measurement of oxygen activity (a[O]1) was in the initial melt without deoxidation, the second a[O]2 was measured after Al deoxidation, then the final a[O]3 was measured after taking the last sample from the melts with Ce and Mg addition. The different addition amounts of Al, Ce and Mg in experiments and the measured oxygen activity are listed in Table 1.

Table 1. Addition amounts of deoxidizers and measured
activities of [O] during the experiments, mass%.
| Exp. | Addition Amount, mass% | Measured a[O], 10−6 |
|---|
| Al | Ce | Mg | Before Deoxidation (a[O]1) | After Al Deoxidation (a[O]2) | After Mg and Ce Addition (a[O]3) |
|---|
| A | 0.20 | 0.020 | 0.0020 | 69 | 4 | 3 |
| B | 0.20 | 0.015 | – | 71 | 5 | 3 |
| C | 0.20 | 0.015 | 0.0030 | 68 | 4 | 2 |
| D | 0.20 | 0.015 | 0.0070 | 67 | 5 | 1 |
| E | – | – | 0.0030 | – | – | – |
The samples taken during experiments were chosen to analyze compositions, which were determined using inductively coupled plasma-optical emission spectrometer (ICP-OES), and total oxygen level was measured by the inert gas fusion-infrared absorptiometry technique. The measured compositions including dissolve Al ([Al]), total Mg (T.Mg) and total Ce (T.Ce) in different melts are shown in Table 2, which is very close to their target contents in Table 1. The quenched iron samples were cross-sectioned and polished, for analyzing the morphology and chemical composition of the inclusions by SEM-EDS.
Table 2. Chemical analyses of experimental samples, mass%.
| Samples | Cr | Ni | [Al] | T.Ce | T.Mg | T.O | S |
|---|
| A-S1 | 20.70 | 10.60 | 0.191 | – | – | 0.0076 | 0.0028 |
| A-S2 | 20.60 | 10.90 | 0.194 | – | 0.0019 | 0.0075 | 0.0027 |
| A-S3 | 20.60 | 10.80 | 0.196 | 0.028 | 0.0018 | 0.0071 | 0.0032 |
| A-S4 | 20.80 | 10.50 | 0.195 | 0.022 | 0.0015 | 0.0064 | 0.0031 |
| B-S1 | 21.30 | 10.50 | 0.188 | – | – | 0.0067 | 0.0025 |
| B-S2 | 20.70 | 10.80 | 0.193 | 0.017 | – | 0.0074 | 0.0032 |
| B-S3 | 20.80 | 10.60 | 0.194 | 0.013 | 0.0001 | 0.0070 | 0.0027 |
| B-S4 | 21.30 | 10.80 | 0.194 | 0.015 | 0.0001 | 0.0066 | 0.0026 |
| C-S1 | 21.10 | 10.70 | 0.197 | – | – | 0.0072 | 0.0022 |
| C-S2 | 21.20 | 10.80 | 0.199 | 0.015 | – | 0.0070 | 0.0027 |
| C-S3 | 21.40 | 10.70 | 0.199 | 0.012 | 0.0029 | 0.0060 | 0.0031 |
| C-S4 | 21.50 | 10.50 | 0.202 | 0.011 | 0.0024 | 0.0053 | 0.0025 |
| D-S1 | 21.30 | 10.50 | 0.192 | – | – | 0.0066 | 0.0032 |
| D-S2 | 21.60 | 10.90 | 0.195 | 0.014 | – | 0.0076 | 0.0031 |
| D-S3 | 20.90 | 11.10 | 0.198 | 0.014 | 0.0072 | 0.0058 | 0.0027 |
| D-S4 | 21.20 | 10.80 | 0.200 | 0.013 | 0.0057 | 0.0057 | 0.0025 |
| E | 20.70 | 11.10 | 0.0020 | – | 0.0022 | 0.0039 | 0.0021 |
The in-situ observation of inclusions was carried out in CLSM (Lasertec VL2000DX), which is equipped with a He–Ne laser and an infrared image furnace. Prior to heating, the chamber was filled with Ar gas at a constant flow of 50 to 60 mL/min to evacuate the air. The temperature profile of experiments is shown in Fig. 2(a). First, the sample with RE-inclusions was heated to 1873 K (1600°C) with a heating rate of 300°C/min. After holding for 5 min, the heating power was directly turned off so as to quench the sample immediately, which was then processed to prepare for the following CLSM experiment of Mg treatment, and the processing method is showed in detail in Fig. 2(b). A large number of inclusions and agglomerated clusters were floated up to the sample surface. Thus the steel chips containing inclusion and clusters can be obtained by cutting the upper surface of this sample. Then these steel chips were placed on the surface of Mg-treated sample E, and the inclusion behavior was observed in-situ in the next 5 min (corresponding to the green dotted line in Fig. 2(a)), with the aim of observing the modifying process of clusters in Mg-containing molten steel.

3. Results and Discussion
3.1. Characteristics of Inclusions in Samples
To evaluate the variation of inclusion composition, the molar fractions of (Al2O3), (MgO), (Ce2O3) and (Ce2S3) in inclusions were normalized and plotted into Al2O3–MgO–Ce2O3–Ce2S3 and Al2O3–MgO–Ce2O3 diagram. Figure 3 shows the variation in composition of inclusions in the diagrams where the positions of MgAl2O4, CeAlO3 and Ce2O2S were stoichiometrically confirmed and were marked by arrows. Figure 4 presents the average molar contents change (mol%) of inclusions in samples. In experiment A, there are only Al2O3 inclusions in sample A-S1 after Al deoxidization. The content of (MgO) in the inclusions increased 30 min after the addition of Mg, and composition distribution of inclusions concentrated in MgAl2O4. After the addition of Ce–Fe alloy, the contents of (Ce2O3) and (Ce2S3) in inclusions increased, and the content of (MgO) decreased continuously. There were mainly CeAlO3 and Ce2O2S inclusions in sample A-S3. With the increase of holding time, (Ce2S3) was gradually replaced by (Al2O3) in inclusions. In sample A-S4, the main inclusions were transformed to CeAlO3. Al2O3 were modified to CeAlO3 inclusions by Ce addition in experiments B, C and D. For experiments C and D, after the addition of Ni–Mg alloy, the content of (MgO) increased and (Al2O3) content changed little, while (Ce2O3) in inclusions decreased from 52.8 to 9.7 mol% in experiment C, which caused most of the inclusions in sample C-S4 are MgAl2O4. In experiment D, the contents of (Ce2O3) and (Al2O3) in inclusions decreased to nearly zero in sample D-S4 added with Mg for 30 min, while the composition of inclusions mostly moved to the corner representing MgO. Moreover, the contents of [Al] in samples are also marked in Fig. 4. The variation tendency of [Al] contents with increasing holding time was opposite to that of (Al2O3) in inclusions, indicating that Al2O3-containing inclusions were modified to different ones with the addition of Ce and Mg.

Five typical homogeneous inclusions, viz., Al2O3, MgAl2O4, MgO, CeAlO3 and Ce2O2S, were observed among the samples taken from the four experimental melts. The morphology and EDS spectra of these inclusions are shown in Fig. 5. Al2O3 inclusions formed in each Al-deoxidized sample, they were irregular in shape and mostly distributed in large-sized clusters. Square-shaped CeAlO3 were the dominate inclusions in samples after Ce addition. Nearly spherical Ce2O2S was a kind of unstable inclusion, which mainly formed in sample A-S3 and then disappeared in sample A-S4. MgO–Al2O3 inclusions with irregular shape were mainly detected in the samples treated with Mg, such as A-S2, C-S3 and C-S4, while MgO inclusions were found in samples D-S3 and D-S4.

To further reveal the transformation behavior of inclusions, elemental mapping analyses for inhomogeneous inclusions were carried out using SEM-EDS, which can be regarded as the transient state during the transformation process of inclusions, as shown in Fig. 6. For experiment A, the complex inclusions with MgO–Al2O3 core surrounded by Al2O3–Ce2O3 were detected in sample A-S3, meanwhile, Ce2O2S wrapped by Al2O3–Ce2O3 phases were found in the same sample, as exampled in Figs. 6(b) and 6(c) respectively. A cerium-concentrated zone was formed at the initial stage after Ce addition, in which the content of Ce was much higher than the mean content. The unstable Ce2O2S inclusions formed in this zone and were further modified with the gradual homogenization of Ce content in molten steel, and similar experimental phenomenon has been reported in the earlier study.29) For experiments B, C and D, Fig. 6(a) shows the dual-phase inclusions composed of Al2O3 core wrapped by Al2O3–Ce2O3 ring existed in samples after Ce addition. After Mg addition, the complex inclusions shown in Fig. 6(d) that had Al2O3–Ce2O3 core with MgO–Al2O3 were found in samples C-S3 and C-S4. It can be seen in Figs. 3(c) and 4(c) that there were a small amount of (Ce2O3) left in inclusions of sample C-S4, which may be due to the insufficient kinetic conditions of modification reaction caused by the low Mg content of experiment C. Figure 6(e) shows the complex inclusions with Al2O3–Ce2O3 core surrounded by MgO existed in sample D-S4.

In order to assess the evolution mechanism of inclusions in Al-killed molten steel with Ce and Mg addition, thermodynamic calculation was carried out at 1873 K using FactSage 8.1. Firstly, the deoxidation equilibriums of Al, Ce and Mg were calculated in Fe-21Cr-11Ni-Al-Ce-Mg-O system as shown in Fig. 7, in which the change of oxygen activity listed in Table 1 was marked. It can be seen that the measured a[O] decreased significantly after Al deoxidation, which was caused by the formation of Al2O3. With Ce addition and the increase of Mg addition, the a[O] in the final melts decreased further. The measured value of oxygen activity was consistent with the calculated value, indicating that the deoxidation reactions in molten steel has reached equilibrium.

The stability diagram of the inclusions in molten steel has significant meaning not only in theoretical analysis but also in practical operations. Therefore, the stability diagrams of Mg–Al–O and Ce–Mg–Al–O–S system were calculated in the present study. Figure 8 presents the stability diagram of inclusions in Fe-21Cr-11Ni-Mg-Al-O melt. Al2O3, MgAl2O4 and MgO are in equilibrium with molten steel with the aluminum and magnesium contents ranging from 0.01 to 0.6 mass%, and 1 × 10⁻⁵ to 0.01 mass%, respectively. The stability phase regions show a good agreement with experimental data from the literatures.20,30,31) It can be seen that the transformation of inclusions is Al2O3 → MgAl2O4 → MgO with Mg content increases. When Al content increases from 0.01 to 0.6 mass%, more than 0.0002 mass% Mg is sufficient to transform Al2O3 into MgAl2O4 completely. The chemical composition of sample A-S2 in experiment A listed in Table 2 is in the phase region of MgAl2O4, which is consistent with typical inclusion in Al-killed A-S2 sample with Mg addition.

The stability diagram of Fe-21Cr-11Ni-0.2Al-0.003S-Mg-Ce-O melt at 1873 K (1600°C) was calculated to discuss evolution mechanism of inclusions and thermodynamic conditions of inclusions transformation, as shown in Fig. 9. MgAl2O4, MgO, CeAlO3 and Ce2O2S are formed in molten steel with the cerium and magnesium contents ranging from 0.001 to 0.1 mass%, and 1 × 10⁻⁴ to 0.01 mass%, respectively. It can be seen that the equilibrium relation assessed in the present work shows a good agreement with the experimental data of Yu et al.32) and Wang et al.33) The transformation process of inclusions is MgAl2O4/MgO → CeAlO3→ Ce2O2S with Mg content decreases and Ce content increases. The inclusions represented by adjacent phase regions can be transformed to each other. Note that the inclusions in the adjacent phase region can transform to each other by adjusting the addition amounts of Ce and Mg, and thus the thermodynamic conditions of these transformations can be discussed in the present study. When Ce content is > 0.001 mass%, the stable region of CeAlO3 appears, and when Mg content is < 0.0023 mass%, CeAlO3 is transformed to MgAl2O4 with the condition that Mg/Ce value is greater than 0.18. When Ce content is > 0.018 mass%, Mg content is > 0.0034 mass% and Mg/Ce value is approximately greater than 0.1, CeAlO3 directly transforms to MgO with Mg content increases. When Ce content is > 0.06 mass%, Ce2O2S is formed with Ce content increases.

In general, the transformation between the inclusions mentioned above is determined by different addition amounts of Ce and Mg. In the present work, the chemical compositions change of samples in Table 2 were marked in Fig. 9, and it can be concluded that the dominate inclusions detected in samples were in accordance with the thermodynamic calculation.
On the basis of experimental data analysis and thermodynamic calculations, the evolution behaviors of inclusions were summarized in Fig. 10. Since the measured oxygen activities after Al addition decreased to the deoxidation equilibrium curve shown in Fig. 7, Al2O3 inclusions were formed in all experiments. For experiment A, the addition order of deoxidizers was Al → Mg → Ce. After Mg addition, Al2O3 inclusions were transformed to MgAl2O4 inclusions by the reaction shown in Eq. (1).
|
3[
Mg
]+4A
l
2
O
3
(
s
)
=3MgA
l
2
O
4
(
s
)
+2[
Al
]
| (1) |
When Ce was added into melt, MgAl2O4 inclusions became unstable and gradually transformed to CeAlO3 inclusions as shown in Eq. (2), and CeAlO3 remained stable in the subsequent holding time.
|
4[
Ce
]+3MgA
l
2
O
4
(
s
)
=4CeAl
O
3
(
s
)
+3[
Mg
]+2[
Al
]
| (2) |
Meanwhile, a cerium-concentrated zone formed at the initial stage after Ce addition. It has been known from Fig. 9 that excessive Ce led to the formation of Ce2O2S inclusions. The unstable Ce2O2S formed in cerium-concentrated zone by the reaction shown in Eq. (3), and were subsequently transformed to CeAlO3 through Eq. (4) in the process of gradual homogenization of molten steel.
|
2[
Ce
]+2[ O ]+[ S ]=C
e
2
O
2
S(
s
)
| (3) |
|
[
Al
]+[ O ]+C
e
2
O
2
S(
s
)
=CeAl
O
3
(
s
)
+[
Ce
]+[ S ]
| (4) |
For experiments B and C, the addition order of deoxidizers was Al → Ce → Mg, Al2O3 was modified to CeAlO3 by the reaction shown in Eq. (5) after the addition of Ce. Subsequently, under the condition of low Mg content in experiment C, the great majority of CeAlO3 inclusions were gradually replaced by MgAl2O4 inclusions through Eq. (6). When the content of Mg was high in experiment D, CeAlO3 inclusions were directly transformed to MgO inclusions as shown in Eq. (7).
|
[
Ce
]+A
l
2
O
3
(
s
)
=CeAl
O
3
(
s
)
+[
Al
]
| (5) |
|
3[
Mg
]+2[
Al
]+4CeAl
O
3
(
s
)
=3MgA
l
2
O
4
(
s
)
+4[
Ce
]
| (6) |
|
3[
Mg
]+CeAl
O
3
(
s
)
=3MgO(
s
)
+[
Ce
]+[
Al
]
| (7) |
The types, numbers and planar size distribution of particles in a polished cross section of each sample were counted in this study. The total observation area of each sample was 6 mm2, which corresponded to 600 observation areas at the magnification of 2000 obtained by SEM. The size and number of inclusions (d>0.5 μm) were analyzed using an image analysis software of Image Pro Plus 6.0 for photomicrograph. Figures 11(a) and 11(b) present the change of size distribution and average size with various inclusions in samples. For experiment A, the inclusions size was refined after Mg addition caused by the in inclusions modification from Al2O3 to MgAl2O4, and the size of the latter was mostly distributed between 0.5 and 2 μm. After Ce addition, MgAl2O4 inclusions were replaced by CeAlO3 inclusions, and the number of inclusions with large size, especially the ones larger than 5 μm, were gradually increased. Correspondingly, the average size of inclusions in experiment A decreased first and then increased. Al2O3 was modified to CeAlO3 by Ce addition in experiment B, and the average size of inclusions to decrease first and then increase. For experiments C and D, CeAlO3 inclusions were further transformed to MgAl2O4 and MgO by the addition of Mg, which resulted in the increase of small-sized inclusions (<2 μm) and the decrease of large-sized inclusions (>5 μm), and the average size of inclusions in experiments C and D decreased from 3.12 μm and 3.28 μm to 1.99 μm and 1.83 μm, respectively. Moreover, Mg addition increased the number of inclusions in experiments C and D compared with those in experiment A, which can be explained by the decrease of measured oxygen activities shown in Fig. 7.

According to the results in Figs. 10 and 11, the compositions and sizes of inclusions were quite different when Mg and Ce were added in different addition amounts and orders. Ohta et al.34) found the difference in inclusions sizes in the case of various deoxidizers addition order but the same addition amount, and compositions of the final inclusions were similar, although they showed significant differences during inclusions modification process. Therefore, it is can be concluded that the addition amount of deoxidizer determines the composition of the final inclusion, while the evolution of inclusions compositions and the sizes depend on various addition orders of deoxidizers.
3.4. Evolution Behavior of Cluster-like CeAlO3 Inclusions
In order to further verify the role of Mg in modifying RE-inclusions, the transient evolution of inclusions clusters in Mg-containing molten steel was observed in-situ by CLSM. After 5 min of heating, pure cluster-like CeAlO3 inclusions can be taken from sample A-S4, and these clusters were placed on the surface of sample E containing Mg that preparing for subsequent observation. As shown in Fig. 12, two agglomerated and large-sized clusters P and Q in Fig. 12(a) were released from the steel chips located above the sample, and were exposed to the molten steel containing Mg. Then a small-size particle marked as P2 fell off from the initial cluster P within 3 seconds shown in Fig. 12(b). In the next 45 seconds, some other particles sequentially disaggregated from the clusters, resulting in the formation of particles P1, P2, P3, P4, Q1, Q2 and Q3 with smaller sizes, as shown in Figs. 12(c) through 12(f). The morphology and composition of typical inclusions or cluster in the quenched samples after observation were detected by SEM-EDS. Figure 13(a) shows the large-sized CeAlO3 cluster composed of numerous small-sized particles in sample A-S4. After modification by Mg, the dispersed MgO–Al2O3 became the dominate inclusions shown in Fig. 13(b). Meanwhile, the complex inclusion with Al2O3–Ce2O3 core wrapped by Al2O3–MgO shell was found in the same sample, which represented the transient evolution of RE-inclusions modified by Mg.


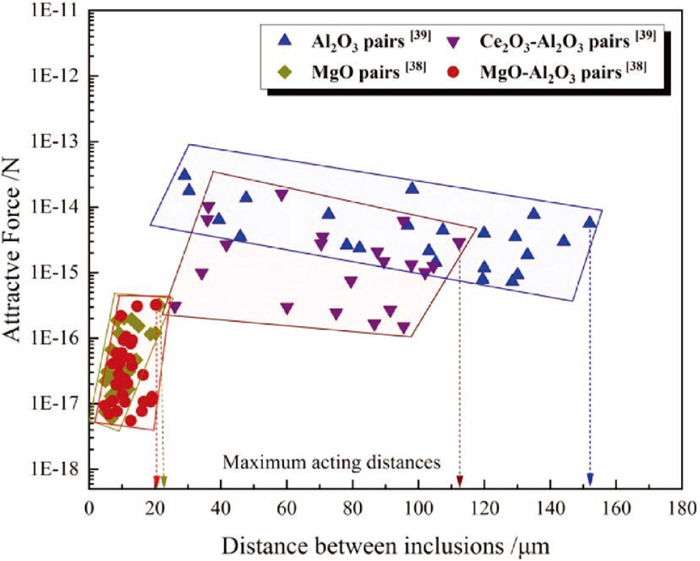
It is generally believed that the agglomeration behavior of inclusions is one of the main mechanisms leading to the formation of large-sized inclusions and clusters.35,36,37) The agglomeration characteristics of various inclusions have been investigated by in-situ observation combined with quantitative calculation.19,37,38) According to experimental data in these studies, the agglomeration ability of the inclusions is depicted in Fig. 14 including the data from the literatures,38,39) where the larger the attractive force and the maxing acting distance, the stronger the agglomeration ability between inclusions. It can be seen from the figure that the order of agglomeration ability between inclusions is Al2O3 > Ce2O3–Al2O3 > MgO–Al2O3 and MgO. Accordingly, although Ce addition can refine the inclusions in Al-killed melt, the formed CeAlO3 inclusions still have a strong agglomeration tendency resulting in size increase with time. Furthermore, the agglomeration ability of MgO–Al2O3 and MgO inclusions is quite similar, and attractive force of them is one to two magnitudes smaller than that between CeAlO3 inclusions. This is a major reason why the inclusions size was reduced by transforming CeAlO3 to MgO–Al2O3 and MgO.
To sum up, the large-sized Al2O3 and RE-inclusions are transformed to dispersed MgO-containing ones with the addition order of Al → Ce → Mg, and thus the formed inclusions with small sizes are not only beneficial to alleviate the nozzle-clogging problem, but also to be expected to play an important role in “oxide metallurgy”, and thereby improve microstructure and quality of steel.40,41) Therefore, this evolution of inclusions by Mg addition is one of the key factors to reduce the large-sized cluster in Al-killed RE-steel.


