Regular Paper
Swelling Pressure of Wet Rice Grains Estimated from Distribution Coefficients of Saccharides
2016 Volume 63 Issue 2 Pages 47-50

Details
2016 Volume 63 Issue 2 Pages 47-50
The apparent density and porosity of four rice cultivars, Koshihikari, Yumepirika, Habutaemochi, and Kitayukimochi, decreased and increased, respectively, with the increasing temperature in the range of 5 °C to 60 °C. Especially large changes in both apparent density and porosity were observed at 60 °C, which can be ascribed to the starch gelatinization of rice. The swelling pressures of wet rice grains were estimated to be 7.5, 6.3, 6.2, and 5.9 MPa at 25 °C for Koshihikari, Yumepirika, Habutaemochi, and Kitayukimochi, respectively, from the distribution coefficients of solutes with different molar volumes. Rice grains having higher amylose content exhibited a weak tendency toward higher swelling pressure. The distribution coefficients of fructose for the Koshihikari and Habutaemochi cultivars were larger at higher temperatures, but the temperature dependence of the swelling pressure was not significant for both cultivars. These results suggested that the increase in the distribution coefficient was caused by the gradual relaxation of the interior structure of rice with increasing temperature.
Seasoning or flavoring of foods is an important cooking operation. The distribution equilibrium of a seasoning between the cooking ingredient and liquid preparation determines the final concentration or content of the seasoning within the cooking ingredient, and the seasoning rate is controlled by the diffusion of the seasoning compound into the ingredient.
Food consists of a variety of polymers such as starches, proteins, and alginates, which are the main constituent polymers in rice, meat, and brown seaweed, respectively.1) These polymers are not similar in their chemical or electrical properties. Starches are comprised of glucose and are electrically neutral, while proteins are comprised of amino acids and are amphoteric and alginates are comprised of uronic acids2) and are anionic. Food polymers can form gel-like matrices during the cooking process after water addition or rehydration and then exhibit different properties. Starch, protein, and alginate gels are regarded as size exclusion resins, amphoteric-ion exchangers, and cation exchangers, respectively. On the other hand, although most substances used for seasoning food are low molecular-weight compounds, their chemical properties vary. Sucrose, sodium chloride, and acetic acid are typical seasonings used to enhance sweet, salty, and sour tastes, respectively. Sucrose is a non-electrolyte, sodium chloride is a strong electrolyte, and acetic acid is a weak electrolyte. Moreover, most bitter compounds are hydrophobic.3) As a result of these varied chemical properties, various kinds of interactions, such as size exclusion, electrostatic, and hydrophobic interactions, occur between the food matrix and seasonings during the cooking process. In order to establish reasonable cooking processes, an understanding of these interactions is required. Among the possible interactions, distribution of non-electrolytes into an electrically neutral matrix such as starch gel seems to be the most straightforward, and this type of interaction is examined in this study.
The swelling pressure of food matrix or gel plays an important role in the distribution of non-electrolytes into the matrix or gel.4) Pressure during cooking would be also an important factor affecting the distribution of seasonings during preparation of flavored rice. Rice grains differently rehydrated and swelled5) 6) However, the swelling pressure of rehydrated rice grains has not been estimated. In this context, we estimated swelling pressures of two cultivars of non-glutinous rice and two cultivars of sticky rice based on our previous study where the swelling pressure of starch gel was estimated from the distribution coefficients of non-electrolytes having different molar volumes.4)
Materials. Non-glutinous rice cultivars (called “Uruchi”), Koshihikari and Yumepirika, were harvested in Shiga and Hokkaido, respectively in 2013; sticky rice cultivars (called “Mochi”), Habutaemochi and Kitayukimochi, were also harvested in Shiga and Hokkaido, respectively, in 2013. All rice varieties were purchased at a local supermarket in Kyoto. Rice materials were preserved in a refrigerator (NC-ME31A, Nihon Freezer Co., Ltd., Tokyo) or a low-temperature room at 4 °C until use. Fructose, sucrose, raffinose pentahydrate, iodine, and invertase (solution) were purchased from Wako Pure Chemical Industries (Osaka, Japan). Potato amylose was obtained from Sigma-Aldrich Japan (Tokyo) and Fructose Assay kit (ENZYTEC® fluid D-Fructose) was obtained from J. K. International (Tokyo). α-Galactosidase was supplied by Amano Enzyme (Nagoya, Japan). All other chemicals were purchased from Wako.
Pretreatment of rice. Prior to experimental use, rice was washed as follows: approximately 20 mL of distilled water was poured onto 10 g of rice and gently stirred using a glass rod for 10 s. After discarding the water, this process was repeated twice with fresh distilled water. The washed rice was immersed in a large amount of distilled water for at least 2 h at a specific temperature using a water bath (Thermominder SM-05, Taitec Corporation, Saitama, Japan, at 25 °C to 60 °C, and Labbath LB-21 JR, Taitec, at 5 °C to 15 °C). The washed rice is hereafter referred to simply as ‘rice’.
Measuring apparent density and porosity of rice. The apparent density of the wet rice, ρapp (kg/m3), was measured pycnometrically. The pycnometer with rice was kept at a specific temperature (5-60 °C) for 30 min or longer. Prior to the measurement, the volume of the pycnometer at the specific temperature was calibrated using distilled water.
The wet rice was dried to a constant weight at 105 °C for 4 days using a DN-400 oven (Yamato Scientific Co., Ltd., Tokyo, Japan). The volumetric fraction of water within the rice was estimated from the difference in weight between the wet and dry rice and was regarded as the porosity of the rice, εp.
Estimation of swelling pressure of rice. The distribution coefficients of the different solutes into the rice were measured by an adsorption-desorption method. The wet rice (approximately 1.1 g) was precisely weighed and soaked in 30 mL of the appropriate solution. The solute concentration ranged from 5 to 150 mmol/L for fructose, from 10 to 50 mmol/L for sucrose and from 3 to 35 mmol/L for raffinose. The rice was incubated with solute for at least 5 h at a specific temperature of 5 °C to 60 °C to reach distribution equilibrium and was subsequently removed from the solution. The excess solution on the rice surface was blotted away using a Kimtowel paper (Nippon Paper Crecia Co., Ltd., Tokyo, Japan). The solute distributed into the rice was desorbed by soaking the rice in 10 mL of distilled water for at least 6 h at the same temperature as for soaking. The concentration of desorbed solute, Cd (mol/m3), was determined as follows: fructose concentration was determined using the fructose assay kit according to manufacturer’s protocol. Sucrose and raffinose were hydrolyzed using invertase and α-galactosidase as described previously,4) and the resulting fructose concentration was determined using the fructose assay kit.
Based on the mass balance for the solute before and after desorption, the apparent distribution coefficient, Kapp (−), of the solute into the rice was estimated by Eq. (1).
Cd=Kapp [(wr/ρapp)/Vd](C0-Cd) (1)
where C0 (mol/m3) is the solute concentration of the outer solution for adsorption, Cd (mol/m3) is the solute concentration of the outer solution after desorption, Vd (m3) is the volume of distilled water used for desorption, and wr (kg) is the weight of the wet rice. Plotting Cd against ((wr/ρapp)/Vd)(C0‒Cd) produced a straight line passing through the origin, and the Kapp value was obtained from the slope of the line.
The apparent distribution coefficient, Kapp, of a non-electrolyte having the partial molar volume, vs (m3/mol), onto a polymer matrix could be related with each other using a swelling pressure, Π (Pa), of the matrix by Eq. (2),7)
Kapp=γ0exp [-Πvs/(RT)] (2)
where R (J/(mol∙K)) and T (K) are the gas constant and absolute temperature, respectively. γ0 (−) is a parameter reflecting both steric effect of matrix skeleton on distribution of the solute, and the ratio of activity coefficient of the solute in outer solution phase to that in matrix phase. The Kapp values of fructose, sucrose, and raffinose were plotted against their molar volumes, which were used instead of their partial molar volumes, on the semi-logarithmic scale. The plots produce a straight line, and the Π value can be evaluated from the slope of the line.7) The molar volumes of fructose, sucrose and raffinose were 1.14 × 10⁻⁴, 2.20 × 10⁻⁴, and 3.25 × 10⁻⁴ m3/mol, respectively.8)
Measuring amylose content of rice. A simplified spectrophotometric method was applied to analyze the amylose content of rice.9) A rice sample was ground into a powder using a mortar and a pestle, and the powder (approximately 100 mg) was mixed with 1 mL of 95 % (v/v) ethanol and 9 mL of 1 mol/L sodium hydroxide in a test tube. The mixture was incubated for 10 min at 100 °C using an AHA hot plate (As One, Osaka, Japan), and then water was added to reach a final volume of 100 mL. Five mL of the solution was transferred into a clean test tube and was mixed with 1 mL of 1 mol/L acetic acid and 2 mL of iodine solution containing 0.2 % (w/v) iodine and 2 % (w/v) potassium iodide. Water was added to reach a final volume of 100 mL, and the absorbance of the solution was measured at 620 nm by using a UV-1200 spectrophotometer (Shimadzu Corporation, Kyoto, Japan). A calibration curve was prepared using potato amylose as a standard.
Apparent density and porosity.
Figure 1 shows the apparent density, ρapp, and porosity, εp, of Koshihikari and Habutaemochi cultivars, which are non-glutinous and sticky rice varieties, respectively, in the temperature range of 5 °C to 60 °C. The ρapp value of Koshihikari was higher than that of Habutaemochi at all temperatures; while the εp value of the former was lower than that of the latter. The temperature did not significantly affect the ρapp and εp values of either Koshihikari or Habutaemochi. However, the ρapp values slightly decreased and εp values slightly increased at 60 °C, indicating that both types of rice grains swelled at this temperature. Because the gelatinization temperature of rice starch is in the range of 60 °C to 75 °C,10) the significant changes in the ρapp and εp values at 60 °C can be attributed to starch gelatinization.

Temperature dependence of apparent density (circles) and porosity of rice (triangles).
Symbols represent apparent density of Koshihikari (open symbols) and Habutaemochi (closed symbols). Values obtained from triplicate measurements are represented as mean ± standard deviation.
Uruchi and Mochi rice types are distinguished by their different starch compositions, and the apparent amylose contents of Koshihikari, Yumepirika, Habutaemochi and Kitayukimochi were determined to be 23.0 % ± 0.4 %, 21.9 % ± 0.5 %, 6.2 % ± 1.1 %, and 5.8 % ± 0.2 % (mean ± standard deviation, n = 2), respectively. The ρapp and εp values at 25 °C are plotted against the amylose contents of the four cultivars in Fig. 2. The ρapp values were proportional to amylose content and εp values were inversely proportional to the amylose content. These tendencies are in accordance with the fact that starches from low amylose cultivars can accommodate more water.11)

Effects of apparent amylose content on apparent density (circles) and porosity (triangles) of rice at 25 °C.
Symbols from left to right represent Kitayukimochi, Habutaemochi, Yumepirika and Koshihikari, respectively. Apparent amylose content was measured in duplicate, and results are represented as mean ± standard deviation.
Swelling pressure of rice.
The apparent distribution coefficients (Kapp) of fructose, sucrose, and raffinose for Koshihikari and Habutaemochi cultivars were measured at 5, 25, and 50 °C. According to Eq. (2), the Kapp values are plotted against the molar volumes of the solutes on the semi-logarithmic scale to estimate the swelling pressures, Π, of the rice grains as shown in Fig. 3. The same plots were also made for Yumepirika and Kitayukimochi at 25 °C (data not shown). The plots gave straight lines for all the cultivars, and the Π values at 25 °C were evaluated to be 7.5, 6.3, 6.2, and 5.9 MPa for Koshihikari, Yumepirika, Habutaemochi, and Kitayukimochi, respectively. The rice with higher amylose content seems to have the higher swelling pressure. The Π values of the wet rice grains were much larger than that of tapioca starch gel, which was 1.1 MPa at 25 °C.4) The large Π value of the rice grains can be attributed to their varied composition.

Estimation of swelling pressures of Koshihikari (open symbols) and Habutaemochi (closed symbols) from the distribution coefficients of saccharides into rice at 5 °C (circles), 25 °C (triangles), and 50 °C (squares).
Temperature effects on distribution and swelling.
In order to examine the effect of temperature on swelling properties, the Kapp value of fructose was measured for Koshihikari and Habutaemochi cultivars from 5 °C to 60 °C (Fig. 4). Relatively large standard deviations at high temperatures might come from loss of macerated rice mass during adsorption and desorption. The Kapp value of fructose for Habutaemochi was higher than that for Koshihikari at all temperatures in this range. Similarly to the temperature dependencies of the ρapp and εp values shown in Fig. 1, the Kapp value gradually increased with increasing temperature in the range of 5 °C to 50 °C, but then rapidly increased at 60 °C. The rapid increase in the Kapp at 60 °C can be also attributed to the starch gelatinization of the rice. The temperature dependence of the Kapp value was analyzed in the rage of 5 °C to 50 °C based on the van’t Hoff’s equation (Eq. (3)).

Temperature dependence of distribution coefficient of fructose into Koshihikari (circles) and Habutaemochi (triangles).
Data is represented as mean ± standard deviation for measurements at five different concentrations.
d ln Kapp/d (l/T)=ΔH/R (3)
where ΔH (J/mol) is the enthalpy change for distribution. As shown in Fig. 4, the plots of the Kapp values against the reciprocal of the absolute temperature gave straight lines for both Koshihikari and Habutaemochi varieties, and the ΔH values were estimated to be 4.7 and 3.5 kJ/mol, respectively, from the slopes of the lines.
The Π values of Koshihikari and Habutaemochi were estimated from 5 °C to 50 °C, and are plotted against the reciprocal of the absolute temperature in Fig. 5. No significant temperature dependence was found for either Koshihikari or Habutaemochi. Equation (2) indicates that the Kapp vale of a solute depends on both the γ0 and Π/T values. Because the Π value did not significantly depend on the temperature, the Π/T value was smaller at higher temperatures. This would be a possible reason for the larger Kapp value of fructose at higher temperatures (Fig. 4). Another possible reason for the larger Kapp value is the change in γ0 with temperature. Figure 6 shows the temperature dependence of the γ0/εp value for Koshihikari and Habutaemochi cultivars. The γ0/εp value of less than unity suggests that the whole interior void is not available for the solute. However, the γ0/εp became larger at higher temperatures and approached unity for both the cultivars. This would indicate that the rice grain structure gradually loosens and the interior volume available for distribution of solute becomes larger with the increasing temperature. The relaxation of rice structure can account for the larger Kapp values at higher temperatures.

Temperature dependence of swelling pressure (circles) and Π/T value (triangles) for Koshihikari (open symbols) and Habutaemochi (closed symbols).
Error bars for swelling pressure represent 90 % confidence interval.
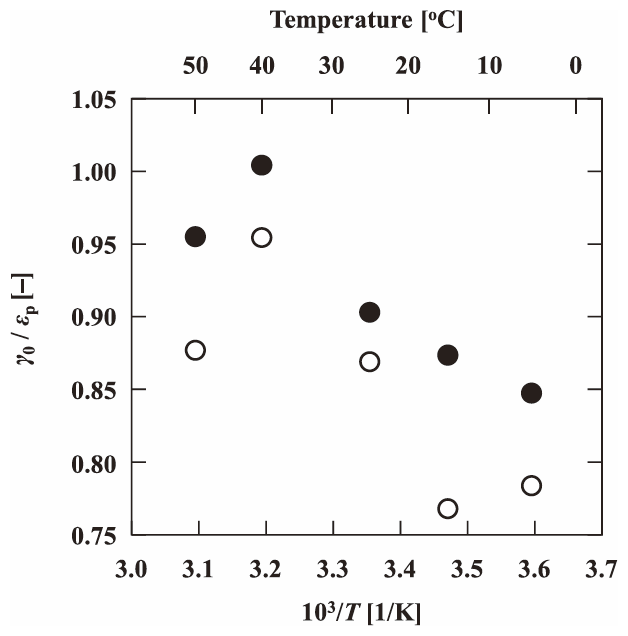
Temperature dependence of γ0/εp of Koshihikari (open circles) and Habutaemochi (closed circles).