Abstract
This article presents a density functional theory (DFT) study that explores the chemical interactions and mechanisms in Li/Na-MXene systems with the aim of improving the performance of rechargeable batteries. Experimental studies indicate the presence of chemical and physical adsorption mechanisms in these systems. To understand the interaction mechanisms in the charging/discharging process, we investigated the ion intercalation/adsorption process and the induced chemical shielding. Different possible surface terminations have been investigated to determine which type of interaction is more likely to exist at the interlayer surfaces. The DFT results obtained in this study suggested the use of various methods, such as surface modification and expansion of the interlayer distance, to enhance the energy storage performance; nuclear magnetic resonance measurements can be used to check whether the ideal surface modifications have been experimentally achieved.
1 Introduction
In recent years, concerns about the environmental effects of the global increase in energy consumption have caused increasing interest in renewable energy technologies from industry and academia. Renewable energy is mainly generated from inexhaustible resources such as sunlight, solar heat, and wind power, but these resources require a stable storage device for supplying energy during periods of unavailability. Secondary batteries are one of the candidates for energy storage; therefore, the development of technologies for large and affordable batteries is required for a society with sustainable energy [1,2,3].
The MAX phase is a generic term for compounds represented by the formula Mn+1AXn, where "M" represents the early transition metal, "A" represents about 10 elements centered on the 13/14 group, and "X" represents the elements N or C. The layered compound MXene, obtained from the MAX phase, has been attracting attention as a new negative electrode material in recent years [4]. So far, more than 60 compounds are known to have the MAX phase [4]. In 2011, Naguib et al. [5] reported that one of the MAX phases, Ti3AlC2, can undergo selective depletion of Al by treatment at room temperature, producing a layered compound of Ti3C2. Based on their finding, they used a layered Ti2C compound as the negative electrode material for a Li-ion battery. Their experiment showed a capacity of 110 mAh/g at a charge/discharge rate of 1 C, and in a later study, they showed a high cyclability value of 3C/10C [6]. The possibility of using MXene as a negative electrode material for Li/Na ion batteries is well established [7,8,9,10,11,12,13]. Wang et al. [14] investigated Li with MXene for batteries, and Lukatskaya et al. [15] used Na with MXene for a capacitor.
Despite the number of studies conducted on MXenes from both the experimental and theoretical viewpoints, the behavior of alkali cations in the processes of intercalation and de-intercalation remains unknown because the surface can be terminated by O, OH, or F groups, which complicates the chemical processes. In previous theoretical calculation studies, several surface adsorption models were presented; however, there are a few models that consider the dominant process of interlayer insertion [7, 8, 9, 13, 16]. Xie et al. [7] performed a computational study on the intercalation of Mg ions between stacked Ti2C layers. However, the system they studied considered surfaces that did not terminate with O, OH, or F groups. In any applications of MXenes, knowledge of the chemical termination of the surface is essential for performance prediction. In a first-principles calculation, Ashton et al. [17] compared the binding energies of O, OH, and F on MXene surfaces. MXenes are found to be highly stable when their surfaces are terminated with F.
Overall, the studies of MXene systems performed to date have considered intercalation, or the effect of termination, or a more realistic system where these are present simultaneously. The present study tried to model the insertion and adsorption processes of Li and Na ions for Ti2C using first-principles calculations. In addition, we compared the calculated chemical shielding and chemical shift extracted from nuclear magnetic resonance (NMR) measurements [18, 19] to understand the charging mechanism. Finally, using the combined results of the two parts of the study, we offer two methods that can potentially enhance the performance of MXene if used simultaneously.
2 Methodology
MXene models were constructed based on stacked layers of Ti2C [7]. DFT calculations were performed with the VASP-5.3.2 [20] package using the projector-augmented wave (PAW) method [21]. The Perdew–Burke–Ernzerhof generalized gradient approximation (GGA-PBE) functional [22] was used for the exchange correlation energy. For the unit cell of the bulk system, Ti4C2, a 12 × 12 × 3 k-point mesh, was used, and for the unit cell of the sheet structure, Ti2C, a 12 × 12 × 1 k-point mesh, was applied. For the sheet structure, slab models were considered with the lattice constant of 30 Å in the c-axis direction and ≈20 Å of vacuum between sheets. For the calculation of bulk O/F/OH-terminated systems, 2 × 1 × 1 and 2 × 2 × 1 supercells were considered with 6 × 12 × 3 and 6 × 6 × 3 k-point meshes. For the cutoff energy for planes, the wave basis was set at 520 eV. All of the atomic positions of all configurations and their cell vectors were fully relaxed, and the final force on each atom was less than 0.02 eV/Å.
For layered-structure materials, the van der Waals (vdW) force is critical because of the nonbonded interactions between the layers. Therefore, to consider the dispersion force, the DFT-D2 method [23] was adopted. Xie et al. [7] clarified the importance of the dispersion effect on the energetics of MXene materials using the optB86b density for the vdW interaction. In the present study, we compared the DFT results with and without dispersion correction. For charge distribution analysis, the Bader charge analysis [24] was used.
Optimization calculations for the bulk structure models, as well as for sheets with adsorbed Li and Na were performed with O/F/OH termination. Their stabilities were then compared by the formation energy, Eform, using equation (1):
| Eform=E(Ti2CT2)−E(Ti2C)−E(T2). | (1) |
Here, E(Ti2CT2) is the total energy of the terminated structure, E(Ti2C) is the total energy of the structure before termination, and E(T2) is the energy of the O2 molecule for the O-terminus and of the F2 molecule for the F-terminus; for the OH termination, the term represents half the sum of the energies of the O2 and H2 molecules. For the total energies of molecules and sheets, a cell size of at least 10Å was used in calculations to ensure that the interaction between molecules and sheets could be ignored.
To obtain the open-circuit voltage (OCV), equation (2) was used to approximate the value [25, 26]:
where ΔG is the difference in Gibbs energy before and after the reactions. The Gibbs energy difference was evaluated by equation (3):
Here, PΔV is neglected because of its small value (10-5 eV) and T is assumed as 0 K. Therefore, from the energy change ΔE, the voltage can be estimated by equation (4) [25]:
| V=E(AxTi2CT2)−{E(AyTi2CT2)+(x−y)E(A)}ne− | (4) |
Here, A stands for the active ion, Li or Na, E is the total energy of the ion-intercalated structure of each ion, and ne- shows the number of migrated electrons during the charge processes. When the number of Na/Li ions changed from x to y in the charge process, we considered that the number of migrated electrons was (x - y). In this paper, we calculated the voltages in the following three processes: from y = 0 to y = 0.5, from y = 0.5 to y = 1, and from y = 1 to y = 2 In addition, we estimated the specific weight capacities by the number of migrated electrons in each process. In the Ti2CT2 anode, the intercalation of x mol of Na/Li ions leads to AxTi2CT2. In this case, the required electricity amount can be expressed as xF, where F is the Faraday constant.
Changes in the chemical shift before and after ion insertion were investigated by calculating the chemical shielding of the solvated structure of alkali metal ions and of ions intercalated in MXene. For the solvent, ethylene carbonate (EC, C3H4O3) and a mixture of EC and diethyl carbonate (DEC, C5H10O3) at a 1:1 ratio was adopted, and the solvation number was set based on the study by Kamath et al. [27] After constructing the solvated structure, it was optimized by disposing of the molecules in a 12 × 12 × 12 Å supercell. For chemical shielding calculations, the gauge-including projector-augmented waves (GIPAW) method [28] was used. The energy cutoff was set at 600 eV and the values for the solvated structure were calculated only at the Γ point. For the solid-state chemical shielding calculation, i.e., the periodic crystals, energy minimization conditions were applied. The chemical shield tensor σ↔(r) calculated by the GIPAW method can be used as an index showing the magnitude of the shielding effect, and its average of diagonal terms σ= Tr [σ↔(r)]/3 can be compared with the experimentally measured values. The experimentally measured chemical shift has a linear relation with the theoretically calculated values of σ with a (−1) slope. However, in most cases, the change in this value is of interest. The change in chemical shift, δ, is obtained via:
where δ
abs/inter is the chemical shielding tensor of an alkali metal ion either intercalated into the MXene or adsorbed on its surface. The next term, δ
solv, is obtained from the chemical shielding tensor of the alkali metal ion solvated by EC or EC/DEC.
3 Results and Discussion
3.1 Intercalation systems
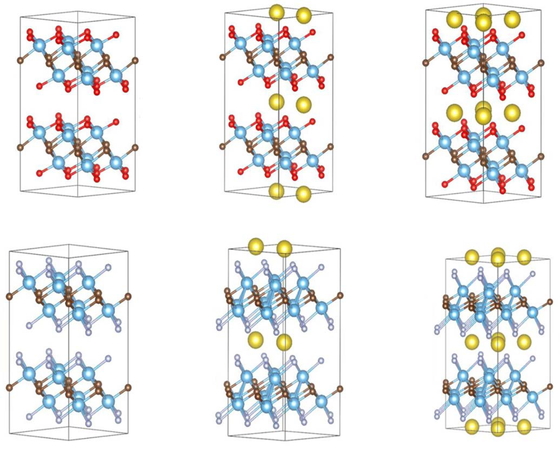
The calculated formation energies of the Na/Li-intercalated structures are shown in Table 1, and a few of these structures are shown in Figure 1. A number of structures with different locations of the adsorbed or intercalated ions were studied, and the most stable ones are reported here.
Table 1. Formation energies for the most stable structures in intercalation systems.
| Na | Li |
| Structure | Formation Energy [eV] | Structure | Formation Energy [eV] |
| Ti2CNa0.5 | 0.39 | Ti2CLi0.5 | 0.23 |
| Ti2CF2Na0.5 | -0.45 | Ti2CF2Li0.5 | -0.48 |
| Ti2CF2Na | -0.13 | Ti2CF2Li | -0.96 |
| - | - | Ti2CF2Li2 | -0.56 |
| Ti2CO2Na0.5 | -1.08 | Ti2CO2Li0.5 | -1.04 |
| Ti2CO2Na | -1.76 | Ti2CO2Li | -2.89 |
| Ti2CO2Na2 | -1.40 | Ti2CO2Li2 | -2.95 |
| Ti2C (OH)2Na0.5 | 0.39 | Ti2C (OH)2Li0.5 | 0.20 |
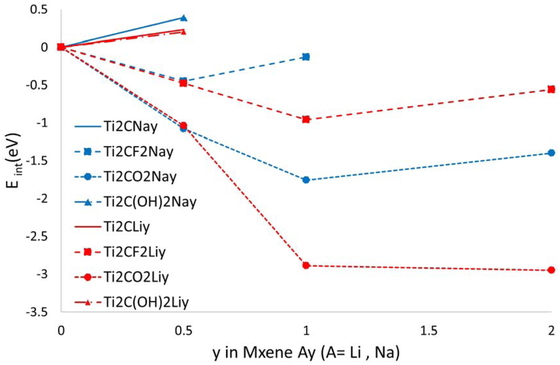
Based on the calculated energies, it became clear that for the bulk structures, structures terminating with O/OH/F were thermodynamically stable. However, for the structure without termination or terminated with OH, the Na ions might not be intercalated because of a positive formation energy. The results of the intercalation (intercalation energies) are plotted in Figure 2 for different systems. By contrast, the structure of the F-terminated MXene has a favorable formation energy of 0.5 eV per formula unit, and the O-terminated structure has an energy gain of almost 1 eV per Na ion per formula unit. This seemed to indicate that Ti2C could be easily terminated in the processes of treating Ti2AlC with hydrofluoric acid or washing with water. This is in agreement with the previous experimental and calculation results [5, 7].
The results of the Bader charge analysis on the most stable structures obtained are presented in Table 2. For the Na intercalation, its charge is equally distributed within the TiCT2 structure. Na is in the ionic state and its charges are 0.86 and 0.89 e in the thermodynamically stable states of TiCO2–TiCO2Na and Ti2CF2–Ti2CF2Na0.5, respectively. It was also observed that for the fully intercalated structures, the second Na/Li had a smaller charge.
Table 2. Bader charge analysis results for atoms in the Na/Li intercalation process.
| Structure | C | Ti-1 | Ti-2 | F-1 | F-2 | O-1 | O-2 | Na/Li-1 | Na/Li-2 |
| Ti2C | -2.17 | 1.08 | - | - | - | - | - | - | - |
| Ti2CO2 | -1.67 | 1.93 | - | - | - | -1.10 | - | - | - |
| Ti2CF2 | -1.89 | 1.70 | - | -0.75 | - | - | - | - | - |
| Ti2CO2Na0.5 | -1.74 | 1.86 | - | - | - | -1.24 | 1.18 | 0.87 | - |
| Ti2CO2Na | -1.80 | 1.79 | - | - | - | -1.31 | - | 0.84 | - |
| Ti2CO2Na2 | -1.80 | 1.77 | - | - | - | -1.36 | - | 0.60 | 0.38 |
| Ti2CF2Na0.5 | -1.95 | 1.59 | 1.56 | -0.83 | -0.81 | - | - | 0.89 | - |
| Ti2CF2Na | -2.02 | 1.45 | - | -0.88 | - | - | - | 0.89 | - |
| Ti2CLi0.5 | -2.07 | 0.96 | 0.70 | - | - | - | - | 0.81 | - |
| Ti2CO2Li0.5 | -1.74 | 1.86 | - | - | - | -1.18 | 1.25 | 0.90 | - |
| Ti2CO2Li | -1.80 | 1.78 | - | - | - | -1.33 | - | 0.89 | - |
| Ti2CO2Li2 | -1.84 | 1.70 | - | - | - | -1.49 | - | 0.84 | 0.58 |
| Ti2CF2Li0.5 | -1.95 | 1.57 | - | -0.84 | -0.81 | - | - | 0.91 | - |
| Ti2CF2Li | -2.01 | 1.44 | - | -0.89 | - | - | - | 0.91 | - |
| Ti2CF2Li2 | -2.00 | 1.46 | - | -0.95 | - | - | - | 0.85 | 0.14 |
Based on the results discussed, the amount of Na intercalation tended to be lower than that in the Li–MXene systems (see Figure 2). This could be due to the magnitude of the structural changes. The lattice distance, dl, and the terminal group distance, dt, are presented in Table 3. Because of its small ionic radius, the Li ion has a relatively smaller effect on the structure and does not change it much, with intercalation of up to one ion per formula unit. By contrast, the interlayer distance of the Na-intercalated MXene increases with ion insertion, and the correlation energy bonding of the layers becomes weaker; as a result, the structure becomes less stable and the number of ions that can intercalate in it is smaller than with Li. In addition, when the Na–MXene results were compared with the Bader charge analysis on Li (see Table 2), no significant difference in the charge distribution of each element was found. This observation indicates that it is not the electric charge factor that dominates the insertable amount of alkali metal ions in the structures with O- and F- termination, but rather structural factors are the main contributors.
Table 3. Interlayer distances (Å) for the O- and F- termination in intercalation systems; T stands for the termination atom (O or F).
| system | Ti2CT2 | Ti2CT2Na0.5 | Ti2CT2Na | Ti2CT2Li0.5 | Ti2CT2Li |
| dl | dt | dl | dt | dl | dt | dl | dt | dl | dt |
| O-termination | 7.52 | 3.08 | 8.14 | 3.44 | 8.01 | 3.23 | 7.51 | 2.94 | 7.45 | 2.67 |
| F-termination | 7.49 | 2.71 | 8.21 | 3.07 | 8.19 | 2.78 | 7.65 | 2.51 | 7.71 | 2.30 |
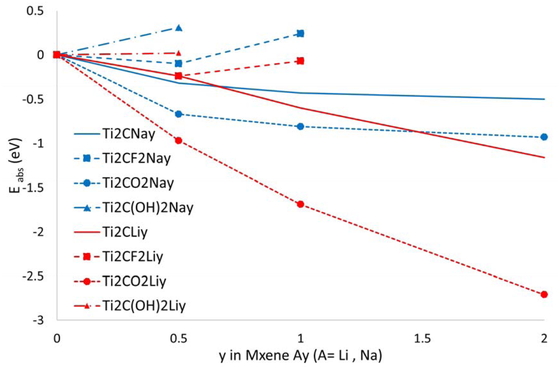
MXenes exist as dispersion-bound multilayer structures before being exfoliated into single sheets or becoming intercalated [17]. The formation energies of Na/Li for adsorption on MXene sheets are listed in Table 4 and plotted in Figure 3. Similar to the intercalation, neither Na nor Li ions were adsorbed on a surface with an OH-terminated structure. By contrast, in addition to the O and F terminations, the Na ion tended to be adsorbed on the surface of a bare structure with no termination. In addition, for both Na and Li ion adsorption, the maximum amount of adsorbed alkali metal ions was equal to the number of terminal O atoms on an O-terminated surface.
Table 4. Formation energy for the most stable structures in adsorption systems.
| Na | Li |
| Structure | Formation Energy [eV] | Structure | Formation Energy [eV] |
| Ti2CNa0.5 | -0.32 | Ti2CLi0.5 | -0.24 |
| Ti2CNa | -0.43 | Ti2CLi | -0.60 |
| Ti2CNa2 | -0.50 | Ti2CLi2 | -1.16 |
| Ti2CF2Na0.5 | -0.10 | Ti2CF2Li0.5 | -0.24 |
| Ti2CF2Na | 0.24 | Ti2CF2Li | -0.07 |
| Ti2CO2Na0.5 | -0.67 | Ti2CO2Li0.5 | -0.97 |
| Ti2CO2Na | -0.81 | Ti2CO2Li | -1.69 |
| Ti2CO2Na2 | -0.93 | Ti2CO2Li2 | -2.71 |
| Ti2C (OH)2Na0.5 | 0.31 | Ti2C (OH)2Li0.5 | 0.02 |
The results of the Bader charge analysis for the Na- and Li-adsorbed structures are listed in Table 5. Unlike the interlayer insertion case, the charge of the alkali metal ion during adsorption differed between Li and Na, with the latter having a slightly smaller charge than the former. Looking at the individual structures, Li donates its charges to Ti rather than charge-compensating the entire MXene when being adsorbed by a non-terminated structure. By contrast, for Na-adsorbed systems, the charge analysis showed that with Na adsorption, the charge compensation tended to occur over the whole MXene.
Table 5. Bader charge analysis results for atoms in the Na/Li adsorption process.
| Structure | C | Ti-1 | Ti-2 | F-1 | F-2 | O-1 | O-2 | Na/Li |
| Ti2C | -2.17 | 1.08 | - | - | - | - | - | - |
| Ti2CO2 | -1.67 | 1.93 | - | - | - | -1.09 | - | - |
| Ti2CF2 | -1.89 | 1.69 | - | -0.75 | - | - | - | - |
| Ti2CNa0.5 | -2.17 | 1.05 | 0.89 | - | - | - | - | 0.60 |
| Ti2CNa | -2.21 | 1.03 | 0.71 | - | - | - | - | 0.46 |
| Ti2CNa2 | -2.29 | 0.76 | - | - | - | - | - | 0.38 |
| Ti2CO2Na0.5 | -1.77 | 1.86 | - | - | - | -1.23 | -1.16 | 0.88 |
| Ti2CO2Na | -1.80 | 1.82 | - | - | - | -1.31 | -1.25 | 0.68 |
| Ti2CO2Na2 | -1.82 | 1.77 | - | - | - | -1.40 | - | 0.55 |
| Ti2CF2Na0.5 | -1.93 | 1.60 | - | -0.80 | -0.82 | - | - | 0.74 |
| Ti2CF2Na | -1.93 | 1.57 | 1.69 | -0.91 | -0.76 | - | - | 0.33 |
| Ti2CLi0.5 | -2.13 | 1.07 | 0.83 | - | - | - | - | 0.82 |
| Ti2CLi | -2.17 | 1.10 | 0.29 | - | - | - | - | 0.79 |
| Ti2CLi2 | -2.18 | 0.30 | - | - | - | - | - | 0.79 |
| Ti2CO2Li0.5 | -1.73 | 1.86 | - | - | - | -1.24 | -1.13 | 0.90 |
| Ti2CO2Li | -1.80 | 1.78 | - | - | - | -1.38 | -1.27 | 0.88 |
| Ti2CO2Li2 | -1.86 | 1.66 | - | - | - | -1.56 | - | 0.83 |
| Ti2CF2Li0.5 | -1.94 | 1.58 | 1.53 | -0.84 | -0.79 | - | - | 0.91 |
| Ti2CF2Li | -2.01 | 1.52 | 1.44 | -0.95 | -0.86 | | | 0.86 |
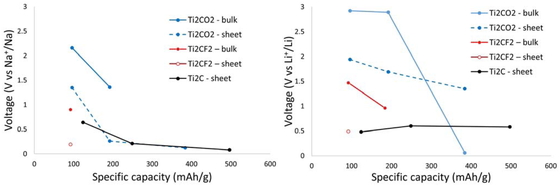
The predicted specific weight capacity and respective voltage are presented in Table 6. The relative voltage of each system vs Na+/Na for Na systems and vs Li+/Li for Li systems are plotted in Figure 4 as a function of their specific weight capacity.
Table 6. Theoretically obtained specific weight capacities and voltages.
| Na | Li |
| Systems | y | specific weight capacities [mAh/g] | voltages [V] | specific weight capacities [mAh/g] | voltages [V] |
| IntercalationTi2CO2 | 0.5 | 96 | 2.16 | 96 | 2.92 |
| 1 | 192 | 1.36 | 192 | 2.89 |
| 2 | - | - | 384 | 0.06 |
| AbsorptionTi2CO2 | 0.5 | 96 | 1.35 | 96 | 1.94 |
| 1 | 192 | 0.26 | 192 | 1.69 |
| 2 | 384 | 0.12 | 384 | 1.35 |
| IntercalationTi2CF2 | 0.5 | 92 | 0.90 | 92 | 1.47 |
| 1 | - | - | 184 | 0.96 |
| AdsorptionTi2CF2 | 0.5 | 92 | 0.19 | 92 | 0.49 |
| AdsorptionTi2C | 0.5 | 124 | 0.64 | 124 | 0.48 |
| 1 | 249 | 0.21 | 249 | 0.60 |
| 2 | 497 | 0.08 | 497 | 0.58 |
When Li and Ti2C are used as negative electrodes for Li–MXene in a Li ion secondary battery, the performance in intercalation is improved for the F-terminated as compared with the O-terminated MXene. However, when the terminal adsorption process is used, the performance is improved by controlling the terminal groups of Ti2C or Ti2CO2.
By contrast, when using Na–Ti2C as the negative electrode, two types of structures, Ti2CO2 and Ti2CF2, could be used for the interlayer insertion process; however, the O-terminated structure has good capacity because of the slightly higher voltage of 1.36 V. Because an F-terminated system can intercalate Na ions in batteries only up to y = 0.5, it has been shown that the use of this system for the intercalation mechanism is disadvantageous for Na–MXenes as negative electrodes. Overall, a structure with high capacity and high cycle characteristics can be obtained by justifying to the desired voltage, controlling an appropriate O to F termination ratio.
For the surface adsorption systems, it was shown that TiCO2 and Ti2C have high capacity because each system can adsorb two Na ions in its formula unit. In addition, the voltage is in a low region, and these structures are considered to be promising for use as the negative electrode of a Na ion secondary battery.
In summary, by controlling the structure, which has a wide interlayer distance with either O- or no termination, the performance of MXene as a negative electrode can be improved.
3.4 Chemical shielding of intercalation systems
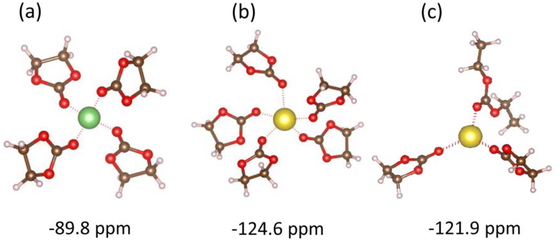
In this section, we initially model the possible solvated structure of alkali metal ions (Li, Na) in two electrolytes and then calculate their respective chemical shieldings. For comparison with the experimental results, this value needs to be compared with the chemical shielding of the ion when intercalated or adsorbed. To find the conformation of the solvated structures of the alkali metal ions, we started adding solvent molecules around the ion and allowed the system to minimize. The maximum number of solvent molecules with negative formation energies was considered as the solvated state. The conformation and respective chemical shielding (δsolv) of possible solvated Li and Na ions are presented in Figure 5. Li does not dissolve in EC/DEC, perhaps because its ionic radius is smaller than that of Na.
The calculation results for the chemical shielding (δinter) of intercalated systems obtained with the GIPAW method and the difference (δ) from that of their solvation are presented in Table 7. The chemical shifts are generally the result of differences in the magnitude of the shielding effect of the inserted alkali metal ions. Looking at the δinter values for each structure, the chemical shielding of the alkali metal ions inserted in an F-terminated structure was larger than that for an O-terminated structure. Generally, because F has higher electronegativity than O, the electron density around the alkali metal ion decreases and therefore, the anti-shielding effect and shielding value increase.
Table 7. Chemical shielding and shifts in intercalation systems.
| Systems | δinter [ppm] | Chemical shift δ [ppm] |
| EC solv. | EC/DEC solv. |
| IntercalationTi2C | Ti2CO2Li | -88.0 | +1.8 | - |
| Ti2CF2Li | -98.0 | -8.2 | - |
| Ti2CO2Na | -101.2 | +23.4 | +20.7 |
| Ti2CF2Na | -109.8 | +14.8 | +12.1 |
| IntercalationTi3C2 | Ti3C2O2Li | -86.5 | +3.3 | - |
| Ti3C2F2Li | -94.3 | -4.5 | - |
| Ti3C2O2Na | -97.1 | +27.5 | +24.8 |
| Ti3C2F2Na | -114.3 | +10.3 | +7.6 |
| Experiments20 | - | - | ~+14 |
The calculation results were then compared with the experimental values. In a previous study [19], the NMR spectrum of the Na ion was shown to shift by about 14 ppm between charging and discharging, that is, between solvation and interlayer insertion, which refers to the Ti3C2 MXene using EC/DEC as an electrolytic solution. This value is located between the calculated chemical shift with O-termination (+ 24.8 ppm) and the chemical shift of the F-terminus (+ 7.6 ppm). In other words, this result suggested that an MXene synthesized experimentally has a structure in which the O- and the F- terminuses are mixed between the layers.
3.5 Chemical shielding in adsorption systems
The calculated results of the chemical shielding for the adsorption system are presented in Table 8. Among adsorption systems, the value of the chemical shielding increased in all structures compared with the intercalated system; that is, the anti-shielding effect became stronger when the ions were adsorbed on the surface.
Table 8. Chemical shielding and shifts in adsorption systems.
| systems | δabs [ppm] | Chemical shift δabs [ppm] |
| EC solv. | EC/DEC solv. |
| Adsorption Ti2C | Ti2CO2Li | -98.3 | -8.5 | - |
| Ti2CF2Li | dissolved | - | - |
| Ti2CO2Na0.5 | -128.8 | -4.2 | -6.9 |
| Ti2CO2Na | -132.0 | -7.4 | -10.1 |
| Ti2CF2Na0.5 | -153.2 | -28.6 | -31.3 |
| Adsorption Ti3C2 | Ti3C2O2Li | -98.3 | -8.5 | - |
| Ti3C2F2Li | dissolved | - | - |
| Ti3C2O2Na | -157.9 | -33.3 | -36.0 |
| Ti3C2F2Na | -184.2 | -59.6 | -62.3 |
| Experiment20 | - | - | ~+1 |
Next, we compared the computational results with the experimental values [19]. In this study, in addition to the NMR spectrum of the Na ion during solvation and intercalation, a shift in which the Na ion was adsorbed on the surface and edge was obtained for the Ti3C2 MXene using EC/DEC as an electrolyte. The chemical shift at this time is shifted by about 1 ppm from that of solvation. This value is significantly different from those of O-termination (−36.0 ppm) and F-termination (−62.3 ppm). Kajiyama et. al. [19] showed that in a real system, the surface of an MXene is disordered, and there is a possibility that a defect might exist. Both curved MXene sheets and induced defects can contribute to a change in the shielding effect. Also, the presence of solvents on the surface of layered MXenes is well known, and their contribution to shielding is inevitable.
4 Conclusion
In this paper, the insertion and adsorption mechanisms of Li and Na ions in a group of Ti2C MXene structures were examined and compared using first-principles calculations.
It is well known that structures with a theoretically high capacity and low voltage are desirable. By using models for interlayer insertion and surface adsorption, the amounts of Na ions that can be intercalated in-between layers or adsorbed on the surface of the MXene were compared using the calculated energies. The stabilization energy of Na in the intercalation/de-intercalation process was slightly smaller than that of Li, and even in the case of an equal number of ions, the energy tended to be the same or lower. In particular, because of the larger ionic radius, the number of Na ions that can be inserted into the interlayer areas leads to larger structural changes compared with Li.
Based on the calculated results, the theoretical capacity and voltage were estimated and theoretical charge curves were predicted. From the viewpoint of high capacity and low voltage, it is disadvantageous to use the interlayer insertion structure control for an Na ion battery anode. By contrast, it was clarified that in the surface adsorption process, structures with O- and no termination showed better performance as negative electrode materials. From a theoretical viewpoint, the following two control points are important for improving battery performance. One is the control of termination with O- or no termination, and the other is the control of the interlayer distance to increase surface adsorption rather than intercalation.
To evaluate the synthesis of an MXene and its interlayer terminal groups that are difficult to identify experimentally, chemical shift measurement and calculation were proposed. To obtain the chemical shifts before and after insertion, a structure corresponding to the solvation number in a real system was modeled and the chemical shifts were compared with those of the intercalated structures. The experimental values were located between the calculated values of the chemical shifts with O- and F-termination for interlayer insertion. This seems to suggest that the interlayer terminating group of the MXene was a mixture of the O- and F-terminuses.
Overall, methods such as surface modification and expansion of the interlayer distance can be used to enhance the performance, whereas the NMR chemical shift can be used to determine whether the ideal surface modification was experimentally achieved.
Acknowledgment
This work was supported in part by Elements Strategy Initiative for Catalysts and Batteries (ESICB) of Ministry of Education, Culture, Sports, Science and Technology (MEXT), and Grants-in-Aid for Scientific Researches from Ministry of Education, Culture, Sports, Science and Technology, Japan. We also acknowledge support from the Institute for Molecular Science and a grant of CPU time from the Research Center for Computational Science.
References
- [1]
S. P. Ong, V. L. Chevrier, G. Hautier, A. Jain, C. Moore, S. Kim, X. Ma, G. Ceder, Energy Environ. Sci., 4, 3680 (2011). doi:10.1039/c1ee01782a
- [2]
K. Kuratani, N. Uemura, H. Senoh, H. T. Takeshita, T. Kiyobayashi, J. Power Sources, 223, 175 (2013). doi:10.1016/j.jpowsour.2012.09.039
- [3]
S. Komaba, W. Murata, T. Ishikawa, N. Yabuuchi, T. Ozeki, T. Nakayama, A. Ogata, K. Gotoh, K. Fujiwara, Adv. Funct. Mater., 21, 3859 (2011). doi:10.1002/adfm.201100854
- [4]
M. W. Barsoum, Prog. Solid State Chem., 28, 201 (2000). doi:10.1016/S0079-6786(00)00006-6
- [5]
M. Naguib, M. Kurtoglu, V. Presser, J. Lu, J. Niu, M. Heon, L. Hultman, Y. Gogotsi, M. W. Barsoum, Adv. Mater., 23, 4248 (2011). doi:10.1002/adma.20110230621861270
- [6]
M. Naguib, J. Come, B. Dyatkin, V. Presser, P. L. Taberna, P. Simon, M. W. Barsoum, Y. Gogotsi, Electrochem. Commun., 16, 61 (2012). doi:10.1016/j.elecom.2012.01.002
- [7]
Y. Xie, M. Naguib, V. N. Mochalin, M. W. Barsoum, Y. Gogotsi, X. Yu, K. W. Nam, X. Q. Yang, A. I. Kolesnikov, P. R. C. Kent, J. Am. Chem. Soc., 136, 6385 (2014). doi:10.1021/ja501520b24678996
- [8]
C. Eames, M. S. Islam, J. Am. Chem. Soc., 136, 16270 (2014). doi:10.1021/ja508154e25310601
- [9]
D. Er, J. Li, M. Naguib, Y. Gogotsi, V. B. Shenoy, ACS Appl. Mater. Interfaces, 6, 11173 (2014). doi:10.1021/am501144q24979179
- [10]
D. Sun, Q. Hu, J. Chen, X. Zhang, L. Wang, Q. Wu, A. Zhou, ACS Appl. Mater. Interfaces, 8, 74 (2016). doi:10.1021/acsami.5b0386326703113
- [11]
Q. Sun, Y. Dai, Y. Ma, T. Jing, W. Wei, B. Huang, J. Phys. Chem. Lett., 7, 937 (2016). doi:10.1021/acs.jpclett.6b0017126905961
- [12]
Y. Xie, Y. Dall’Agnese, M. Naguib, Y. Gogotsi, M. W. Barsoum, H. L. Zhuang, P. R. C. Kent, ACS Nano, 8, 9606 (2014). doi:10.1021/nn503921j25157692
- [13]
Y. X. Yu, J. Phys. Chem. C, 120, 5288 (2016). doi:10.1021/acs.jpcc.5b10366
- [14]
X. Wang, S. Kajiyama, H. Iinuma, E. Hosono, S. Oro, I. Moriguchi, M. Okubo, A. Yamada, Nat. Commun., 6, 6544 (2015). doi:10.1038/ncomms754425832913
- [15] [
M. R. Lukatskaya, O. Mashtalir, C. E. Ren, Y. Dall'Agnese, P. Rozier, P. L. Taberna, M. Naguib, P. Simon, M. W. Barsoum and Y. Gogotsi, Science (80-.)., 2013, 341, 1502–1505.
- [16]
Y. Xie, Y. Dall’Agnese, M. Naguib, Y. Gogotsi, W. Michel, H. L. Zhuang, P. R. C. Kent, ACS Nano, 8, 9606 (2014).
- [17]
M. Ashton, K. Mathew, R. G. Hennig, S. B. Sinnott, J. Phys. Chem. C, 120, 3550 (2016). doi:10.1021/acs.jpcc.5b11887
- [18]
M. A. Hope, A. C. Forse, K. J. Griffith, M. R. Lukatskaya, M. Ghidiu, Y. Gogotsi, C. P. Grey, Phys. Chem. Chem. Phys., 18, 5099 (2016). doi:10.1039/C6CP00330C26818187
- [19]
S. Kajiyama, L. Szabova, K. Sodeyama, H. Iinuma, R. Morita, K. Gotoh, Y. Tateyama, M. Okubo, A. Yamada, ACS Nano, 10, 3334 (2016). doi:10.1021/acsnano.5b0695826891421
- [20]
G. Kresse, J. Furthmüller, Phys. Rev. B, 54, 11169 (1996). doi:10.1103/PhysRevB.54.11169
- [21]
P. E. Blöchl, Phys. Rev. B, 50, 17953 (1994). doi:10.1103/PhysRevB.50.17953
- [22]
J. P. Perdew, K. Burke, M. Ernzerhof, Phys. Rev. Lett., 77, 3865 (1996). doi:10.1103/PhysRevLett.77.386510062328
- [23]
S. Grimme, J. Comput. Chem., 27, 1787 (2006). doi:10.1002/jcc.2049516955487
- [24]
R. F. W. Bader, Atoms in Molecules: A Quantum Theory., Oxford University Press, 1190.
- [25]
G. Ceder , M. K. Aydinol, A. F. Kohan, Comput. Mater. Sci., 8, 161 (1997). doi:10.1016/S0927-0256(97)00029-3
- [26]
M. K. Aydinol, A. F. Kohan, G. Ceder, K. Cho, J. Joannopoulos, Phys. Rev. B, 56, 1354 (1997). doi:10.1103/PhysRevB.56.1354
- [27]
G. Kamath, R. W. Cutler, S. A. Deshmukh, M. Shakourian-Fard, R. Parrish, J. Huether, D. P. Butt, H. Xiong, S. K. R. S. Sankaranarayanan, J. Phys. Chem. C, 118, 13406 (2014). doi:10.1021/jp502319p
- [28]
C. J. Pickard, F. Mauri, Phys. Rev. B, 63, 245101 (2001). doi:10.1103/PhysRevB.63.245101