Article
太平洋・日本パターンに関する新たな視点:ロスビー波の砕波によって引き起こされる事例の推定割合

2022 年 100 巻 1 号 p. 115-139

詳細
2022 年 100 巻 1 号 p. 115-139
This study quantitatively examined the relative importance of Rossby wave breaking (RWB) east of Japan to a formation of the Pacific–Japan (PJ) pattern compared with that of tropical atmospheric and oceanographic variabilities. First, cases of the positive and negative PJ patterns are classified into those with and without the RWB occurrence. The result of the classification indicates that the cases of the positive PJ pattern triggered by the RWB account for approximately 20 % of the whole cases of the positive PJ pattern. The number of positive PJ cases with the RWB further accounts for approximately 80 % of those in the cases associated with the RWB. Results of a lag composite analysis and the related Q-vector diagnosis for the cases of the positive PJ pattern with the presence of RWB show that the RWB east of Japan promotes the formation of the PJ pattern through the southwestward intrusion of high potential vorticity air mass toward the subtropical western North Pacific (WNP) and the consequent dynamically induced enhanced convection over the region, consistent with results of previous studies. By contrast, the composite for the cases the negative PJ pattern accompanied by the RWB indicates that the RWB-related upper-tropospheric zonally elongated anomalous circulation and basin-wide sea surface temperature (SST) warming over the Indian Ocean can contribute suppressed convective activities over the subtropical WNP and the consequent formation of the negative PJ pattern although the RWB occurs. The composite for the cases of positive and negative PJ patterns with the absence of RWB further indicates that the convective activities over the subtropical WNP move northwestward with time, causing the formation of the PJ pattern. The formation of the PJ pattern with the absence of RWB is also closely associated with tropical SST and phase of the boreal summer intraseasonal oscillation, illuminating “pure” tropical impacts on the formation of a PJ pattern.
Enhanced (suppressed) convection over the tropical western North Pacific (WNP) east of the Philippines is well known to be accompanied by anomalous cyclonic (anticyclonic) circulation near the Philippines and anomalous anticyclonic (cyclonic) circulation over Japan in the lower troposphere (Nitta 1987; Huang 1992). This teleconnection pattern is referred to as the Pacific–Japan (PJ) pattern (Nitta 1987). The lowerlevel southwest–northeast-oriented dipole anomalies with the phase of anomalous anticyclonic (cyclonic) circulation over Japan, which are hereafter referred to as the positive (negative) PJ pattern, can contribute to anomalous hot (cool) summer climates near Japan (Lu and Dong 2001; Wakabayashi and Kawamura 2004). Formations of the positive PJ pattern are closely associated with large-scale atmospheric and oceanographic variations such as active phases of the Madden–Julian Oscillation (MJO; Madden and Julian 1971) propagating around Southeast Asia (Molinari and Vollaro 2012, 2017), warm pools of sea surface temperatures (SSTs) over the tropical WNP (Nitta 1987; Huang 1992; Zhu et al. 2020), negative phases of El Niño–Southern Oscillation (ENSO; i.e., La Niña conditions) (Molinari and Vollaro 2017), and tropical cyclone activities (Kawamura and Ogasawara 2006; Yamada and Kawamura 2007; Ko and Liu 2016; Zhu et al. 2020). The formations of the negative PJ pattern, by contrast, are associated with preceding basin-wide SST warming over the tropical Indian Ocean associated with post-El Niño events (Xie et al. 2009; Wu et al. 2010; Kosaka et al. 2013) and local negative SST anomalies (e.g., Wang et al. 2000; Wu et al. 2010). Li et al. (2020) further showed that modulated periodicity of intraseasonal oscillation (ISO) due to the phase of ENSO can regulate the periodicity of the PJ pattern, which indicates a collaborated effect of the ENSO and ISO on the formation of a PJ pattern. These results indicate that the formation of a PJ pattern is closely tied to the tropical atmospheric and oceanographic variabilities.
Meanwhile, Takemura and Mukougawa (2020a) (hereafter referred to as TM20) revealed from a result of the lag composite analysis that Rossby wave breaking (RWB) east of Japan, which is preceded by Rossby wave packets propagating along the Asian jet (Lu et al. 2002; Enomoto et al. 2003; Enomoto 2004), can excite the formation of a positive PJ pattern via the upper-level southwestward intrusion of high potential vorticity (PV) air mass and the consequent enhanced convection over the subtropical WNP. TM20 also indicated from a Q-vector diagnosis (e.g., Hoskins et al. 1978; Holton 1992) that the enhanced convection over the subtropical WNP is promoted by dynamically induced ascent associated with the upper-level southward intrusion of the high-PV air mass. Their result provides a new perspective that the formation of a PJ pattern can be excited not only by tropical atmospheric and oceanographic variabilities but also by the extra-tropical ones. Takemura et al. (2020) showed a significant increase in RWB frequency over the region from Japan to the east in boreal summer during La Niña years. They further proposed the associated mechanism of the increased RWB frequency over the region that an enhanced Walker circulation and the consequent northward shift of the Asian jet due to a La Niña condition can provide a favorable condition of the frequent RWB and positive PJ pattern. This process represents a remote influence of the tropical oceanographic and atmospheric variabilities on the RWB frequency through a modulated Asian jet. Although the abovementioned results suggest a non-negligible role of the extra-tropical atmospheric variability in the formation of the positive PJ pattern, what percentage of the positive PJ pattern the RWB can trigger has not been revealed. An estimation for a proportion of the PJ pattern caused by the RWB will enable us to elucidate the relative importance of the extra-tropical atmospheric variability to the formation of the PJ pattern compared with that of the tropical one. The cases of the PJ pattern without the association of the RWB may further illuminate tropical impacts such as the anomalous SST and the ISO, particularly the boreal summer ISO (BSISO; e.g., Kikuchi et al. 2012; Lee et al. 2013).
According to the aforementioned perspective, the present study quantifies estimated ratios of the positive and negative PJ pattern with and without the RWB east of Japan and conducts lag composite analyses for the classified cases of the PJ pattern. This approach will highlight the dynamical process for the formation of the PJ pattern shown in TM20 and provide us with further understanding of various types of the PJ pattern.
The paper is arranged as follows. In Section 2, the dataset and analysis methods are described. The climatological relationship between periods for the extracted cases of the PJ pattern and Baiu seasons over mainland Japan is briefly presented in Section 3. In Section 4, the cases of positive and negative PJ patterns are classified into those with and without the RWB occurrence and an estimated percentage of the positive PJ pattern associated with the RWB is quantified. In Sections 5, 6, 7, and 8, the results of the lag composite analyses for the classified four types of cases are presented and the features of anomalous atmospheric and oceanographic conditions promoting the formation of the PJ pattern are discussed. In Section 9, a ratio of the positive PJ pattern that is mainly triggered by the RWB due to the Rossby wave propagation along the Asian jet is estimated. Finally, the main findings in this study are summarized in Section 10.
To analyze atmospheric circulation, we used monthly and daily mean datasets of the Japanese 55-year reanalysis (JRA-55) for June–September (JJAS) during a 61 year period, that is, from 1958 to 2018, with a horizontal resolution of 1.25° and 37 pressure levels from 1000 to 1 hPa (Kobayashi et al. 2015). To analyze the SST, we also used the daily mean dataset of COBE-SST (Ishii et al. 2005) for JJA during the 61 year period, with a resolution of 1°. Here, the anomaly is defined as a departure from the climatology, which is obtained as a 60 day low-pass (Lanczos; Duchon 1979) filtered 30 year daily averages from 1981 to 2010. A 5 day running mean is applied to the daily data to extract low-frequency components including the quasi-stationary Rossby wave. To exclude disturbances with horizontal scales smaller than synoptic eddies, we applied a horizontal smoothing filter to relative vorticity fields using a triangular truncation retaining N = 24 wavenumbers (T24). We defined SST deviations as the anomalous SSTs subtracted by an area average between 25°S and 25°N to simply exclude warming trends of anomalous SSTs in the tropics. We assessed statistical significances of the composite anomalies and deviations using a two-tailed Student's t test. The variable t is defined as t =  , where x′̅ is the composite anomalies and deviations, σ is the standard deviation, and N is the number of cases. The variable t obeys a Student's t-distribution with N − 1 degrees of freedom.
To infer convective activities in the tropics, we used convective precipitation of the JRA-55, which is derived from a cumulus convection scheme in the reanalysis. We compared the climatology of the convective precipitation and the CPC Merged Analysis of Precipitation (CMAP) to examine the validity to use convective precipitation (Xie and Arkin 1997). The distribution of the convective precipitation in the subtropical WNP is quite similar to that of the CMAP (not shown), indicating the validity to use the convective precipitation.
The propagation of quasi-stationary Rossby wave packets is analyzed using the wave activity flux (WAF) defined by Takaya and Nakamura (2001). The horizontal WAF is defined as follows:
 |
Vertical motion induced under the quasi-geostrophic balance, which is hereafter referred to as dynamically induced ascent, is diagnosed using the Q-vectors defined in Eq. (2b) to assess the dynamical relationship between the southwestward intrusion of a high-PV air mass associated with the RWB and enhanced convection over the subtropical WNP. The conventional diagnostic equation for the vertical motion (i.e., the ω equation) is written as follows:
 |
 |
We conducted an absolute vorticity budget analysis to assess the upper-level high-PV intrusion toward the subtropical WNP caused by the RWB. In the pressure coordinate, the anomalous absolute vorticity advection by horizontal winds in the primitive equation is expressed as follows:
 |
We applied an empirical orthogonal function (EOF) analysis to 850 hPa relative vorticity between [0–60°N, 100–160°E] (a region shown in Fig. 1) for the period of July–August from 1958 to 2018 to extract the PJ pattern. Although this is based on the method of Kosaka and Nakamura (2011), Kosaka et al. (2013), and Srinivas et al. (2018) who utilized the monthly mean, the present study used the 5 day running mean to analyze the sub-monthly atmospheric variability associated with the PJ pattern. Figures 1a and 1b show the first and second modes of the EOF pattern normalized by their standard deviations of principal components during the period of July–August from 1958 to 2018, which are hereafter referred to as EOF1 and EOF2, respectively. The variance fractions explained by the EOF1 and EOF2 are 21.8 % and 16.2 %, respectively. The EOF1 and EOF2 clearly represent meridional wave trains with a phase difference of 90°, and the EOF1 pattern well corresponds to the PJ pattern. The EOF2 pattern, by contrast, is quite similar to the Mariana–Bonin pattern defined by Machimura et al. (2016). Hereafter, the PJ index defined by the daily PC1 scores is used to identify the PJ pattern. Figure 1c presents a power spectrum of the daily PJ index in July–August during a 61 year period from 1958 to 2018. The 61 year average of the spectrum of the PJ index (black thick line) has a modest peak at 20–40 days, exhibiting the dominant intraseasonal variability. Figure 1d further presents an interannual timeseries of the July–August mean PJ indices during the 61 year period. The monthly mean PJ indices show large interannual variability, consistent with Kawamura et al. (1996) and Yang et al. (2010).

(a) First and (b) second modes of an empirical orthogonal function (EOF) analysis for 5 day running mean 850-hPa relative vorticity between [0–60°N, 100–160°E] (a region shown in the figures) for the period of July–August from 1958 to 2018. The EOF patterns are normalized by the standard deviations of principal components during the period. Solid and dashed contours denote the positive and negative anomalous vorticities with intervals of 0.5 × 10⁻⁶ s−1, respectively. Variance fractions of the two modes are shown at the top of each panel. (c) Power spectrum of daily PJ indices during a period from 1 July to 31 August. Gray thin lines denote the spectrum in each year from 1958 to 2018. Black thick line denotes the averaged spectrum during a 61 year period from 1958 to 2018. (d) Interannual timeseries of the July–August mean PJ indices averaged during the 61 year period (black line). Black dashed line and gray shading denote the 61 year average of the PJ index and the standard deviation, respectively.
Cases of the PJ pattern with smaller PJ indices are excluded when two peaks of the PJ index are detected within 10 days to prevent overlapping between periods of two cases in the lag composite analysis. To conduct the lag composite analysis, 116 and 114 cases of positive and negative PJ patterns are extracted (red and blue circles in Figs. 2a, b) with the PJ indices larger than a threshold of +2 and smaller than that of −2. Here, the threshold value of 2 for the PJ index is defined to extract several strong cases enough to accomplish the composite analysis. Table 1 shows the numbers of extracted PJ patterns when the threshold value of the PJ index is slightly altered from 2. The number of cases is almost the same when the threshold value is 1.5, whereas the number of cases drastically decreases when the threshold value is 2.5. A central date of the case of the PJ pattern is defined as “day 0” in the lag composite analysis. The cases of positive (negative) PJ pattern are hereafter referred to as PJ+ (PJ−) cases, which have a phase of cyclonic (anticyclonic) circulation anomalies northeast of the Philippines and anticyclonic (cyclonic) ones near Japan, respectively. The composite signals of Rossby wave trains along the Asian jet will apt to become vague because of phase inconsistency among the wave trains. We calculated the composite of 200 hPa anomalous kinetic energy derived from anomalous zonal and meridional winds to represent the composite activity of the Rossby wave trains.

Central dates (i.e., day 0) of extracted (a) PJ+ and (b) PJ− cases (red and blue colored circles) in July–August during 61 year period from 1958 to 2018. Green bars denote the Baiu period over Kanto/Koshin district in Japan during the 61 year period, except in 1993 when the withdrawal of Baiu was not identified.

To represent whether the RWB east of Japan occurs or not in the PJ+ and PJ− cases, the RWB index is defined as a difference in the area averages of potential temperature (unit: K) on the dynamical tropopause defined by two PV units (PVUs) between [30–45°N, 150–170°E] (red box in Fig. 3) and [15–30°N, 150–170°E] (red dashed box in Fig. 3). These regions used to calculate the RWB index are based on TM20 (Fig. 10d in their paper). A positive RWB index indicates an occurrence of the RWB with reversal of the meridional gradient of 2-PVU surface potential temperature (Pelly and Hoskins 2003) east of Japan. Hereafter, the PJ+ (PJ−) cases with the RWB index greater than 0 K (i.e., a blocked flow) and less than 0 K (i.e., a zonal flow) are classified into WB/PJ+ (WB/PJ−) and ZN/PJ+ (ZN/PJ−) cases, respectively.

Regions to evaluate the RWB index (red-colored solid and dashed boxes) and those to calculate area average over the subtropical western North Pacific (green-colored box) and over the east of Japan (purple-colored box). Light-green and blue shadings denote the regions to calculate zonal and meridional components of vertically averaged WAFs, respectively. See text for the definition of the RWB index and the vertically averaged WAFs. Contour denotes the monthly mean climatological stream function at 200 hPa in July–August with the interval of 10 × 106 m2 s−1.
This section briefly presents a correspondence between the central dates (i.e., day 0) of the extracted PJ+ and PJ− cases and Baiu period over mainland Japan in order to grasp the climatological features for the period of the extracted PJ pattern and its association with seasonal transitions from early summer to midsummer. The Baiu is a rainy season in early summer, which is climatologically experienced by most parts of Japan. Green bars shown in Fig. 2 indicate the Baiu period over Kanto/Koshin district in Japan except for 1993 when the Baiu season did not withdraw associated with a cold and unseasonable summer season. The dataset to specify the Baiu period is available on the Japan Meteorological Agency (JMA)'s website. Note that the Baiu period is operationally specified by JMA, according to the seasonal transition of the atmospheric circulation and weather over each region in Japan. Most of the PJ+ cases (red circles in Fig. 2a) are identified after the Baiu period or immediately before the post-Baiu season, except for several years such as 1974, 2006, and 2016. This feature implies that the PJ+ cases are associated with hot conditions near Japan in boreal summer (Wakabayashi and Kawamura 2004) and withdrawals of the Baiu season (Suzuki and Hoskins 2009). By contrast, the PJ− cases (blue circles in Fig. 2b) are identified not only during the boreal summer season but also during the extended Baiu season in July, consistent with the prolonged Baiu and unseasonable weather in the boreal summer season (Nitta 1987; Lu and Dong 2001).
Figure 4 shows a scatter diagram of the PJ index on day 0 and the RWB index on day −2 for the extracted PJ+ and PJ− cases. Here, the RWB index on day −2 is used according to the result of TM20, who showed from a lag composite analysis of the RWB cases that the amplitude of the positive PJ pattern attains its maximum 2 days after the peak of RWB (Figs. 10b, c in their paper). A number of the WB/PJ+ cases (31 cases; red closed circles), which are the PJ+ cases associated with the RWB, is much larger than that of the WB/PJ− cases (nine cases; blue closed circles), which are the PJ− cases accompanied by the RWB. The number of the WB/PJ+ cases thus accounts for approximately 80 % of the number of the PJ cases associated with the RWB (i.e., red and blue closed circles). Approximately 65 % of the WB/PJ+ cases occur in August, which corresponds to midsummer near Japan. A histogram of the RWB index for the PJ+ and PJ− cases shown on the right of the scatter diagram in Fig. 4 further indicates that the RWB indices for the PJ+ cases are larger than those for the PJ− cases. The averaged RWB index for the PJ+ cases is significantly larger than that for the PJ− cases at a confidence level of 99 %, indicating that the PJ+ cases are more frequently accompanied by the RWB. The significant asymmetry between the PJ+ and PJ− cases with the presence of RWB indicates that the RWB east of Japan favors the PJ+ cases, consistent with the result of TM20. By contrast, a number of the ZN/PJ+ cases (85 cases; red opened circles), which are the PJ+ cases with the absence of RWB, is smaller than that of the ZN/PJ− cases (105 cases; blue opened circles), which are the PJ− cases with the absence of RWB.

A scatter diagram between the PJ index on day 0 and the RWB index on day −2 (unit: K) for extracted PJ+ (red circles) and PJ− (blue circles) cases. Gray shading denotes a range of the PJ index from −2 to +2. Red closed, blue closed, red opened, and blue opened circles indicate WB/PJ+, WB/PJ−, ZN/PJ+, and ZN/PJ− cases, respectively. A figure on the right shows a histogram of RWB indices normalized by the sample number with a class width of 2.5K for the PJ+ (red bars) and PJ− (blue boxes) cases.
Furthermore, the number of WB/PJ+ cases accounts for approximately 30 % of that in the whole PJ+ cases (i.e., red closed and opened circles), suggesting that a percentage of the PJ+ cases accompanied by the RWB cannot be ignored and that the RWB is one of the factors for the formation of the positive PJ pattern. The number and estimated proportions of the PJ+ and PJ− cases with and without the RWB are similar even if the date to evaluate the RWB index is altered from day −3 to day 0, as shown in Table 2. Note that the WB/PJ+ case may include not only the cases in which the RWB promotes the formation of the positive PJ pattern but also those in which the positive PJ pattern conversely causes the RWB-related upper-level anticyclonic anomaly to the east of Japan. The proportion of the PJ+ cases triggered by the RWB to the entire WB/PJ+ cases will be estimated in Section 9 based on vertically averaged WAF.

This section shows the results of lag composite analyses for the four types of PJ cases defined in Sections 2 and 4 to examine anomalous atmospheric circulations. The composites for the WB/PJ+, WB/PJ−, ZN/PJ+, and ZN/PJ− cases are shown in Subsections 5.1, 5.2, 5.3, and 5.4, respectively.
5.1 WB/PJ+ caseFigure 5 shows the composite of the upper- and lower-tropospheric vorticity anomalies, 360 K PV, and anomalous convective precipitation on days −6, −4, −2, and 0 for the 31 WB/PJ+ case. The existence of dots in Figs. 5a and 5d along the Asian jet over midlatitude Eurasia indicates that the Rossby wave propagation in the upper troposphere is enhanced during a period from day −6 to day −4, with significant vorticity anomalies over there (contours in Figs. 5a, d). The wave energy accumulates east of Japan near the Asian jet exit region and causes the RWB over the region from day −4 to day −2 (Figs. 5d, g). The direction of the Rossby wave propagation east of Japan is southeastward (vectors in Figs. 5a, d, g). Conversely, the Rossby waves propagate along the Asian jet over the regions with dots in Fig. 5 where the activity of the Rossby waves is enhanced. These features imply that the Rossby waves propagate eastward through the Asian jet waveguide with refracting surfaces (e.g., Hoskins and Ambrizzi 1993). The RWB is accompanied by an amplified anomalous anticyclone east of Japan and an anomalous cyclone to the south in the upper troposphere (Figs. 5d, g). In the same period, the PV at 360 K east of Japan clearly presents an “inverse-S” shaped overturning associated with the occurrence of RWB over the region, with a northeastward intrusion of low PV air mass and a southwestward intrusion of high-PV air mass toward the subtropical WNP, respectively (contours in Figs. 5e, h). The southwestward intruding high-PV air mass is accompanied by a rapid enhancement of convective activities over the subtropical WNP near a latitudinal band of 20°N after day −4 (color shadings in Figs. 5e, h, k).
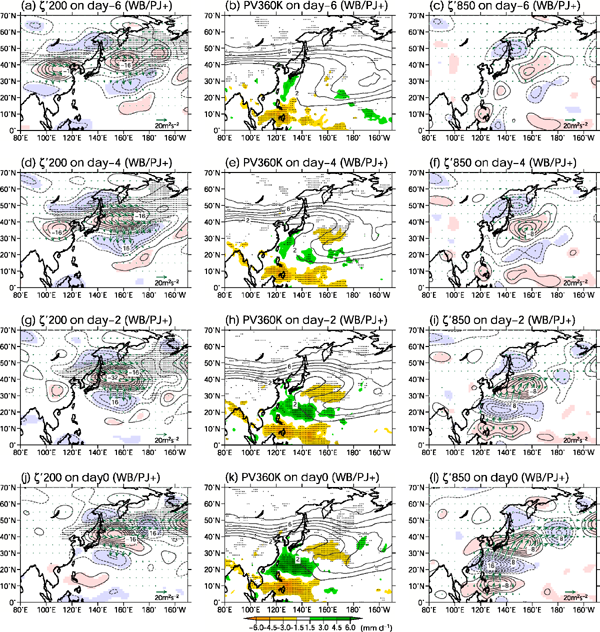
Composite of 5 day running mean (left) 200 hPa anomalous vorticity (contour; unit: 10−6 s−1), (middle) 360 K PV (contour; unit: PVU) and convective precipitation (shading; unit: mm d−1), and (right) 850 hPa anomalous vorticity (contour) for WB/PJ+ case. Solid and dashed contours denote negative and positive vorticity anomalies, respectively. Green vectors show the WAF (unit: m2 s−2). Shadings in the left and right panels and dots in the middle panel indicate significance at a 95 % confidence level of the anomalous vorticity and the anomalous convective precipitation, respectively. Dots in the left panel indicate regions where 200 hPa anomalous kinetic energy, which is derived from anomalous zonal and meridional winds, exceeds 90 m2 s−2. (a, b, c) day −6, (d, e, f) day −4, (g, h, i) day −2, and (j, k, l) day 0.
In the lower troposphere, southwest–northeast-oriented dipole anomalous vorticities are significantly enhanced over the region from the subtropical WNP to the east of Japan after day −2 (Figs. 5i, l) associated with the enhanced convection over the subtropical WNP. The dipole anomalies are accompanied by an anomalous cyclonic circulation south of Japan and an anomalous anticyclonic circulation east of Japan (Figs. 5i, l), corresponding to the formation of the positive PJ pattern. In the upper troposphere, the Rossby wave propagation over Eurasia along the Asian jet becomes obscure on day 0 (dots in Fig. 5j), with no significant vorticity anomalies over midlatitude Eurasia (contours in Fig. 5j). The wave propagation, by contrast, is significantly enhanced over the midlatitude North Pacific, exhibiting the equivalent barotropic structure (Figs. 5j, l), which is one of the essential structures of the PJ pattern (Kosaka and Nakamura 2006). The abovementioned results of the composite analysis for the WB/PJ+ case are consistent with TM20, also supporting their result.
To assess an impact of the southwestward intruding high-PV air mass toward the subtropical WNP and the enhanced convection over the region, the composite of anomalous Q-vectors and ω′dyn at 500 hPa on day 0 for the WB/PJ+ cases are shown in Fig. 6a. The midtropospheric anomalous Q-vector convergence and the associated negative ω′dyn centered at 20°N, 140°E are clearly seen east of the Philippines, indicating the dynamically induced anomalous ascent over the region. The midtropospheric dynamically induced anomalous ascent is seen to the southwest of the high-PV air mass associated with the RWB, contributing to the rapidly enhanced convection over the subtropical WNP (Figs. 5h, k).

Composite of anomalous Q-vectors (vectors; unit: m2 kg−1 s−1) and ω′dyn (shading; unit: 10−2 Pa s−1) at 500 hPa over a region north of 5°N derived from 5 day running mean on day 0 for (a) WB/PJ+ and (b) WB/PJ− cases.
Here, a correlation analysis for the WB/PJ+ cases is conducted to reverify a relationship between the dynamically induced ascent accompanied by the RWB, the enhanced convection over the subtropical WNP, and the formation of the PJ pattern as shown by TM20. Figure 7a presents a scatter diagram between −ω′dyn at 500 hPa and the convective precipitation averaged over region A (green box in Fig. 3) on day 0 for the WB/PJ+ case. The relationship between the dynamically induced anomalous ascent and the enhanced convection over the subtropical WNP is seen with the correlation coefficient of +0.54. Figure 7b further presents the scatter diagram between the convective precipitation averaged over region A and the PJ index on day 0. The enhanced convection over the subtropical WNP and the amplitude of the positive PJ pattern is also correlated with the correlation coefficient of +0.52. These correlation coefficients are significant at a confidence level of 99 %, although only approximately 25–30 % of the precipitation (PJ index) variation is explained by ω′dyn (precipitation) variation. These results shown in this subsection indicate that the positive PJ pattern in the WB/PJ+ case, which account for approximately 30 % of all the PJ+ cases (Fig. 4), is associated with the RWB east of Japan.

Scatter diagrams of 5 day running mean (a) − ω′dyn at 500 hPa (X-axis; unit: 10−2 Pa s−1) and convective precipitation (Y-axis; unit: mm d−1) averaged over region A (green-colored box in Fig. 3) and (b) the convective precipitation (X-axis) and PJ index (Y-axis) on day 0. A dashed line denotes a regression line. The corresponding correlation coefficient (R) is shown at the lower right of the panel.
The WB/PJ− cases indicate that the negative PJ pattern is formed although the RWB occurs east of Japan, inconsistent with the result of TM20. Although the number and percentage of the WB/PJ− cases are quite smaller than those of the WB/PJ+ cases, features of their composite should be examined to further assess the dynamical process proposed by TM20. Figure 8 shows the composite of the upper- and lower-tropospheric vorticity anomalies, 360 K PV, and anomalous convective precipitation on days −6, −4, −2, and 0 for the 9 WB/PJ− cases. Note that the composite fields exhibit scattered features because of the small sample size (i.e., nine cases). Although the Rossby waves propagating along the Asian jet are seen from day −6 to day −4 (dots in Figs. 8a, d), the associated uppertropospheric vorticity anomalies are not significant in contrast to those in the WB/PJ+ cases (contours in Figs. 8a, d). The upper-tropospheric Rossby waves, by contrast, propagate eastward along the polar-front jet from day −4 to day −2, accompanied by the significant vorticity anomalies over northern Eurasia (Figs. 8d, g). The wave packets subsequently propagate southward over the region from Eastern Siberia into the central Pacific to the east of 160°E and cause the RWB east of Japan on day −2 (vectors in Fig. 8g). The RWB is accompanied by a zonally elongated amplified anomalous anticyclone east of Japan (Figs. 8g, j), whose horizontal structure is quite different from that in the WB/PJ+ case (Figs. 5g, j). The zonally elongated anomalous vorticities in the upper troposphere correspond to the abovementioned southward propagation of the Rossby wave packets from northern Eurasia (vectors in Fig. 8g). A center of the upper-tropospheric anomalous cyclones to the south of Japan, in this case, locates in the further east side apart from the subtropical WNP (Figs. 8d, g), compared with that in the WB/PJ+ case (Figs. 5d, g). The eastward shift of upper-level anomalous cyclones is associated with the southward propagating Rossby wave packets toward the central Pacific. The PV at 360 K east of Japan clearly shows the “inverse-S” shaped overturning associated with the occurrence of RWB over the region, with an eastward intrusion of the low PV air mass north of 30°N and a westward intrusion of the high-PV air mass south of 30°N, respectively (contours in Figs. 8e, h). Although the high-PV air mass clearly intrudes westward toward the subtropical WNP associated with the RWB, the rapidly enhanced convection over the region is not seen (color shadings in Figs. 8h, k). By contrast, the suppressed convection is significantly seen over the subtropical WNP and persists during the period from day −6 to day 0 (color shadings in the middle panels of Fig. 8). The absence of convection over the subtropical WNP is consistent with the Rossby wave propagation toward the central Pacific away from the subtropical WNP in the upper troposphere (Figs. 8d, g).

Same as Fig. 5, but for WB/PJ− case.
In the lower troposphere, southwest–northeast-oriented dipole anomalous vorticities are significantly enhanced over the region from the subtropical WNP to the vicinity of Japan after day −4 (Figs. 8i, l) associated with the suppressed convection over the subtropical WNP. The dipole anomalies are accompanied by an anomalous anticyclonic circulation south of Japan and an anomalous cyclonic circulation near Japan (Figs. 8i, l), corresponding to the formation of the negative PJ pattern. The anticyclonic circulation anomalies south of Japan are also seen before day −4 (Fig. 8c), which is associated with the persistent suppressed convection over the subtropical WNP (Fig. 8b). Possible factors of the suppressed convection over the subtropical WNP with the occurrence of RWB will be discussed later in Sections 6 and 8.
The impact of the westward intruding high-PV air mass toward the subtropical WNP on the dynamically induced vertical motion for the WB/PJ− case is assessed, using the composite of anomalous Q-vectors and ω′dyn at 500 hPa on day 0 (Fig. 6b). The dynamically induced anomalous ascent is not seen over the subtropical WNP along the latitudinal band of 20°N where the suppressed convection persists (Fig. 8k). The Q-vector diagnosis indicates that there is no impact of the westward intruding high-PV air mass associated with the RWB on the convective activities over the subtropical WNP and the consequent formation of a PJ pattern for the WB/PJ− case. The dynamically induced anomalous ascent, by contrast, is widely seen over the region from the Yellow Sea to the Bering Sea through mainland Japan (Fig. 6b). The anomalous ascent is seen south of a zonally elongated significant cyclonic circulation anomaly centered around northern Japan in the upper troposphere (Fig. 8j).
We compare the meridional component of the upper-level WAF averaged over region B to assess a difference of the upper-level Rossby wave propagation to the east of Japan between the WB/PJ− and WB/PJ+ cases (purple-colored box in Fig. 3). Figure 9 presents the histogram of the area-averaged meridional component of WAF at 200 hPa for both of the cases. The southward wave propagation to the east of Japan in the WB/PJ− case (blue boxes in Fig. 9) is enhanced compared with that in the WB/PJ+ case (red bars in Fig. 9), with a significant difference in their averages at a confidence level of 95 % (not shown). This result also implies that the upper-level enhanced Rossby wave propagation toward the central Pacific away from the subtropical WNP can affect the absence of convection over the subtropical WNP in the WB/PJ− case.

Histogram of the meridional component of WAF at 200 hPa (unit: m2 s−2) averaged over region B (purple-colored box in Fig. 3) with a bin width of 2 m2 s−2 for the WB/PJ+ (red bars) and WB/PJ− (blue boxes) cases. The frequency distribution is normalized by the sample number.
The ZN/PJ+ case represents the PJ+ cases with the absence of RWB east of Japan and is expected to extract “pure” (i.e., without atmospheric variabilities in midlatitudes) impacts of tropical atmospheric circulations on the formation of the positive PJ pattern. Figure 10 shows the composite of the upper- and lower-tropospheric vorticity anomalies, 360 K PV, and anomalous convective precipitation on days −6, −4, −2, and 0 for the 85 ZN/PJ+ cases. The uppertropospheric anomalous vorticities over Eurasia are scattered, and the wave train along the Asian jet is not seen from day −6 to day −2 (Figs. 10a, d, g). The overturning of PV distribution at 360 K is not seen east of Japan associated with the zonal flow in the upper troposphere after day −4 (contours in Figs. 10e, h, k), indicating the absence of RWB east of Japan.

Same as Fig. 5 but for ZN/PJ+ case.
Apart from the upper-tropospheric anomalous circulation, an enhanced convection is significantly seen over a latitudinal band of 15°N east of the Philippines on day −6 and moves northwestward until day 0 (color shadings in the middle panels of Fig. 10). In the lower troposphere, an anomalous cyclonic circulation also moves northwestward and is amplified from day −6 to day 0 (right panels of Fig. 10) associated with the northwestward-moving enhanced convection. These northwestward-moving enhanced convective activities and the associated lower-tropospheric anomalous cyclonic circulation over the subtropical WNP correspond to the result of Zhu et al. (2020), who showed a bi-weekly time-scale variability of the PJ pattern. Meanwhile, the anomalous anticyclonic circulation near Japan is enhanced in the lower troposphere after day −4 (Figs. 10f, i, l), associated with the enhanced cyclonic circulation anomaly over the subtropical WNP. These lower-tropospheric meridional dipole vorticity anomalies indicate the formation of the positive PJ pattern with the absence of RWB (Fig. 10h). The meridional dipole anomalies are also significant in both the lower and upper troposphere with a phase difference of 90° (Figs. 10j, l), exhibiting the northward-tilting vertical structure of the PJ pattern (Kosaka and Nakamura 2006).
5.4 ZN/PJ− caseFigure 11 shows the composite of the upper- and lower-tropospheric vorticity anomalies, 360 K PV, and anomalous convective precipitation on days −6, −4, −2, and 0 for the 105 ZN/PJ− case, which represents the PJ− case with the absence of RWB east of Japan. The significant anomalous vorticities over Eurasia in the upper troposphere are not seen during the period (left panels of Fig. 11). By contrast, the upper-tropospheric meridional dipole anomalous vorticities with an anomalous cyclonic circulation east of Japan and an anomalous anticyclonic one to the south are significantly seen during the period. The upper-level dipole anomalies correspond to the enhanced zonal flow near the climatological Asian jet exit region and the consequent weakened mid-Pacific trough. Although the weak overturning of PV at 360 K east of Japan is seen near the dateline during the period (contours in middle panels of Fig. 11), the intrusion of high-PV air mass toward the subtropical WNP is not clear (middle panels of Fig. 11).

Same as Fig. 5 but for ZN/PJ− case.
The suppressed convection over the subtropical WNP is significantly seen and expands northwestward from day −4 to day 0 (color shadings in Figs. 11e, h, k). In the lower troposphere, an anomalous anticyclonic circulation is enhanced during the period (Figs. 11f, i, l) associated with the suppressed convection over the subtropical WNP. The northwestward expanding suppressed convection and the associated enhanced anomalous anticyclonic circulation over the subtropical WNP in the lower troposphere also correspond to the result of Zhu et al. (2020), as the ZN/PJ+ cases. Meanwhile, a zonally elongated anomalous cyclonic circulation is enhanced near Japan in the lower troposphere from day −2 to day 0 (Figs. 11i, l), in coincidence with the enhanced anticyclonic circulation anomaly to the south, indicating the formation of a negative PJ pattern. The meridional dipole vorticity anomalies also exhibit the northward-tilting vertical structure in the troposphere (Figs. 11j, l), as the ZN/PJ+ cases. An anomalous anticyclonic circulation is further seen over the sea of Okhotsk in the lower and upper troposphere from day −2 to day 0 (Figs. 11g, i, j, l), exhibiting a meridional tripolar pattern including the negative PJ pattern (Hirota and Takahashi 2012). This anomalous anticyclonic circulation is associated with an intensified Okhotsk high, which can cause unseasonable summer weather in Japan (e.g., Nakamura and Fukamachi 2004).
This section overviews the impacts of anomalous large-scale atmospheric circulations and oceanographic conditions in the tropics on the formation of the four types of the PJ cases described in Section 5. Figure 12 shows the SST deviation averaged during the period from day −10 to day −6 when the SST is insusceptible to evaporation resulting from surface wind (i.e., the wind–evaporation–SST feedback; Xie and Philander 1994) associated with the convective activities during the period before and after day 0. Figure 13 further shows anomalous 200 hPa velocity potential, convective precipitation, and 925 hPa horizontal wind on day 0.

Composite of SST deviation (unit: °C) averaged from day −10 to day −6 for (a) WB/PJ+, (b) WB/PJ−, (c) ZN/PJ+, and (d) ZN/PJ− cases. Dots indicate significance at a 95 % confidence level of the SST deviation.

Same as Fig. 12, but for 5 day running mean velocity potential at 200 hPa (contour; unit: 105 m2 s−1), convective precipitation (shading; unit: mm d−1), and horizontal wind at 925 hPa (vector; unit: m s−1) on day 0. Dots indicate significance at a 95 % confidence level of the 200 hPa velocity potential.
For the WB/PJ+ case, the SST shows significantly warm and cold deviations over the western and central–eastern equatorial Pacific, respectively, indicating that La Niña-like conditions are favorable for the RWB occurrence and the consequent formation of the positive PJ pattern (Fig. 12a). These SST deviations are consistent with the result of Takemura et al. (2020), who indicated the significant increase of the RWB frequency near Japan in July and August during the La Niña years. By contrast, there is no significant warm SST deviation over the western part of the subtropical WNP at the latitudinal band of 20°N that can contribute to the enhanced convection over the region and the consequent formation of the positive PJ pattern (Figs. 5k, l), consistent with the result of TM20. The upper-tropospheric wave-like pattern of anomalous convergence and divergence from Southeast Asia to the southeast of Japan (contour in Fig. 13a) well corresponds to the suppressed and enhanced convection over the region (shading in Fig. 13a), respectively. This meridional pattern of anomalous convective activities is suggestive of the BSISO, which is characterized as the northward propagating active and inactive phases of convective activities over the Asian monsoon region. Nevertheless, their relevance to the BSISO is not seen as shown later in Section 7.
For the WB/PJ− case, the cold SST deviation over the central to eastern equatorial Pacific is clearly seen (Fig. 12b) as with the WB/PJ+ cases, also consistent with the result of Takemura et al. (2020). Meanwhile, there are no significant SST deviations over the subtropical WNP that can contribute to the suppressed convection over the region and the formation of the negative PJ pattern (Figs. 8k, l). Conversely, the significant warm SST deviations are seen over a wide area in the northern part of the equatorial Indian Ocean, corresponding to the basin-wide SST warming over the region (Xie et al. 2009, 2016; Kosaka et al. 2013). The active and inactive phases of convection accompanied by the upper-tropospheric coherent large-scale anomalous divergence and convergence over the Indian Ocean and the WNP on day 0 (contour in Fig. 13b) are clearly seen. The upper-tropospheric convergence over the WNP, accompanied by the suppressed convection (shading in Fig. 13b), is closely related to the formation of the negative PJ pattern (Fig. 8l). By contrast, enhanced convective activities over northern and eastern parts of the Indian Ocean with the scattered structure (shading in Fig. 13b) are consistent with the upper-tropospheric anomalous divergence (contour in Fig. 13b). The lower-tropospheric horizontal wind exhibits the southwestward to westward anomalous flow from the subtropical WNP toward the northern Indian Ocean (vector in Fig. 13b) where the warm SST deviation and the enhanced convection is located (Fig. 12b and shading in Fig. 13b). These atmospheric features well correspond to the Indian Ocean capacitor effect proposed by Xie et al. (2009, 2016), and the impact on the formation of the negative PJ pattern (Fig. 8l; e.g., Kosaka et al. 2013). The abovementioned results suggest that the remote influence of the basin-wide SST warming over the Indian Ocean may partly cancel the impact of the RWB east of Japan on the formation of the positive PJ pattern for the WB/PJ− cases as described in Subsection 5.2.
For the ZN/PJ+ case, there is no significant SST deviation over the equatorial Pacific (Fig. 12c), except over the eastern Pacific where a meridionally antisymmetric SST with positive (negative) deviations to the north (south) of the equator. The meridional gradient of SST deviation is reminiscent of a positive phase of the Pacific meridional mode of the SST (PMM; Chiang and Vimont 2004). A relationship between the PMM-like SST deviation and the enhanced convection over the subtropical WNP (shading in Fig. 10k) is consistent with the result of Takaya (2019), who indicated a relationship between the positive phase of PMM and an enhanced activity of tropical cyclones in the WNP in summer 2018. A relationship between the positive phase of PMM and the formation of the positive PJ pattern is also suggested by Wakamatsu et al. (2019) in their SST sensitivity experiments for summer 2018, consistent with the PMM-like SST deviation for the ZN/PJ+ case. These results are suggestive of a remote influence from the PMM-like SST deviation on the enhanced convection over the subtropical WNP and the consequent formation of the positive PJ pattern. The warm SST deviation is also significantly seen east of the Philippines (Fig. 12c), indicating a local impact of the SST on the enhanced convection over the region and the consequent formation of the positive PJ pattern (Figs. 10k, l), consistent with the results of Nitta (1987) and Huang (1992). The upper-tropospheric large-scale anomalous divergence and convergence are significantly seen over the WNP and the northern Maritime Continent (contour in Fig. 13c) associated with the enhanced and suppressed convection over the region (shading in Fig. 13c). This feature corresponds to the BSISO as shown later in Section 7.
For the ZN/PJ− case, the SST shows the significantly cold and warm deviations over the western and central–eastern equatorial Pacific, respectively (Fig. 12d), implying that El Niño conditions are favorable for the formation of the negative PJ pattern (Fig. 11l). The El Niño conditions are also favorable for the enhanced zonal flow condition near the climatological Asian jet exit region with the absence of RWB in the ZN/PJ− case (Takemura et al. 2020). The cold SST deviation is further significantly seen east of the Philippines (Fig. 12d), corresponding to the suppressed convection over the region and the consequent formation of the negative PJ pattern (Figs. 11k, l). This relationship between the local cold SST deviation and the formation of the negative PJ pattern is consistent with the result of Wu et al. (2010). In the upper troposphere, the large-scale anomalous divergence and convergence are significantly seen, with the active phase of convection over the Indian Ocean and the tropical central Pacific and the inactive phase of convection around the Philippines (contour in Fig. 13d). This anomalous divergence pattern is also quite similar to atmospheric responses to the anomalous SST in the El Niño conditions (Fig. 12d). The lower-tropospheric wind exhibits the southwestward anomalous flow from the subtropical WNP toward the northern Indian Ocean (vector in Fig. 13d) where the upper-tropospheric anomalous divergence is located (contour in Fig. 13d). This suggests that the active phase of convection over the Indian Ocean can remotely influence the suppressed convection over the subtropical WNP and the consequent formation of the negative PJ pattern (Fig. 11l).
This section assesses the relationship between the BSISO and the four types of PJ cases on the basis of the time evolution of the lag composite. Figure 14 shows time–latitude cross sections for the composite of anomalous convective precipitation averaged between 80°E and 140°E where the active Asian monsoon circulation is climatologically seen.

Time–latitude cross sections for the composite of anomalous convective precipitation (unit: mm d−1) averaged between 80°E and 140°E during a period from day −10 to day +10 for (a) WB/PJ+, (b) WB/PJ−, (c) ZN/PJ+, and (d) ZN/PJ− cases. Dots indicate significance at a 95 % confidence level of the convective precipitation. Red and blue dashed lines in (c) and (d) represent northward propagation of intraseasonal and bi-week oscillations with periods of 40 days and 15 days for a meridional wavelength of 30° with a latitudinal interval of 15°, respectively.
For the WB/PJ+ and WB/PJ− cases, there is no signal of the northward propagation of the anomalous convection (Figs. 14a, b). By contrast, the quasistationary convective activities are significantly seen for the two cases (Figs. 14a, b), particularly for the WB/PJ+ cases with the significantly suppressed convection at a latitudinal band of 10°N during the whole period and the significantly enhanced convection north 15°N from day −1 to day +4 (Fig. 14a). These results indicate the inactive BSISO under the La Niñalike SST anomaly (Figs. 12a, b), consistent with Liu et al. (2016) who showed that the La Niña (El Niño) condition can suppress (enhance) the BSISO over the WNP. For the ZN/PJ+ and ZN/PJ− cases, by contrast, the northward propagation of anomalous convection is significantly seen (Figs. 14c, d), indicating the influence of BSISO on the enhanced and suppressed convection at a latitudinal band of 20°N associated with the positive and negative PJ patterns, respectively. This is also consistent with the abovementioned relationship between the ENSO and the BSISO (Liu et al. 2016). Here, red and blue dashed lines in Figs. 14c and 14d represent northward propagating intraseasonal and bi-week oscillations with periods of 40 days and 15 days for a meridional wavelength of 30°, respectively. The active and inactive phases of the convection propagate northward almost along the red dashed lines, highlighting a close relationship with the BSISO for the ZN/PJ+ and ZN/PJ− cases. A part of the active (inactive) convection for the ZN/PJ+ and ZN/PJ− cases also seems to propagate northward almost along the blue dashed lines, corresponding to the bi-week time-scale ISO (Zhu et al. 2020) as described in Subsections 5.3 and 5.4. It is noteworthy that the significant relationship between the formation of the PJ pattern and the BSISO is clearly identified by excluding the PJ cases with the presence of RWB.
This section discusses a possible factor for the suppressed convection over the subtropical WNP with the presence of RWB for the WB/PJ− case as described in Subsection 5.2. As mentioned in Sections 5.2 and 6, it is presumed that the upper-level Rossby wave propagation and the basin-wide warming over the Indian Ocean are essential factors for the suppressed convection over the subtropical WNP and the consequent negative PJ pattern for the WB/PJ− case. By contrast, TM20 indicated that the upper-tropospheric absolute vorticity advection associated with the RWB-related intrusion of high-PV air mass is primarily important for the dynamically induced ascent over the subtropical WNP. It is expected from their result and the Q-vector diagnosis for the WB/PJ− cases (Fig. 6b) that different characteristics of the upper-level vorticity advection due to the RWB between the WB/PJ+ and WB/PJ− cases can influence the occurrence of the dynamically induced anomalous ascent.
Figure 15 shows 200 hPa absolute vorticity advection by the meridional wind v in the terms B + D (top), B (middle), and D (bottom) in Eq. (4) for the WB/PJ+ (left panels) and WB/PJ− (right panels) cases. For the WB/PJ+ case, the term B + D (shading in Fig. 15a) clearly shows positive vorticity tendencies centered at 20°N, 140°E east of the Philippines, corresponding to the dynamically induced anomalous ascent (Fig. 6a) to the southwest of high-PV air mass associated with the RWB (contours in Figs. 5k, 15a). The term B (shading in Fig. 15b) also shows positive vorticity tendencies at a latitudinal band of 15°N, which partly explains the terms B + D in that region (shading in Fig. 15a). The positive vorticity tendencies explained by the term B correspond to the southward wind anomalies (vector in Fig. 15b) partly associated with the uppertropospheric anomalous cyclonic circulation resulting from the RWB (dashed contour in Fig. 15a). The term D (shading in Fig. 15c) also shows positive vorticity tendencies immediately south of the upper-level RWB-related anomalous cyclonic circulation (dashed contour in Fig. 15c) downstream of the climatological southward wind (vector in Fig. 15c). The abovementioned results of the vorticity budget analysis indicate that the upper-tropospheric anomalous absolute vorticity advection resulting from the RWB contributes to the dynamically induced anomalous ascent and the consequent enhanced convection over the subtropical WNP, consistent with the result of TM20.

Composite of 5 day running mean anomalous absolute vorticity advection by meridional wind at 200 hPa (shading; unit: 10−11 s−2) on day 0 in terms B + D (top), B (middle), and D (bottom) in Eq. (4) for (left) WB/PJ+ and (right) WB/PJ− cases. Contours in the top and bottom figures show the 200 hPa anomalous vorticity (unit: 10−5 s−1). Contours in the middle figures show the 200 hPa climatological absolute vorticity (unit: 10−5 s−1). Vectors in the middle and bottom figures show the anomalous and climatological horizontal wind (unit: m s−1), respectively.
For the WB/PJ− case, by contrast, the positive vorticity tendencies in the term B + D (shading in Fig. 15d) is not clearly seen east of the Philippines, where the ω′dyn at 500 hPa is also absent (Fig. 6b). The term B (shading in Fig. 15e) shows negative vorticity tendencies east of the Philippines, which are caused by weak northward wind anomalies (vector in Fig. 15e) associated with the upper-tropospheric zonally elongated anomalous cyclonic circulation resulting from the RWB (dashed contour in Fig. 15d). The term D (shading in Fig. 15f) shows positive vorticity tendencies at a latitudinal band of 15°N immediately south of the zonally elongated anomalous cyclonic circulation (dashed contour in Fig. 15f) downstream of the climatological southward wind (vector in Fig. 15f). The terms B and D thus show the opposite-signed absolute vorticity tendencies east of the Philippines, resulting in the small amplitude of total (i.e., the terms B + D) vorticity tendencies over the region (shading in Fig. 15d).
Here, a relationship between the abovementioned upper-tropospheric vorticity tendencies and the dynamically induced ascent over the subtropical WNP is quantitatively assessed for the WB/PJ+ and WB/PJ− cases. Figure 16 shows a scatter diagram between the absolute vorticity advection by the meridional wind at 200 hPa in the terms B + D in Eq. (4) and −ω′dyn at 500 hPa over the region A (green box in Fig. 3) on day 0 for the WB/PJ+ (red opened circles) and WB/PJ− (blue opened circles) cases. The scatter diagram indicates a close relationship between the upper-tropospheric anomalous absolute vorticity advection and the dynamically induced anomalous ascent over the subtropical WNP with significant positive correlation coefficients of RP = +0.57, RM = +0.71, and R = +0.62 for the WB/PJ+, WB/PJ− cases, and both the cases at a confidence level of more than 95 %, respectively. The areal average of anomalous absolute vorticity advection at 200 hPa over region A for the WB/PJ+ case is significantly larger than that for the WB/PJ− case at a confidence level of 99 % (figure not shown).

A scatter diagram between anomalous absolute vorticity advection by meridional wind at 200 hPa in term B + D in Eq. (4) (X-axis; unit: 10−11 s−2) and −ω′dyn at 500 hPa (Y-axis; unit: 10−2 Pa s−1) averaged over region A (green-colored box in Fig. 3) derived from 5 day running mean on day 0. Red and blue circles denote WB/PJ+ and WB/PJ− cases, respectively. Red, blue, and black dashed lines show regression lines for the WB/PJ+, WB/PJ− cases, and both the cases, respectively. R, RP, and RM shown in the top left of the panel denote the corresponding correlation coefficients.
The abovementioned results indicate that a morphological difference in the RWB-related upper-tropospheric anomalous circulation between the WB/PJ+ and WB/PJ− cases (Figs. 5j, 8j) can affect the dynamically induced anomalous ascent over the subtropical WNP (Figs. 6a, b) through the difference in the upper-tropospheric absolute vorticity advection over the region (Figs. 15a, d). The zonally elongated upper-tropospheric anomalous circulation for the WB/PJ− case, which is unfavorable for the dynamically induced enhanced convection over the subtropical WNP, is associated with the southward propagation of the Rossby wave packets along the polar-front jet (vectors in Fig. 8g), as described in Subsection 5.2.
As discussed in Section 4, the WB/PJ+ case may include not only cases triggered by the RWB, which are accompanied by the Rossby wave propagation along the Asian jet, but also ones in which the positive PJ pattern conversely causes the RWB. In this section, we try to estimate a proportion of the WB/PJ+ cases accompanied by the Rossby wave propagation along the Asian jet to all the WB/PJ+ cases using the following two types of the vertically averaged WAFs: one is a vertically averaged (500–100 hPa) zonal component of WAF averaged over the light-green shaded region in Fig. 3 (WAFx), representing the activity of the upper-level eastward wave propagation along the Asian jet toward the RWB region. The other is a vertically averaged (850–500 hPa) meridional component of WAF averaged over the light-blue shaded region in Fig. 3 (WAFy), representing the activity of the lower-level northward wave propagation toward the RWB region associated with the PJ pattern. Here, the vertical average is weighted by air mass.
Figure 17a presents daily timeseries of composites of WAFx and WAFy during a period from day −7 to day +1 for the WB/PJ+ case. The composite of WAFx (green line in Fig. 17a) exceeds that of WAFy (blue line in Fig. 17b) particularly before day −1 when an enhancement of the RWB-related anomalous anticyclone is seen east of Japan (Figs. 5a, d, g). Figure 17b further shows a scatter diagram of WAFx and WAFy on day −2, when the RWB attains its peak. From Fig. 17b, it is found that the number of the WB/PJ+ cases in which WAFx exceeds WAFy is 21, indicating that approximately 70 % of all the WB/PJ+ cases (31 cases) is mainly caused by the upper-level Rossby wave propagation along the Asian jet. This percentage is almost the same even if the regions averaging WAFx and WAFy are slightly altered (color-shaded region in Fig. 3), suggesting the robustness of the estimated percentage. The magnitude of the southward component of WAF toward the RWB-related anomalous anticyclone in the upper troposphere (Fig. 5g) is smaller than that of WAFx on day −2 (not shown). The abovementioned comparison indicates a primary contribution of the eastward Rossby wave propagation to the enhanced RWB. Hence, the WB/PJ+ cases triggered by the RWB can account for approximately 20 % of the total PJ+ cases (116 cases).

(a) Daily timeseries for composites of zonal component of WAF (green line; WAFx, unit: m2 s−2) averaged over the light-green shaded region in Fig. 3 and the meridional component of WAF (blue line; WAFy) averaged over the light-blue shaded region in Fig. 3 during a period from day −7 to day +1 for the WB/PJ+ cases. Error bars denote standard deviations. The zonal and the meridional components of WAF are vertically averaged from 500 hPa and 100 hPa and from 850 hPa and 500 hPa, respectively. (b) A scatter diagram of WAFx (X-axis) and WAFy (Y-axis) on day −2. The black dashed line corresponds to WAFy with the same value of WAFx. Green (blue) circles indicate the cases that WAFx (WAFy) is larger than WAFy (WAFx).
This study assessed the role of the RWB east of Japan in the formation of the PJ pattern compared with that of tropical atmospheric and oceanographic variabilities, using the extracted PJ+ (total in 116) and PJ− (total in 114) cases. The climatological relationship between the central dates (day 0) of the extracted PJ cases and the Baiu period over the Kanto/Koshin district in Japan was first examined. The results implied that the PJ+ cases are associated with the withdrawals of Baiu season and the abnormally hot conditions near Japan in boreal summer, whereas the PJ− cases are associated with the prolonged Baiu and the unseasonable weather in boreal summer.
Based on the scatter diagram between the PJ index on day 0 for the extracted PJ cases and the RWB index on day −2, this study classified the PJ cases into the four types of the PJ patterns as follows: the PJ+ cases accompanied by the RWB (the WB/PJ+ case), the PJ− cases accompanied by the RWB (the WB/PJ− case), the PJ+ cases with the absence of RWB (the ZN/PJ+ case), and the PJ− cases with the absence of RWB (the ZN/PJ− case). Approximately 80 % of the cases associated with the RWB were categorized as the WB/PJ+ case, indicating that the RWB east of Japan favors the PJ+ cases. The WB/PJ+ cases accounted for approximately 30 % of the whole PJ+ cases. By contrast, numbers of the ZN/PJ+ and ZN/PJ− cases are much larger than those of the WB/PJ+ and WB/PJ− cases (Fig. 4, Table 2), indicating a primary contribution of tropical variabilities to the formation of the PJ pattern as shown by several previous studies.
Then, the lag composite analyses for the four types of PJ cases were conducted to examine atmospheric and oceanographic features promoting the formation of the PJ pattern. For the WB/PJ+ case, the anticyclonic RWB east of Japan followed by the Rossby wave propagation along the Asian jet caused the positive PJ pattern through the upper-level southwestward intrusion of high-PV air mass toward the subtropical WNP and the consequent enhanced convection over the region. The Q-vector diagnosis and the associated correlation analysis indicated that the dynamically induced anomalous ascent over the subtropical WNP due to the RWB east of Japan can promote the enhanced convection over the region and the consequent formation of the positive PJ pattern. These results indicated that the WB/PJ+ case can be triggered by the RWB east of Japan.
For the WB/PJ− case, the zonally elongated anticyclonic RWB east of Japan was seen followed by the Rossby wave propagation along the polar-front jet. The horizontal structure of the zonally elongated uppertropospheric anomalous circulation resulting from the RWB was quite different from that of the WB/PJ+ case. Although the westward intrusion of high-PV air mass toward the subtropical WNP was clearly seen, the suppressed convection was rather significantly seen over the region with the absence of dynamically induced anomalous ascent, contributing to the formation of the negative PJ pattern. The significant warm SST deviation was seen over the northern part of the equatorial Indian Ocean, which was accompanied by the upper-tropospheric large-scale anomalous divergence over the Indian Ocean. The lower-tropospheric winds further showed the southwestward to westward anomalous flow from the subtropical WNP toward the northern Indian Ocean, corresponding to the Indian Ocean capacitor effect and its contribution to the formation of the negative PJ pattern. The abovementioned Indian Ocean capacitor effect and the morphological difference in the upper-level anomalous circulation including the RWB could play roles in the suppressed convection over the subtropical WNP and the consequent formation of the negative PJ pattern with the presence of RWB through the different characteristics of the upper-tropospheric anomalous absolute vorticity advection in the WB/PJ− case compared with that in the WB/PJ+ case.
For the ZN/PJ+ case, the Rossby wave propagation over Eurasia was not seen. The northwestward-moving enhanced convection and the associated lower-tropospheric anomalous cyclonic circulation were significantly seen over the subtropical WNP, which promoted the formation of the positive PJ pattern. The warm SST deviation east of the Philippines was consistent with the enhanced convection over the region and the consequent formation of the positive PJ pattern. The northward propagating enhanced convection over the subtropical WNP was further closely associated with the active phase of BSISO, indicating the impact of the BSISO on the formation of the positive PJ pattern.
For the ZN/PJ− case, as the ZN/PJ+ case, the Rossby wave propagation over Eurasia was not seen and the zonal flow was dominated near the Asian jet exit region. The northwestward-moving suppressed convection and the consequent lower-tropospheric anomalous anticyclonic circulation were significantly seen over the subtropical WNP, which promoted the formation of the negative PJ pattern. The cold SST deviation east of the Philippines corresponded to the suppressed convection over the region and the formation of the negative PJ pattern. The upper-tropospheric large-scale anomalous divergence field clearly showed the active phase of convection over the Indian Ocean and tropical central Pacific and the inactive phase of convection around the Philippines.
It was noteworthy that the WB/PJ+ cases triggered by the RWB east of Japan accounted for approximately 20 % of the whole PJ+ cases. This estimated percentage is not insignificant because the formation of the positive PJ pattern had been considered to be primarily excited by tropical atmospheric and oceanographic variabilities such as the ISO, local anomalous SSTs, ENSO, and tropical cyclone activities. Furthermore, the atmospheric and oceanographic signals such as the local SST deviations over the subtropical WNP and the BSISO for the ZN/PJ+ and ZN/PJ− cases, the basin-wide SST warming over in the northern part of the Indian Ocean for the WB/PJ− case, and the PMMlike meridional SST gradient for the ZN/PJ+ case was clearly detected by classifying the PJ+ and PJ− cases into those with and without the RWB occurrence. Some cases of the extracted PJ pattern may be caused by both the RWB and the tropical variabilities, which are not elucidated by the composite analysis in this study. Such a combination effect on the formation and the enhancement of the PJ pattern should be further explored in future works. This classification for the PJ cases shown in this study will promote our further understanding of the “pure” impact of tropical atmospheric and oceanographic variabilities on the formation of the PJ pattern.
The authors are very grateful to an editor Dr. Ryo Mizuta and two anonymous reviewers for their constructive and helpful comments. The Generic Mapping Tools were used for the graphics. This study was partly supported by the JSPS KAKENHI Grant (18H01280, 18K03734).