Articles
Resolution of Summertime East Asian Pressure Pattern and Southerly Monsoon Wind in CMIP5 Multi-model Future Projections
2020 Volume 98 Issue 5 Pages 927-944

Details
2020 Volume 98 Issue 5 Pages 927-944
The southerly surface wind index over the summertime East Asia (SWI) is strengthened in the future in the fifth phase of the Coupled Model Intercomparison Project (CMIP5). However, the differences among the models are much larger than the ensemble average. The empirical orthogonal function (EOF) analysis is applied to the future changes in the East Asian surface pressure pattern responsible for the SWI. The ensemble average and five EOF modes for the pressure patterns and the associated precipitation changes are identified, and their possible sources are examined.
The CMIP5 ensemble mean change in the summertime Asia Pacific surface pressure pattern possesses the characteristics of the first to third modes. The first and second mode components contribute to the positive SWI in the future, but are cancelled mostly by the third mode component. The first mode is high surface pressure anomalies over low Asia Pacific sea surface temperature. The second mode is related to warm temperature anomalies over the Northern Hemisphere continents and the increased equatorial Pacific precipitation. The large model dependence of the SWI is created by the third mode, which represents the weak Pacific High in northern East Asia and is characterized with suppressed vertical motions over the northern Indian and Pacific oceans. The fourth mode is the Okhotsk High. The fifth mode represents the east–west contrast of the southern East Asian surface pressure anomalies and is associated with the Northern Hemisphere ocean temperatures. The fourth and fifth modes feature the mean projection using the 10 models reproducing an accurate present-day summertime East Asian climatology.
The mode-related suppressed vertical motions in global warming reflect the present-day vertical motion (i.e., precipitation) climatology; hence, the future increase/decrease in the SWI tends to be projected by models simulating the relatively small/large Asia Pacific monsoon precipitation over the tropical oceans, except near the mountains, in the present-day model climatology.
Future changes in the Asian summer monsoon precipitation are of great interest to the inhabitants of the Asia Pacific regions. Therefore, this issue has received considerable attention (Meehl and Washington 1993; Kitoh et al. 1997; Kimoto 2005; Ueda et al. 2006). Seo et al. (2013) assessed the wetter East Asian summer monsoon in the future using the fifth phase of the Coupled Model Intercomparison Project (CMIP5: Taylor et al. 2012) models that simulated an accurate East Asian precipitation climatology. Their result was consistent with the “wet–get–wetter” effect (Held and Soden 2006) in East Asian summer.
Seager et al. (2010) analyzed the mechanism of future changes in the large-scale hydrological cycle by separating the changes in precipitation minus evaporation into the thermodynamic changes in the mean moisture amount, dynamic changes in the mean atmospheric circulation, and moisture eddy transport changes. They showed that the weakening of the tropical divergent circulation partially opposes the thermodynamic contribution in the intertropical convergence zone (ITCZ) and the descending branches of the Walker and Hadley cells. Chou and Neelin (2004) studied the mechanism of global warming impacts on the regional tropical precipitation under the assumption of quasi-equilibrium convective closures. They intensified the importance of moistened boundary layers over convective regions and moisture advection over the margins of convective regions. The future changes in heat advection can also be an important mechanism for the future regional precipitation change in East Asian summer (Ose 2017).
Li et al. (2010) focused on the East Asian circulations and subtropical Meiyu–Baiu–Changma rainband in the analysis of the CMIP3 ensemble models and indicated their position change instead of their intensity change for the summer East Asian monsoon under global warming. Horinouchi et al. (2019) also showed a southward shift of the summertime rainband during the future East Asian early summer based on the CMIP5 ensemble model analysis, which was consistent with the theoretical relationship between the upper westerly jet and the rainband in East Asia. Meanwhile, Hirahara et al. (2012) found a southward shift of the upper westerly jet in the East Asian early summer, but did not confirm a similar shift in the rainband in the CMIP5 model projections simulating an improved present-day East Asian model climatology. Zhou et al. (2017) concluded that the uncertainty of the future change in the East Asian summer precipitation is caused by the uncertainty associated with atmospheric circulation changes.
According to Ose (2019b), the future decrease in monthly precipitation is possible in East Asia regionally against the “wet–get–wetter” effect because of the strong northeasterly wind and the associated adiabatic downward motion anomalies in the case of the 10 CMIP5-model ensemble chosen to accurately simulate the present-day East Asian climatology of precipitation and westerly jet. They also suggested that the model dependence of the abovementioned causal circulation change was related to that of the present-day tropical climatology of precipitation. The similar future changes were more clearly seen in the future projections made by the high-resolution Meteorological Research Institute's atmospheric general circulation models (MRI-AGCMs) (Ose 2019a), which displayed high skills in comparing present-day simulations with other climate models (Kusunoki et al. 2016; Mizuta et al. 2012), although the observed present-day sea surface temperature (SST) was prescribed for the MRI-AGCMs.
IPCC (2013) reported that in the CMIP5 future projections for the period 2075–2099 made under the Representative Concentration Pathway (RCP) 8.5 global warming scenario, the southerly surface wind index for the summertime East Asian monsoon is greater in the future than the present-day on the ensemble average. However, the differences among the models are much larger than the average (Fig. 14.5 in IPCC 2013), where the southerly surface wind index is defined as the east–west difference in the future change in the sea-level pressure over East Asia. This raises the question: Where does such a large model dependence of the East Asian southerly surface wind come from?
The summertime East Asian monsoon is characterized by a southerly surface wind blowing between the hot Eurasian Continent and the relatively cool Pacific Ocean and a northerly upper wind on the eastern side of the Tibetan High. Endo et al. (2018) clarified the roles of the increased temperature over land and ocean in the future changes in the Asian summer monsoon: the southerly surface wind over the East Asian oceans and the westerly wind over the South Asian oceans tend to be weakened by the increased ocean temperature, while the surface monsoon winds over the East Asian continent and the South Asian continent are strengthened by the increased land surface temperature under global warming. The similar future change in the surface monsoon winds over East Asia was confirmed in the analysis of the 60 km-resolution MRI-AGCM global warming experiments (Ose 2019a), which suggested that the suppressed upward motions in the vertically stabilized atmosphere (Vecchi and Soden 2007) over South Asia and Southeast Asia are responsible for the weakened southerly surface wind over the East Asian oceans and the weakened northerly upper wind over East Asia.
The reminder of this paper is organized as follows: Section 2 provides the data used in this study; Section 3 presents the methodology for the resolution; Section 4 describes the results; and Sections 5 and 6 provide the discussion and the summary, respectively.
The 38 CMIP5 ensemble models (Table 1) of historical and global warming experiments under RCP 8.5 were analyzed herein. The difference between the two sets of 25-year simulations covering the present-day period from 1980 to 2004 and the future period from 2075 to 2099 is defined as the future change. Meanwhile, a future anomaly was basically used herein to indicate the future changes of individual models relative to the CMIP5 38-model ensemble mean future change. The future change for each model was adjusted to the value at an annual mean global warming of 4 K using the future projection of the 25-year annual global mean surface air temperature. The Global Precipitation Climatology Project (GPCP; Adler et al. 2003) and the Japanese 55-year Reanalysis (JRA-55 Reanalysis; Kobayashi et al. 2015) were used to compare the precipitation and the atmospheric elements between the simulated and observed present-day climatology. All data used in the study were re-gridded to 2.5° × 2.5° in longitude and latitude.

Figure 1a shows the future changes in the CMIP5 ensemble mean surface pressure (dpsMEAN) and the present-day climatology of the mean sea-level pressure during June–July–August (JJA). The future change in the surface pressure (dps) was used for the analysis over the Asia Pacific region, instead of the future change in the mean sea-level pressure (dslp), to avoid confusion in physically explaining the results over the Asian high mountain areas. dpsMEAN denotes the future change toward a lower pressure over northern East Asia and a higher pressure over Eurasia and the tropical ocean, including southern East Asia.
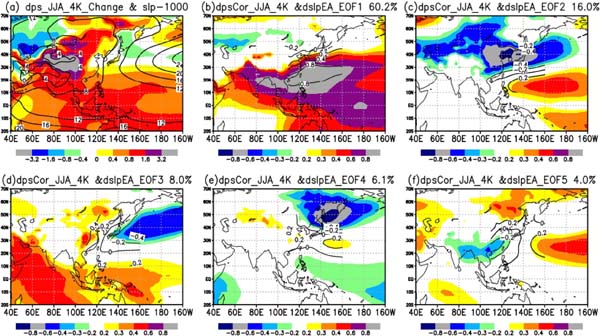
(a) Future changes in the CMIP5 ensemble mean surface pressure (colors with unit of hPa) and the presentday mean sea-level pressure relative to 1000 hPa (contours of every 4 hPa) for JJA. (b) Correlations of the surface pressure anomalies in the future with the dslpEOF1 coefficients (colors). Contours within the East Asian EOF region (110–160°E and 10–50°N) represent dslpEOF1 multiplied by its standard deviation for every 0.2 hPa. (c–f) Same as in (b), except for dslpEOF2-5.
The empirical orthogonal function (EOF) analysis was applied to dslp in the CMIP5 model ensemble over the East Asia EOF domain of (10–50°N, 110–160°E) during JJA to identify the reason for the large variations in the southerly wind index change among the CMIP5 models. Figures 1b–f present the first to fifth EOFs (referred to as dslpEOF1 to dslpEOF5, respectively) together with their multi-model correlation with dps over the Asia Pacific region (referred to as dpsCOR1 to dpsCOR5). A two-tailed statistical test indicates that the correlation coefficients of 0.42, 0.38, 0.32, and 0.30 roughly correspond to the critical values of more than 99, 98, 95, and 90 % significance, respectively.
dslpEOF1 (Fig. 1b) explains 60.2 % of the multimodel variability of dslp over the East Asia EOF domain. The correlated dps (dpsCOR1) represents the strengthened Pacific High over the Pacific and northern Indian oceans. Second, dslpEOF2 (Fig. 1c) represents 16.0 % of the variability. dpsCOR2 consists of low pressure over the mid-latitude Eurasia and high pressure over the subtropical Pacific. The dslp variability governed by dslpEOF3 to dslpEOF5 (Figs. 1d–f) is less than 10 % of the total variance and represents a weak Pacific High over northern East Asia, a pressure anomaly of the weak Okhotsk High, and an east–west pressure contrast over southern East Asia, respectively. dpsCOR3 displays significant correlations with dslp in the western Indian Ocean, suggesting that the dslpEOF3 source is in South Asia.
The characteristics and possible sources of dslpEOFs were statistically studied by investigating their correlations with the changes in the surface pressure, surface air temperature, precipitation, 500 hPa vertical motion, 200 hPa zonal wind, and 700 hPa stream function over the Asia Pacific region. The surface air temperature and precipitation changes are important because they have direct impacts on society and people's daily lives. Future changes in the surface air temperature and vertical motion can be recognized as the drivers of changes in surface pressure, atmospheric circulation, and precipitation. In particular, the suppressed vertical motions caused by the vertically stabilized atmosphere under global warming are the distinguished forcing that leads to suppressed vertical atmospheric circulations. Enhanced vertical motions and increased precipitation can be caused by future surface temperature distributions, such as SST changes. This study gives possible mechanisms for creating dslpEOFs and the associated future Asia Pacific summer monsoon changes. The second row of Table 2 summarizes the major features of dslpEOFs. Section 4 presents the relevant details.

The resolution of dslpMEAN into dslpEOFs clarifies various aspects of dslpMEAN. The third row of Table 2 presents the dslpEOF coefficients of dslpMEAN, which shows that dslpMEAN is mostly decomposed into positive phases of the first to third dslpEOFs. This fact suggests that dslpMEAN possesses the characteristics and cause–result relationship included in dslpEOF1-3.
Ose (2019b) studied the differences in the projections between the CMIP5 model ensemble and the 10 CMIP5 models that best simulate the present-day climatology over East Asia. The future changes in the 10 CMIP5 model mean sea-level pressure (dslpMEAN_10) are resolved into dslpEOF1-5. The fourth row of Table 2 summarizes the coefficients. The negative phases of dslpEOF4 and dslpEOF5 feature the dslp-MEAN_10, which will be discussed in Section 5.
3.2 Southerly wind index and its resolutionThe southerly wind index for East Asia is defined as the difference in the sea-level pressure averaged over 10°N to 50°N between 160°E and 110°E during June–July–August (JJA) in the same manner as in Fig. 14.5 of IPCC (2013), which is apparently positive for the present-day sea-level pressure climatology, as suggested in Fig. 1a. The change in the southerly wind index from the present-day mean to the future mean is the focus of this study; therefore, the change will be referred to as the southerly wind index.
Figure 2a shows the future changes in the southerly wind index for the 38 CMIP5 models normalized against the increase in the global mean surface temperature of 4 K from the present-day. The CMIP5 ensemble mean is slightly positive, but the diversity among the CMIP5 models is much larger than the average. This is consistent with the unnormalized southern wind index shown in Fig. 14.5 of the IPCC WG1 report (IPCC 2013).

(a) Future changes in the East Asian southerly wind index (hPa) for the 38 CMIP5 models. (b–f) Same as in (a), except for the contributions from dslpEOF1-5. The horizontal dashed lines represent the ensemble averages. The horizontal axes in (a–f) have no special meaning.
Figures 2b–f present the contributions of the dslpEOF1-5 components of the 38 CMIP5 models to the future change in the southerly wind index. The ensemble means are indicated by the horizontal dash line in Figs. 2b–f and expressed in figures in the fifth row of Table 2. These figures are also obtained by multiplying the dslpEOF1-5 coefficients of dslpMEAN (third row, Table 2) and the contributions from dslpEOF1-5 per their one standard deviation (SD1-5) to the southerly wind index (bottom row, Table 2).
The positive contribution from the dslpEOF1, dslpEOF2, and dslpEOF5 components (strong East Asian monsoon) is reasonable because the possible mechanism for these dslpEOFs includes the effects of the warm land and cool SST anomalies in the Asia Pacific monsoon region, indicating strong monsoons (Subsection 4.1). The negative contributions from dslpEOF3 and dslpEOF4 are also reasonable because the effects of the suppressed vertical motions in the Asia Pacific monsoon region are included as possible dslpEOF3 and dslpEOF4 sources (Subsection 4.2). Section 4 presents these EOF features.
The reason for the small southerly wind index of the CMIP5 ensemble mean (dslpMEAN) (Fig. 2a) is clarified in Figs. 2b–f, where the positive contributions from the dslpEOF1 and dslpEOF2 components of dslpMEAN are cancelled mostly by the negative dslpEOF3 component of dslpMEAN. Figures 2b–f also show that the model dependence or uncertainty of the future southerly wind index (Fig. 2a) comes from the divergence of the dslpEOF3 component among the models or diversity of the east–west pressure contrast over northern East Asia.
Figure 3a illustrates the ensemble mean surface air temperature changes and the present-day climatology. The Northern Hemisphere (NH) continents are warmer than the surrounded oceans in the future changes and in the present-day climatology. The SST increase is relatively small in the western Pacific than in the other Asia Pacific oceans.

(a) Future changes in the CMIP5 ensemble mean surface air temperature (colors) and its present-day climatology (contours with the labels of every 10°C) for JJA. The future changes between 3.0°C and 3.5°C are represented with every 0.1°C contours with no labels. (b) Correlations of the future surface air temperature anomalies with the coefficient of dslpEOF1 (colors) and the CMIP5 ensemble mean of the surface air temperature changes (contours of every 1°C). The diagonal white lines indicate that the regressed surface temperature anomalies by one standard variation of the dslpEOF1 coefficient are more than 10 % of the CMIP5 ensemble mean in the magnitudes. The white hatching indicates the same meaning as the diagonal lines, except that the regressed anomalies are more than 20 %. (c–f) Same as in (b), except for dslpEOF2-5.
Figures 3b–f depict the future anomalies in the surface air temperature correlated with the dslpEOF coefficients referred to as dtasCORs. A positive dtasCOR1 (Fig. 3b) is distributed not only in northern East Asia, but across the NH mid-latitudes. A negative dtasCOR1 is concentrated over the tropical Pacific and Indian oceans. A significantly positive dtasCOR2 is clearly distributed over the NH continents, such as Eurasia and North America. dtasCOR5 consists of the NH mid-latitude and subtropical negative SST anomalies. Interestingly, much of the dtasCORs expand over other NH regions, indicating that dslpEOFs are not necessarily isolated as local East Asian anomalies.
Figure 4a presents the future precipitation changes and the present-day climatology of the CMIP5 ensemble mean (dprMEAN and prMEAN). Figures 4b–f show dprCOR1–5, which are the precipitation anomalies correlated with dslpEOFs. A significantly negative dprCOR1 (Fig. 4b) is evident in the northern subtropical western Pacific, while a positive dprCOR1 is distributed in the relatively dry areas over the southern Indian Ocean and western and central Asia. No clear signal is detected in northern East Asia. However, when the monthly precipitation changes are examined by calculating their correlations with dslpEOF1 instead of the JJA-mean values, dslpEOF1 is significantly correlated with the future changes in the June and July monthly precipitations in northern East Asia (Figs. 5a–c).

(a–f) Same as in Fig. 3, except for precipitation (mm day−1). The white diagonal lines and the white hatching in (b–f) indicate the regressed precipitation anomalies of more than 50 % and 100 %, respectively, of the CMIP5 ensemble mean changes in the magnitudes.

dprCOR2 (Fig. 4c) is characterized by the positive anomalies along the equatorial central Pacific, negative anomalies in both the NH and Southern Hemisphere (SH) subtropics, and positive anomalies southeast of the Japan Archipelago. These anomalies tend to mostly strengthen the corresponding dprMEAN. dprCOR3-5 (Figs. 4d–f) display the significant regional precipitation anomalies in northern East Asia, especially a large area of positive signals extending from southern East Asia through the Japanese Archipelago for dprCOR5. dprCOR4 shows the dependences of the regional precipitation signals on months (Figs. 5d–f) (i.e., a positive anomaly northeast of Japan and tropical anomalies in the southern maritime continent and the northwestern Pacific that are clear in July and August).
dprMEAN increases over the Asian monsoon regions mainly because of the “wet–get–wetter” effect or moisture increase effect in the future, which is clarified by a comparison with the spatial distribution of the future changes in vertical motions (Section 4.2). In contrast, the precipitation anomalies represented with dprCORs are consistently distributed with the future vertical motion anomalies (Subsection 4.2), indicating the importance of the dynamical effect rather than the moisture increase effect for the model-dependent precipitation anomalies. A further study can be made by comparing dprCORs with the future surface temperature anomalies and the present-day vertical motion (precipitation) climatology. However, these factors are not clearly separated by the EOF modes. For example, the negative precipitation anomalies over the tropical western Pacific (dprCOR1) are basically attributed to the relatively low SST anomalies (dtasCOR1), but the effect of the suppressed vertical motions in global warming creates a small-scale, model-dependent spatial structure in the negative precipitation anomalies (Subsection 4.2).
4.2 Vertical velocity and 200 hPa zonal windFuture vertical velocity changes can generate future changes in the upper atmospheric circulations and winds, whereas future precipitation changes are not necessarily connected with the vertical circulation changes. Future changes in the upper atmospheric circulations and winds may indicate a signal of the teleconnection or wave propagation from the tropical sources caused by vertical velocity changes. In the global warming process, the troposphere is widely recognized to be stabilized vertically with respect to dry static energy; hence, the vertical velocity (i.e., vertical circulation) is weakened (Vecchi and Soden 2007) in proportion to its present-day climatology (Ose 2019b). Therefore, the coincident distribution of the present-day vertical velocity and the future suppressed vertical motion indicates a distinguished forcing under global warming, which will create weakened vertical circulation changes. Another forcing factor is the vertical velocity changes created by future precipitation changes caused by future changes in the surface temperature (Xie et al. 2010) or mid-latitude adiabatic circulation (Ose 2019a). The abovementioned assumption has been recognized by He et al. (2017), who suggested that the projected changes in the subtropical anticyclones are well explained by the combined effect of increased tropospheric static stability and changes in diabatic heating.
Figure 6a shows the CMIP5 ensemble mean changes in 500 hPa vertical pressure–velocity (negative/positive for the upward/downward motion) in the future and its present-day climatology (dw500MEAN and w500MEAN). Major downward changes (positive dw500MEAN) are found for the present-day upward motions (negative w500MEAN) over the Southeast Asian and Indian oceans. In contrast, major upward anomalies are found for the downward climatology of the present-day dry regions in western and central Asia. Downward motion changes are detected over the upward motion climatology around each 10°N and 10°S in the central Pacific, which may correspond to the “double intertropical convergence zone (double ITCZ)” in prMEAN in Fig. 4a. dw500MEAN can be interpreted as a suppressive response to w500MEAN, as described in the previous paragraph. An exception is found over the equatorial western Pacific, where upward motion changes are added to the upward motion climatology.

(a) Future changes in the CMIP5 ensemble mean 500 hPa pressure–velocity (colors) and its present-day climatology (contours of −1.6, −0.8, 0.0, 0.8, and 1.6 hPa h−1) for JJA. A positive/negative pressure–velocity indicates a downward/upward motion. (b) Multi-model correlations of the 500 hPa pressure–velocity anomalies in the future (colors) and present-day climatology (contours with −0.3 and 0.3 and every 0.2) with the coefficient of dslpEOF1. (c–f) Same as in (b), except for dslpEOF2-5.
Figure 7a presents the future changes in the 200 hPa zonal wind (du200MEAN) and its present-day climatology (u200MEAN). The impact of the downward motion changes over the Indian Ocean (Fig. 6a) is confirmed as the southward shift of the Tibetan High and weakened easterlies over the Indian Ocean at 200 hPa. The northern Pacific du200MEAN may be associated with the 10°N ITCZ downward changes, as will be discussed later.

(a) Future changes in the CMIP5 ensemble mean 200 hPa zonal wind (colors) and its present-day climatology (contours of every 10 m s−1) for JJA. (b–f) Correlations of the 200 hPa zonal wind anomalies in the future with the coefficient of dslpEOF1-5 (colors) and the CMIP5 ensemble mean of 200 hPa zonal wind changes (contours of every 1 m s−1).
Figure 6b illustrates dw500COR1 and w500COR1, which are the correlations of the 500 hPa vertical velocity anomaly and the 500 hPa present-day climatology, respectively, with the dslpEOF1 coefficients. The significantly positive anomalies of dw500COR1 are found in the northern Indian Ocean and the western Pacific together with the negative anomalies in the equatorial Indian Ocean. The abovementioned positive (downward motion) anomalies over the low SST anomalies (Fig. 3b) are responsible for the high surface pressure anomalies of dslpEOF1 and dpsCOR1 (Fig. 1b) over the subtropical northwestern Pacific and northern Indian oceans and for the upper circulation anomalies of du200COR1 (Fig. 7b) in East Asia and southern maritime continent. du200COR1 represents the model diversity of the westerly jet anomalies in northern East Asia, which is a key for the behavior of the northern East Asian early summer rainband (Horinouchi et al. 2009). du200COR1 determines a clear separation (or connect) between the southward shifted Eurasian and the Pacific westerly jets of du200MEAN. dw500COR1 is intensified over the reversed sign of w500COR1 widely in the Indian Ocean and the western Pacific. Some discrepancy is seen in the major positive w500COR1 (downward motion tendency in the present-day climatology) area in the northwestern Pacific because the effects of the low SST anomalies and the vertically stabilized troposphere in the future on the vertical motion anomalies tend to be cancelled out on the spot.
Figure 6c depicts dw500COR2 and w500COR2. dw500COR2 is characterized as a direct response to the increased precipitation over the equatorial central (but not western) Pacific and indirect responses around 15°N and 15°S in both hemispheres. du200COR2 (Fig. 7c) consists of the corresponding zonal wind anomalies in the NH Pacific and the negative anomalies from Eurasia into the northern Pacific, which will supposedly generate a north–south temperature contrast around the southern edge of the warmer land (Fig. 3c).
The similarity between du200COR3 (Fig. 7d) and du200MEAN (Fig. 7a) is evident over Eurasia and the northern Pacific, suggesting a corresponding similarity between dw500COR3 and dw500MEAN. The candidate sources of the du200COR3 anomalies over Eurasia and the northern Pacific may be a positive dw500COR3 over the northern Indian Ocean and a negative dw500COR3 around 10°N ITCZ in the central Pacific, respectively. These dw500COR3 sources are located over the present-day opposite-signed w500COR3.
The du200COR4 pattern (Fig. 7e) is also similar to that of du200MEAN (Fig. 7a), but is of the opposite sign. dw500COR4 and w500COR4 (Fig. 6e) in the tropics indicate forcing in global warming (i.e., upward motion anomalies over the northwestern Pacific downward tendency in the present-day model climatology and downward motion anomalies over the upward tendency in the southern maritime continent).
A clear signal in Fig. 6f denotes the upward motion anomalies of dw500COR5 from the southern East Asia to southern China and the Japanese Archipelago, which are collocated with a significant present-day climatological downward tendency of w500COR5 from the Southeast Asian ocean to the tropical Pacific.
4.3 Future Asia Pacific summer monsoon mean and modesThe future CMIP5 ensemble mean changes in the sea-level pressure patterns over summertime East Asia (dslpMEAN) and the anomalies (dslpEOFs) can be recognized as parts of the whole Asia Pacific surface pressure changes and anomalies (Fig. 1). The characteristics of the future Asia Pacific summer monsoon associated with dslpMEAN and dslpEOFs are totally summarized as the future Asia Pacific summer monsoon mean and modes (referred to as dMEAN and dEOFs, respectively) by considering the surface pressure changes and the anomalies pictured schematically in Fig. 8 together with those of the southerly surface wind index, surface air temperature, and vertical motion.

Schematic representation of the Asia Pacific domain qualitatively representing (a) the characteristics of the future Asia Pacific summer monsoon in the CMIP5 ensemble mean projection (dMEAN) and (b) the characteristics of the Asia Pacific summer monsoon anomaly related to dEOF1. (c–f) Same as in (b), except for dEOF2-5. The green squares depict the Eurasia Continent. The “Mid-latitude”, “Subtropics”, and “NH Tropics” terms roughly indicate the latitude zones of northern East Asia, southern East Asia, and the northern tropics, respectively. The "Indian Ocean” and “Western Pacific” terms roughly indicate the longitudinal extents of 60–120°E and 120°E to the date line. The “H” and “L” symbols represent the future changes or anomalies toward the higher and lower surface pressures, respectively, whereas those in parentheses indicate anomalies with a relatively low significance. The red and blue colored arrows represent the surface wind changes or anomalies contributing to the strengthening and weakening the southerly surface wind index over East Asia. The upward/down white arrows are the future changes or anomalies toward the upward and downward vertical motions. The relatively warmer and cooler surface air temperatures in the future are indicated by the red and blue round boxes, respectively.
The low SST and the high surface pressure in the tropical Indian and western Pacific oceans are the common characteristics between dMEAN (Fig. 8a) and dEOF1 (Fig. 8b). Downward motions are also common in the northern Indian Ocean, but only for dEOF1 in the subtropical western Pacific. Therefore, high pressure anomalies are intensified in the subtropical western Pacific for dEOF1. The model diversity represented by dEOF1 includes the precipitation anomalies during the future early summer together with the upper westerly jet anomalies over northern East Asia.
The dslpEOF2 coefficient of dslpMEAN is positive and larger than the standard deviation (SD2), indicating that the features of the dEOF2 (Fig. 8c) are robust in dMEAN (Fig. 8a). The robust common features are the warm surface in the NH land, increased equatorial precipitation (upward motion), and increased precipitation to south of the Japanese Archipelago. The low surface pressure in the northern East Asian ocean is also common. However, the high surface pressure over Eurasia in dMEAN is different from the low surface pressure for dEOF2, which is rather consistent with the warm surface over Eurasia of dEOF2.
The high surface pressure over Eurasia and the weak Pacific High in the northern East Asian ocean are found in dMEAN (Fig. 8a) and dEOF3 (Fig. 8d), respectively. The suppressed vertical motions over the northern Indian Ocean and the northern Pacific ITCZ are also common, as well as the southward shifts of the upper westerly jet over Eurasia and the northern Pacific. Therefore, these vertical motions can be recognized as the major drivers of the Asia Pacific summer monsoon circulations in the future.
The dslpEOF4-5 components of dslpMEAN are too small to find clear evidence of dEOF4-5 in dMEAN; rather, dEOF4-5 contribute to the model-dependent characteristics among the CMIP5 models, already shown in Section 3.
dEOF4 (Fig. 8e) corresponds to the Okhotsk High anomaly, but with an opposite sign. An important difference from the present-day one is that the precipitation anomalies tend to appear over the north or northeast of the Japanese Archipelago only in the late summertime. The source of dEOF4 is the suppressed vertical motions in the northwestern Pacific and over the maritime continent, at least partially.
dEOF5 (Fig. 8f) captures the east–west pressure contrast in southern East Asia. The significant precipitation anomaly is prominent in East Asia. The associated vertical motion anomalies expand into Southeast Asia with the opposite tendency of the present-day model climatology. The eastern part of dslpEOF5 may be attributed to the significant SST anomalies over the mid- to subtropical Pacific, which is also found in the Atlantic sector.
The EOF analysis generally tends to pick up a spatially large-scale variability as primary modes. The results are dependent on fields for analysis, including their domains, phenomena, or seasons. In this study, the Asia Pacific-scale surface temperature anomalies, such as dEOF1 and dEOF2, were more dominant factors for influencing East Asian surface pressure anomalies rather than atmospheric circulation anomalies caused by horizontally small-scale vertical motion anomalies, such as dEOF3 and dEOF4. A future anomaly similar to the Pacific-Japan teleconnection pattern (Kosaka and Nakamura 2011), which is observed as a leading variability in summertime East Asia, is specifically analyzed as the fourth mode dslpEOF4 probably because of its latitudinally small-scale structure.
Ose (2019b) showed that the 10 CMIP5 (CMIP5_10) models more clearly simulated the future changes toward the downward northeasterly wind at 700 hPa and the possibility of the future decreases in the monthly regional precipitation over East Asia compared to the CMIP5 model ensemble. The CMIP5_10 models are the CMIP5 models that best simulate the present-day climatology with respect to both precipitation and 500 hPa westerly over East Asia.
The fourth row of Table 2 summarizes the dslpMEAN_10 coefficients. dslpMEAN_10 has comparable dslpEOF2-3 coefficients and a smaller dslpEOF1 coefficient compared with dslpMEAN. The negative dslpEOF4 and dslpEOF5 coefficients are relatively large in magnitude. Consequently, the negative phases of dEOF4 and dEOF5 represent the characteristics of the CMIP5_10 model mean (dMEAN_10), which are the decrease in precipitation around northern Japan in late summer and the decrease from the Japanese Archipelago to the southern China in JJA (Figs. 5e, f, 4e, f), respectively. The positive, but small dslpEOF1 coefficient may also feature dMEAN_10 relative to the CMIP5 ensemble mean (dMEAN) to some extent. The relatively negative coefficient of dslpEOF1 specifically indicates the southward shifts of the westerly jet (Fig. 7b). The rainband over northern East Asia in the future early summer (Fig. 5a) is clear in the dMEAN_10 compared with dMEAN.
Figure 9a depicts the present-day 700 hPa stream function climatology and its future change for the CMIP5 ensemble mean (dpsi7MEAN). dpsi7MEAN indicates the eastward shrinking of the Pacific High from the northwestern Pacific. Figures 9b–f depict the future changes (not anomalies in this case) based on the statistical regressions of the 700 hPa stream function anomalies onto each dslpEOF coefficient. The 700 hPa stream function changes associated with the negative dslpEOF4 and dslpEOF5 coefficients (dpsi7-SD4 and dspi7-SD5; contours in Figs. 9e, f) seem to capture the features of those for CMIP5_10 MEAN (Ose 2019b). A cyclonic change extends southeast of the Japanese Archipelago in the future, indicating the future changes toward a downward northeasterly wind at 700 hPa and the possible future decrease in the monthly regional precipitation over East Asia, as simulated by the CMIP5_10 models. These results can be confirmed in dprCOR4 and dprCOR5 (Figs. 4e, f). The regressed 700 hPa stream function change for the relatively negative dslpEOF1 (dpsi7-SD1) represents a broad contrast in the meridional wind changes between the continent and the ocean in East Asia, which is also consistent with CMIP5_10MEAN.

(a) Future changes in the CMIP5 ensemble mean 700 hPa stream function (colors) and its present-day climatology (contours of every 4 × 10⁶ m2 s−1) for JJA. (b–f) Multi-model regression of 700 hPa stream function changes in the future for the plus one standard deviation anomaly of the dslpEOF1-5 coefficients (colors) and the minus one standard deviation anomaly (contours with every 0.5 × 10⁶ m2 s−1).
The suppressed vertical motions in the tropics are considered as one of the most important factors in explaining dEOFs in the Asia Pacific region. Ose (2019a) showed that the distribution of the suppressed vertical motions in the future tropics was closely related to the distribution of the present-day model climatology of vertical velocity and precipitation.
The GPCP observation and the CMIP5 ensemble model simulation consistently show the characteristics of the present-day climatology of the Asia Pacific summer monsoon precipitation in Fig. 10a (i.e., wet over South Asia, Southeast Asia, and northern and southern ITCZ off the equator, but relatively dry over the western and central Asia, subtropical SH, equatorial Pacific, and subtropical northwestern Pacific between 20°N and 30°N).

(a) Thirty-eight-member CMIP5 ensemble mean (colors) and GPCP mean (contours) precipitation for the present-day 25 years between 1980 and 2004 with the interval of 2 mm day−1. (b–f) Multi-model correlations of the present-day model precipitation with the coefficients of dslpEOF1 to dslpEOF5 (colors) and the present-day CMIP5 ensemble mean precipitation (contours for 2, 4, 8, and 16 mm day−1), except that the signs of the dslpEOF3 and dslpEOF4 coefficients are reversed to indicate a contribution to the increase in the southerly surface wind index.
Figures 10b–f show the multi-model correlations between the simulated present-day precipitation and the dslpEOF coefficients after choosing signs of the dslpEOF coefficients, such that the positive coefficients represent an increase in the southerly wind index. Only the signs of the dslpEOF3 and dslpEOF4 coefficients are reversed in the calculation of the multi-model correlations. Figures 10b–f indicate the precipitation tendency of the present-day climatology simulated by the models contributing to the positive southerly wind index by the dslpEOF1-5 pattern. Figs. 10b–f evidently show that these models tend to simulate the weak Asia Pacific summer monsoon precipitation in their present-day climatology. A positive dslpEOF1 component in the future is specifically preferred by models simulating a present-day dry tendency over northwestern Pacific and the northern and southern ITCZ and a wet tendency over central Asia, subtropical SH, and equatorial Pacific. A positive dslpEOF2 component is generated by the models that simulated a dry tendency over Southeast Asia and a wet tendency over the equatorial Pacific. A negative dslpEOF3 component is found in the projections by the models simulating a present-day dry tendency over South Asia and a wet tendency over the subtropical northwestern Pacific. A positive dslpEOF5 component is found in the future projections of the models simulating the present-day dry tendency over Southeast Asia and the wet tendency over western Asia, subtropical SH, and equatorial Pacific. The exception is a negative dslpEOF4 related to the present-day dry tendency of the SH monsoon region. Note that the negative dslpEOF4 component corresponds to the appearance of the Okhotsk High, giving a cold northerly wind in the present-day Japanese climatology.
Twenty-nine CMIP5 models out of the 38 CMIP5 models reproduce the present-day precipitation climatology in the tropical Asia Pacific region (40°E–160°W, 20°S–20°N) with more than 0.7 spatial correlation with the GPCP precipitation. Figure 11a shows the present-day precipitation climatology of the 22 models simulating the increase in the East Asian southerly wind index in the future among the 29 CMIP5 models. Figure 11b is the same as Fig. 11a, but for the seven CMIP5 models simulating the decrease in the southerly wind index in the future. Both the 22 and seven model means successfully simulate the present-day precipitation climatology.

(a) Same as Fig.10a, but for the simulated present-day precipitation climatology for the 22 CMIP5 models simulating the positive southerly wind index in the future and reproducing the observed present-day tropical precipitation climatology with more than 0.7 correlations (see the text in details). (b) Same as (a), except for the seven CMIP5 models simulating the negative southerly wind index in the future. (c) Difference between the above 22 and seven models (colors). The white diagonal lines and white hatching indicate the differences with more than approximately 95 % and 97.5 % statistical significances on the one-tailed t-test. (d) Same as in (c), except for the difference between the 29 CMIP5 models and the GPCP precipitation. The differences are more than 97.5 % significant over most of the regions. The contours represent the observed precipitation climatology with 2, 4, 8 and 12 mm day−1.
However, significant systematic differences exist between them (Fig. 11c). The 22 models simulated less precipitation over the observed wet regions of the tropical oceans compared to the seven models, except near the mountains (e.g., Indochina Peninsula, Philippine Islands, and southern Indian subcontinent, where the precipitation is much sensitive to moisture transport by winds). In contrast, compared with the seven models, the 22 models produce a relatively wet climatology over the observed relatively dry regions of the Indian and Pacific oceans and the inner Eurasia. The abovementioned systematic differences between the 22 and seven models are statistically significant, but too small to distinguish only using the spatial correlation skill between the present-day simulated and observed precipitations in the tropical Asia Pacific region.
Figure 11d depicts the precipitation bias of the 29 models from the GPCP. A wet climatology bias is found, except in the South Asian land and East Asian rainband. The total bias pattern in the Asia Pacific region has a feature of neither the 22 nor seven model climatology. The features of the differences between the models simulating the increase and the decrease in the southerly wind index are intensified when all the 38 CMIP5 models dividing into the 26 and 12 models are used (not shown).
The differences in the present-day model precipitation between the 22 and seven models are reasonable because the present-day large upward motions in the Indian and Pacific Oceans lead to a large suppression of the upward motions and the weak Asia Pacific monsoon circulations under global warming. The associated mechanism is studied using the CMIP5 experiments specifying the future increase in the surface temperature only over the oceans (Endo et al. 2018).
The southerly wind in East Asia is a simple, but fundamental measure of the summertime East Asian monsoon. According to Fig. 14.5 of the IPCC (2013), the future change in the southerly wind index over East Asia, as defined by the east–west contrast in sea-level pressure, is positive in the ensemble average, but retains a considerable amount of uncertainty because of the large variations among the CMIP5 ensemble members. This study used the EOF analysis to decompose the future sea-level pressure changes during the East Asian summer and explain the future mean change in the pressure patterns and its uncertainty.
The dslpEOF1-2 components of the dslpMEAN are positive, showing that the surface temperature changes (warm NH continents and low tropical SST) in the future cause the low pressure in the northern East Asian land and the high pressure over the southern East Asian ocean. These components contribute to the positive southerly wind index. By contrast, the positive dslpEOF3 component of dslpMEAN indicates that the suppressed vertical motions in the present-day upward climatology over the northern Indian Ocean and the northern Pacific ITCZ produce a weak Asia Pacific summer monsoon circulation and the negative southerly wind index in the future because of the high pressure over Eurasia and weak Pacific High in northern East Asia. Although dslpMEAN partially includes various dslpEOF1-3 characteristics, their contributions to the southerly wind index are almost cancelled.
The southerly wind index variations in the CMIP5 ensemble future projections mostly come from the dslpEOF3 component variations depicting the Pacific High anomalies in the northern East Asia. This fact suggests that the suppressed vertical motions in South Asia, especially over the northern Indian Ocean and the northern Pacific ITCZ region, are pointed out as the origin of the large uncertainty of the southerly wind index (i.e., East Asian summer monsoon) in the future.
The future projection using the CMIP5_10 models simulating the accurate present-day East Asian summertime climatology (Ose 2019b) is identified using the dslpEOFs decomposition. The negative coefficients of dslpEOF5 and dslpEOF4 form the dslpMEAN_10 characteristics because these coefficients of the dslpMEAN are almost negligible. The negative dslpEOF5 component indicates a significantly decreased precipitation anomaly over East Asia in the future, while the negative dslpEOF4 component denotes the appearance of the Okhotsk High related to the decreased precipitation anomaly in the northern Japanese Archipelago in the future late summertime. The dslpEOF1 component of dslpMEAN_10 is negatively relative to that of dslpMEAN, indicating that the southward shifts of the westerly jet and early summer rainband over East Asia are relatively clear in the future. These features are confirmed for the future changes in monthly precipitation in the CMIP5_10 mean projection compared with those in the CMIP5 ensemble mean projection (Ose 2019b).
dslpEOFs (or its reversed ones) involve the downward vertical motion anomalies in the future over the present-day upward vertical motion and heavy precipitation tendency in the tropical model climatology, especially over the oceans, and tend to create the weak Asia Pacific summer monsoon circulation and the negative southerly surface wind index in East Asia. This result leads to the finding that the positive/ negative contributions to the southerly wind index in the future tend to be given by the models simulating the weak/strong Asia Pacific monsoon precipitation over the tropical oceans from South Asia through Southeast Asia to the western Pacific in the present-day climatology.
An interesting thing is that the abovementioned differences in the present-day precipitation climatology are statistically significant, but too small to be detected only by comparing the Asia Pacific spatial correlation skills between the present-day tropical model and GPCP precipitations. Furthermore, considering that the observed precipitation data may include some uncertainty anyway, the obtained knowledge on the sensitivity of the future East Asian southerly wind index to the present-day tropical precipitation climatology could be important for designing East Asian multi-model future projections. Needless to say, precipitation physics and atmosphere–ocean coupling, including the cloud radiation process over the oceans, are important in climate modeling.
This work was supported by the Environment Research and Technology Development Fund (2-1904) of the Environmental Restoration and Conservation Agency of Japan. We thank two anonymous reviewers for their comments and Yoshiyuki Kajikawa for his advice on the revise.