Abstract
Precipitation consists of many types of hydrometeors, such as raindrops, ice crystals, graupel, and hail. Due to their impacts, graupel and hail (GH) have received particular attention in the literature. Global Precipitation Measurement (GPM) dual-frequency radar (DPR) has proved to be a very reliable system for global precipitation retrievals. This paper aims to develop a GH identification algorithm for GPM DPR. This algorithm is constructed using a precipitation type index (PTI) defined for DPR. The PTI is effective in separating hydrometeor types and is calculated using measurements of reflectivity, dual-frequency ratio, and storm top height data. The output of the algorithm is a Boolean product representing the existence of graupel or hail along with the vertical profile for each Ku- and Ka-band matched footprint. Cross validation is performed with the Weather Service Radar (WSR-88D) network over continental United States as well as during the Remote sensing of Electrification, Lightning, and Mesoscale/Microscale Processes with Adaptive Ground Observations (RELAMPAGO) experiment. Evaluation of the GH identification algorithm is performed on a global basis, which illustrates promising comparisons with the global lightning and hail precipitation maps generated using radar and radiometer.
1. Introduction
Severe weather and climate events caused by graupel and hail (GH) have increased in recent decades. Each year, hail alone causes billions of dollars [U.S. dollars (USD)] of damage worldwide, including property and crop damage. The destructive nature of such severe events has motivated the scientific community to improve detectability of the storms (Depue et al. 2007; Cecil 2009; Prakash et al. 2016; Mazzoglio et al. 2019; Wang et al. 2019).
Satellite-based remote sensing techniques provide more spatially homogeneous observations of severe weather hazards than storm spotter reports. The Global Precipitation Measurement (GPM) core observatory spacecraft, which was launched successfully in February 2014, is a good example. Since its launch, the GPM core satellite has provided valuable continuous precipitation observations on a global scale. The GPM core satellite is equipped with a dual-frequency precipitation radar (DPR) operating at Ku- (13.6 GHz) and Ka- (35.5 GHz) bands. The DPR on board the GPM core satellite improves understanding of precipitation processes relative to the single-frequency (Kuband) radar used in the Tropical Rainfall Measuring Mission (TRMM) by providing greater dynamic range, more detailed information on microphysics, and better accuracies in rainfall and liquid water content retrievals (Hou et al. 2014; Skofronick-Jackson et al. 2017; Yamaji et al. 2020).
The two independent observations offered by GPM DPR are Ku- and Ka-band reflectivity measurements. The difference between these two DPR measurements (in dB scale) is called the measured dual-frequency ratio (DFRm). Two parts comprise the measurement of DFRm: 1) the dual-frequency ratio and 2) the attenuation difference. When the radar beam from the top propagates through precipitation, such as the melting layer or moderate to heavy rain, it undergoes attenuation. However, attenuation from the Ka-band is greater than from the Ku-band. Meanwhile, non-Rayleigh scattering occurs in the precipitation at both the Ku- and Ka-bands, affecting the Ka-band more severely than the Ku-band. This makes the DFRm a viable parameter for making inferences about observations.
The vertical features of the DFRm profile have been studied for different precipitation types. In the classification module of the GPM DPR level-2 algorithm, the DFRm is a key parameter that has been widely used in the classification of profile types and the detection of melting regions (Le and Chandrasekar 2012a, b). In 2017, Le et al. developed a surface snowfall identification algorithm mainly based on the features of reflectivity and DFRm (Le et al. 2017). A precipitation type index (PTI) was then defined with three key components: the DFRm slope with height, the Kuband reflectivity peak, and the height of the storm top. The output of the algorithm, a flag called “flagSurface Snowfall”, detects whether surface snowfall exists or not. Le and Chandrasekar (2019) demonstrate the successful validations of the surface snowfall identification algorithm.
In this current research, a new algorithm is developed to identify GH for GPM DPR along each vertical profile with matched Ku- and Ka-band observations. This algorithm is mainly based on the vertical profile and its variations of reflectivity and DFRm. The same PTI defined in Le et al. (2017) is used in this GH identification algorithm, but with a different method. This PTI is found to be a very effective index to help separate DPR vertical profiles with surface snowfall or GH. The flag created by this algorithm is called “flagGraupelHail”. It is a Boolean product stored in the Experimental Module in the DPR algorithm version V6X. Its format is similar to the product of flagSurfaceSnowfall. An output of 1 indicates the presence of either graupel or hail, while an output of 0 means neither graupel nor hail exists. This flag indicates whether graupel or hail exists at some height along the vertical profile, while not necessarily falling on a surface. Details of the algorithm are described later in Section 2.
Section 2 describes the GH identification algorithm in detail. In Section 3, the algorithm is validated for cases observed synthetically by GPM DPR and the Weather Service Radar (WSR-88D) network. Section 4 discusses the algorithm validation during the Remote sensing of Electrification, Lightning, and Mesoscale/Microscale Processes with Adaptive Ground Observations (RELAMPAGO) field campaign. In Section 5, a global map is generated and compared with other GH products. Additionally, potential improvements are discussed. Section 6 contains the summary and conclusions.
2. Algorithm description
The three components of the PTI (previously called the “snow index” in Le et al. 2017) are the DFRm mean slope, the maximum value of reflectivity at the Ku-band, and the storm top height. The definition of PTI is
In (1), the DFRm
slope (in dB km
−1) is along the vertical height. The slope is used instead of the DFRm value due to its immunity to calibration change. The average of the DFRm slope is taken along the vertical profile with the bin number ranging from the storm top until clutter free. Zmku
max (in dBZ) represents the maximum reflectivity at the Ku-band along the profile. Storm_top_height represents the altitude of the storm top in km.
In general, the absolute value of the DFRm slope in the numerator of (1) is high for a profile with snow particles due to the rapid increase in size during aggregation. Typically, high reflectivity and DFRm values are observed to be associated with large rimed GH particles and heavy attenuation. However, the slope of the DFRm for GH is lower for aggregates. During formation, the heavily rimed particles may be lifted up by the updraft. There is no strong indication of oneway size increase or attenuation difference increase. The peak of the Ku-band reflectivity Zmkumax in the denominator of (1) is higher for GH than for snow, while the storm top height in the denominator is usually lower for snow and stratiform rain than for a profile with GH (Houze 1997). Table 1 lists the qualitative range of the three components in PTI for snow, stratiform rain, and GH. The PTI is expected to be higher value for a snow profile and lower for GH. To study realistic GH profiles, more than 1,000 GPM DPR profiles with GH were collected, identified using both the WSR-88D radar network and ground observations, such as ground hail reports. First, strong precipitation events from 2017 observed by both DPR and WSR-88D radars were selected. Then, the algorithm described in Bechini and Chandrasekar (2015) was applied to identify hydrometeors for the WSR-88D radars. Whenever GH was identified at a specific range resolution, the DPR profile with the smallest latitude and longitude difference was chosen to be the candidate profile in the database. The vertical feature of the DFRm mean slope, the Zmkumax values, and the storm top height of these vertical profiles were studied. Figure 1 shows the histogram of the DFRm mean slope (absolute value), the maximum reflectivity at the Ku-band, and the storm top height for the collected profiles. In Fig. 1a, the mode of the histogram for the DFRm mean slope along the vertical profile (“VP” in the plots) is around 3 dB km−1. In Le et al. (2017), this value is 5 dB km−1 for snow profiles. As shown in Fig. 1b, more than 90 % of Ku-band maximum reflectivity is higher than 35 dBZ, with the mode of distribution at around 47 dBZ. This is the typical reflectivity peak value observed during strong convections. The storm top height in km is higher than 6 km, as illustrated in Fig. 1c, with a mode of around 12 km. For comparison, in Le et al. (2017), the Zmkumax values and storm top heights for snow profiles are all below 35 dBZ and 5 km, respectively. These findings are consistent with those shown in Table 1.
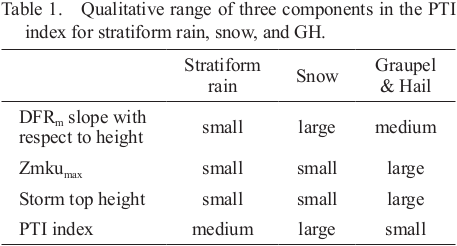

Figure 2 presents a histogram of the PTI for snow as well as for GH profiles. The dashed squared line represents snow profiles, and the dashed line is for GH. A good separation of PTI values can be observed for both snow and GH profiles. The embedded plot of Fig. 2 shows a probability density function curve calculated for the PTI values of GH profiles. As illustrated, this index value is statistically lower than 5.5 in around 85 % of GH profiles, which is the threshold used in the current V06X algorithm, while in Le et al. (2017), 90 % of snow profiles have PTI values higher than 17. A good separation of PTI forms the fundamental basis of the algorithm. It should be noted that GH detected in the current algorithm indicates only the existence of the type and not the location along the height. Strong convective rain with graupel or hail aloft and melting particles and rain below qualifies the flag. Distinguishing between GH is part of ongoing research, and this function is not available in the current algorithm.

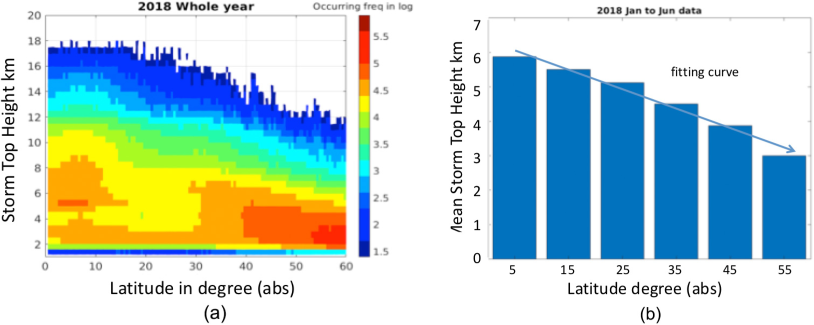
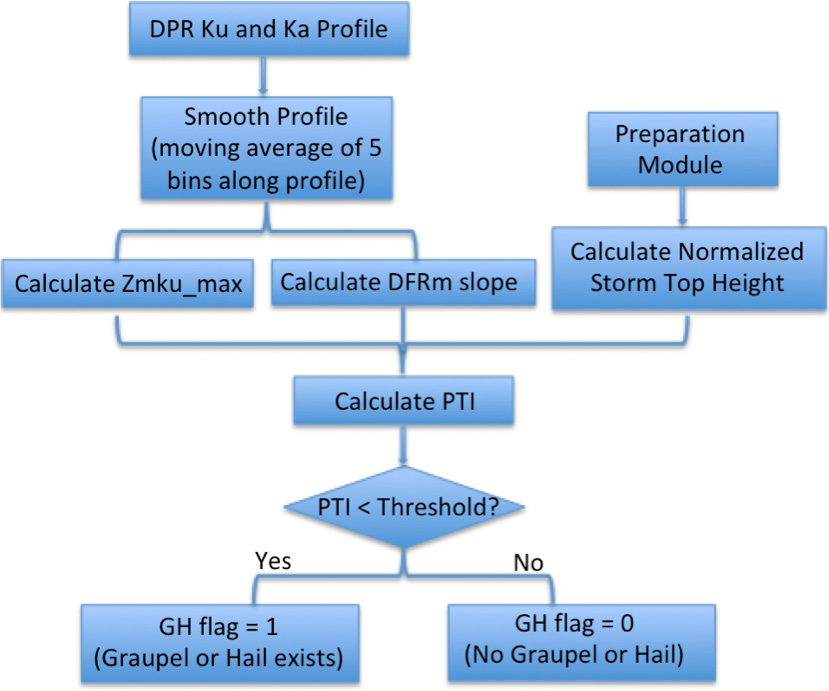
Figure 3a shows a frequency plot of storm top height (GPM product) for the year of 2018 grouped by every 10° in latitude. A rough linear fitting to the mean values of storm top heights at the 10° latitude groups is illustrated in Fig. 3b. It is observed that the storm top height is a decreasing value from the equator to the poles. A storm top normalization is introduced to obtain a smooth transition of GH detection along varying latitudes globally. Figure 4 contains the flowchart of the GH identification algorithm.
3. Algorithm evaluation
3.1 Validation with the WSR-88D radar network
The ground validation radar used in this study is the WSR-88D radar. The WSR-88D radar is a network of 160 high-resolution S-band dual-polarization Doppler radars operated by the National Oceanic and Atmospheric Administration (NOAA) of the United States. In the validation process, precipitation events simultaneously observed by the GPM DPR and WSR-88D radars are chosen first. Second, the hydrometeor type is classified for the WSR-88D radar observations to pick strong events with GH. Then, the product of flagGraupelHail is calculated for DPR observations during those events. Finally, the hydrometeor type results from two radar systems are compared.
In this manner, between May and September 2018, 13 intense weather events were chosen from the United States for ground validation purposes. Figure 5 is a map of the United States with the radar locations for the validation cases. The performances for the sample cases are shown in Figs. 6, 7, and 8. These three sample cases were from South Dakota, Alaska, and Nebraska. The South Dakota and Nebraska cases were selected because they contain GH hydrometeors, compared with other cases in which only graupel or hail exists. The Alaska case was chosen especially to demonstrate the algorithm's adaptability to high latitudes.


In Fig. 6, an intense precipitation event on August 24th, 2018 was simultaneously observed by GPM DPR orbit # 25489 at UTC 02:42:57 together with the WSR-88D KABR radar located at Aberdeen, South Dakota at UTC 02:42:02. Figure 6a shows the map of the DPR overpass over the United States mainland on August 24th, 2018 and the location of the WSR- 88D radars. The solid and dashed black lines represent the DPR's outer and inner swaths. The solid red line is the DPR's nadir. The black circles are the 100-km range of the WSR-88D radars that have overlapped observations with the DPR on that day. The black diamond symbol indicates the location of the KABR radar, which is the case discussed here. In Figs. 6b and c, two PPI scans illustrate the S-band reflectivity of the KABR radar at an elevation of 2.42° and 6.41°, respectively. A high reflectivity value above 45 dBZ can be observed at the eastern side as well as at the southwestern side of the radar. The hydrometeor identification algorithm from Bechini and Chandrasekar (2015) is applied, and the hydrometeor types are presented in Figs. 6d and e. “GR” (shown as a mauve color) and “HA” (shown as a yellow color) represent GH in the algorithm. Not surprisingly, in (d), graupel is found to the east and southeast of the KABR radar at an elevation of 6.41°. Hail is also detected southeast to the KABR radar. In Fig. 6e, graupel is identified southwest of the KABR radar. The orange ovals indicate the locations. Figure 6f is the plot of the DPR Ku-band reflectivity at a height of 2 km, with dashed and solid black lines representing the DPR's inner and outer swaths. The circle represents the 100-km range of the KABR radar. The result of flagGraupelHail is shown in (g), with the dark-green color indicating the existence of GH. The two ovals in (d) and (e) encircle the GH areas with spot wise agreement with the findings in (g). It should be noted that, in the validation cases, only the DPR's inner swath data are taken. The graupel detected southwest to the KABR radar shown in (e) is outside the observation area for the DPR's inner swath. When flagGraupelHail = 1, it means that GH exist along the vertical profile, but does not specify the range bin (or height) at the current stage.
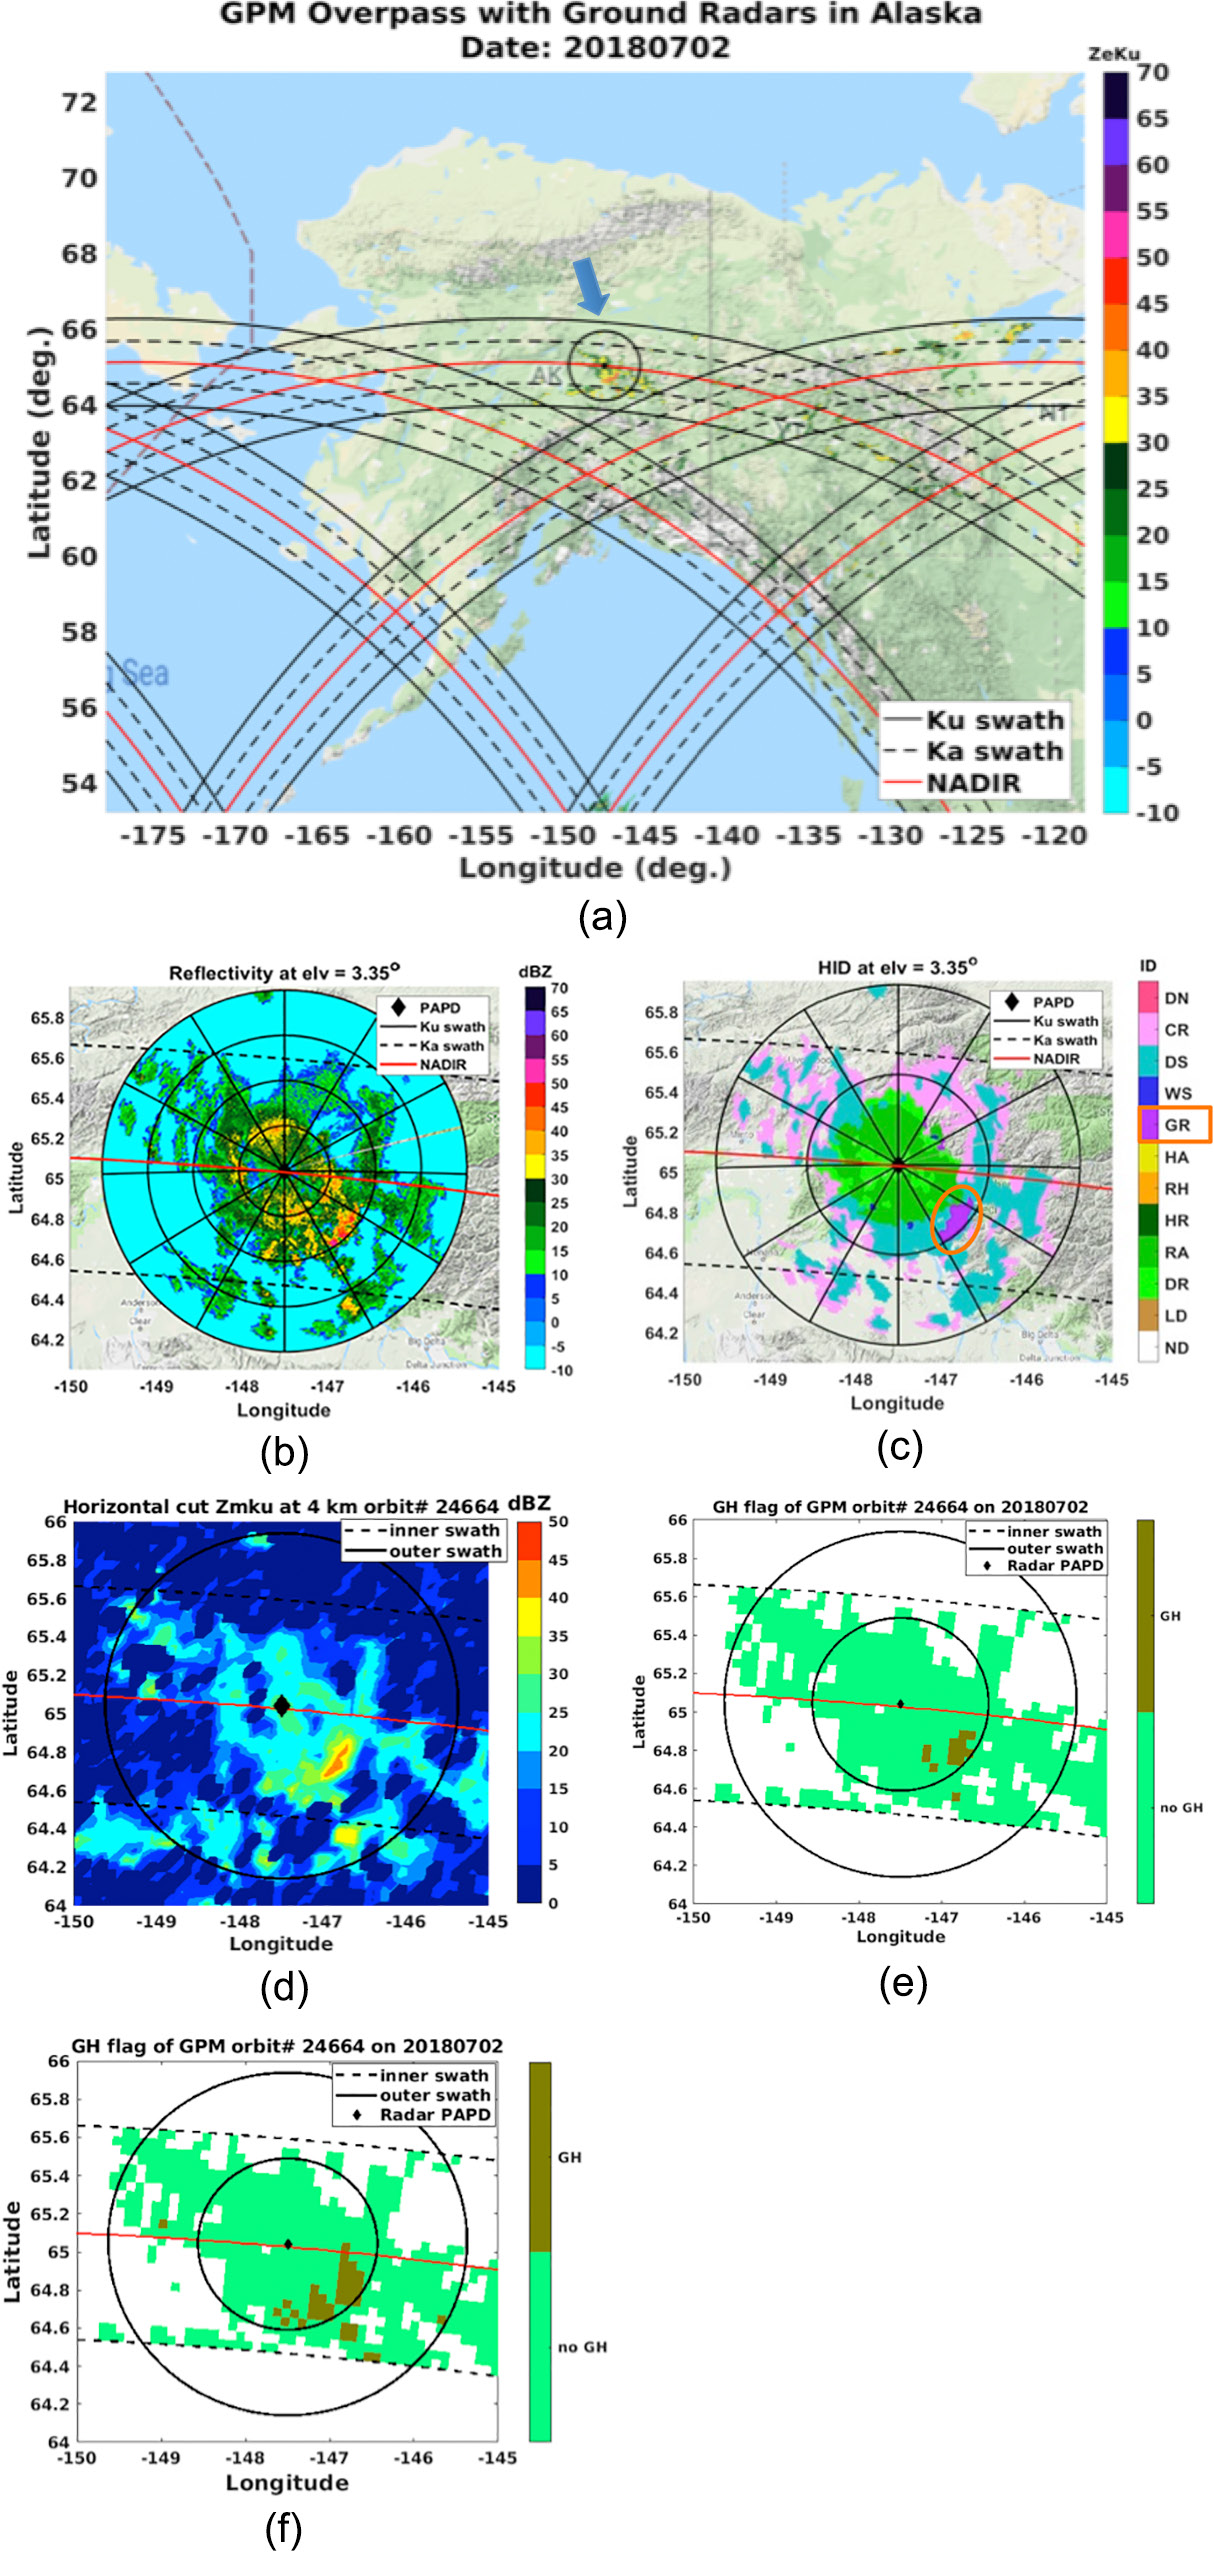
Figure 7 presents a validation case that occurred at high latitude. The precipitation event was on July 2nd, 2018 near Fairbanks, Alaska with a latitude of 64.83°N. The event was observed by GPM DPR orbit # 24664 at UTC 02:03:33 along with the WSR-88D radar PAPD at UTC 02:03:56. Figure 7a shows the map of the overpass and the location of the PAPD radar. In Fig. 7b, a PPI scan illustrates S-band reflectivity at an elevation of 3.35°. A high reflectivity value above 45 dBZ can be observed in the southeastern direction. The same hydrometeor identification algorithm was applied, and the hydrometeor types are illustrated in Fig. 7c. Graupel is identified southeast to the radar, and the orange oval indicates the locations. Figure 7d is the plot of the DPR Ku-band reflectivity at 4 km. The result of flagGraupelHail is shown in Fig. 7e, with the dark-green color indicating that GH exists. For comparison, Fig. 7f shows the flagGraupelHail result without the storm top normalization due to latitude. A comparison of Fig. 7c with Figs. 7e and 7f reveals that the flags in Fig. 7e illustrate a pointby- point correspondence, agreeing with the results in Fig. 7c. The good performance of this case indicates that storm top normalization functions properly in the algorithm.
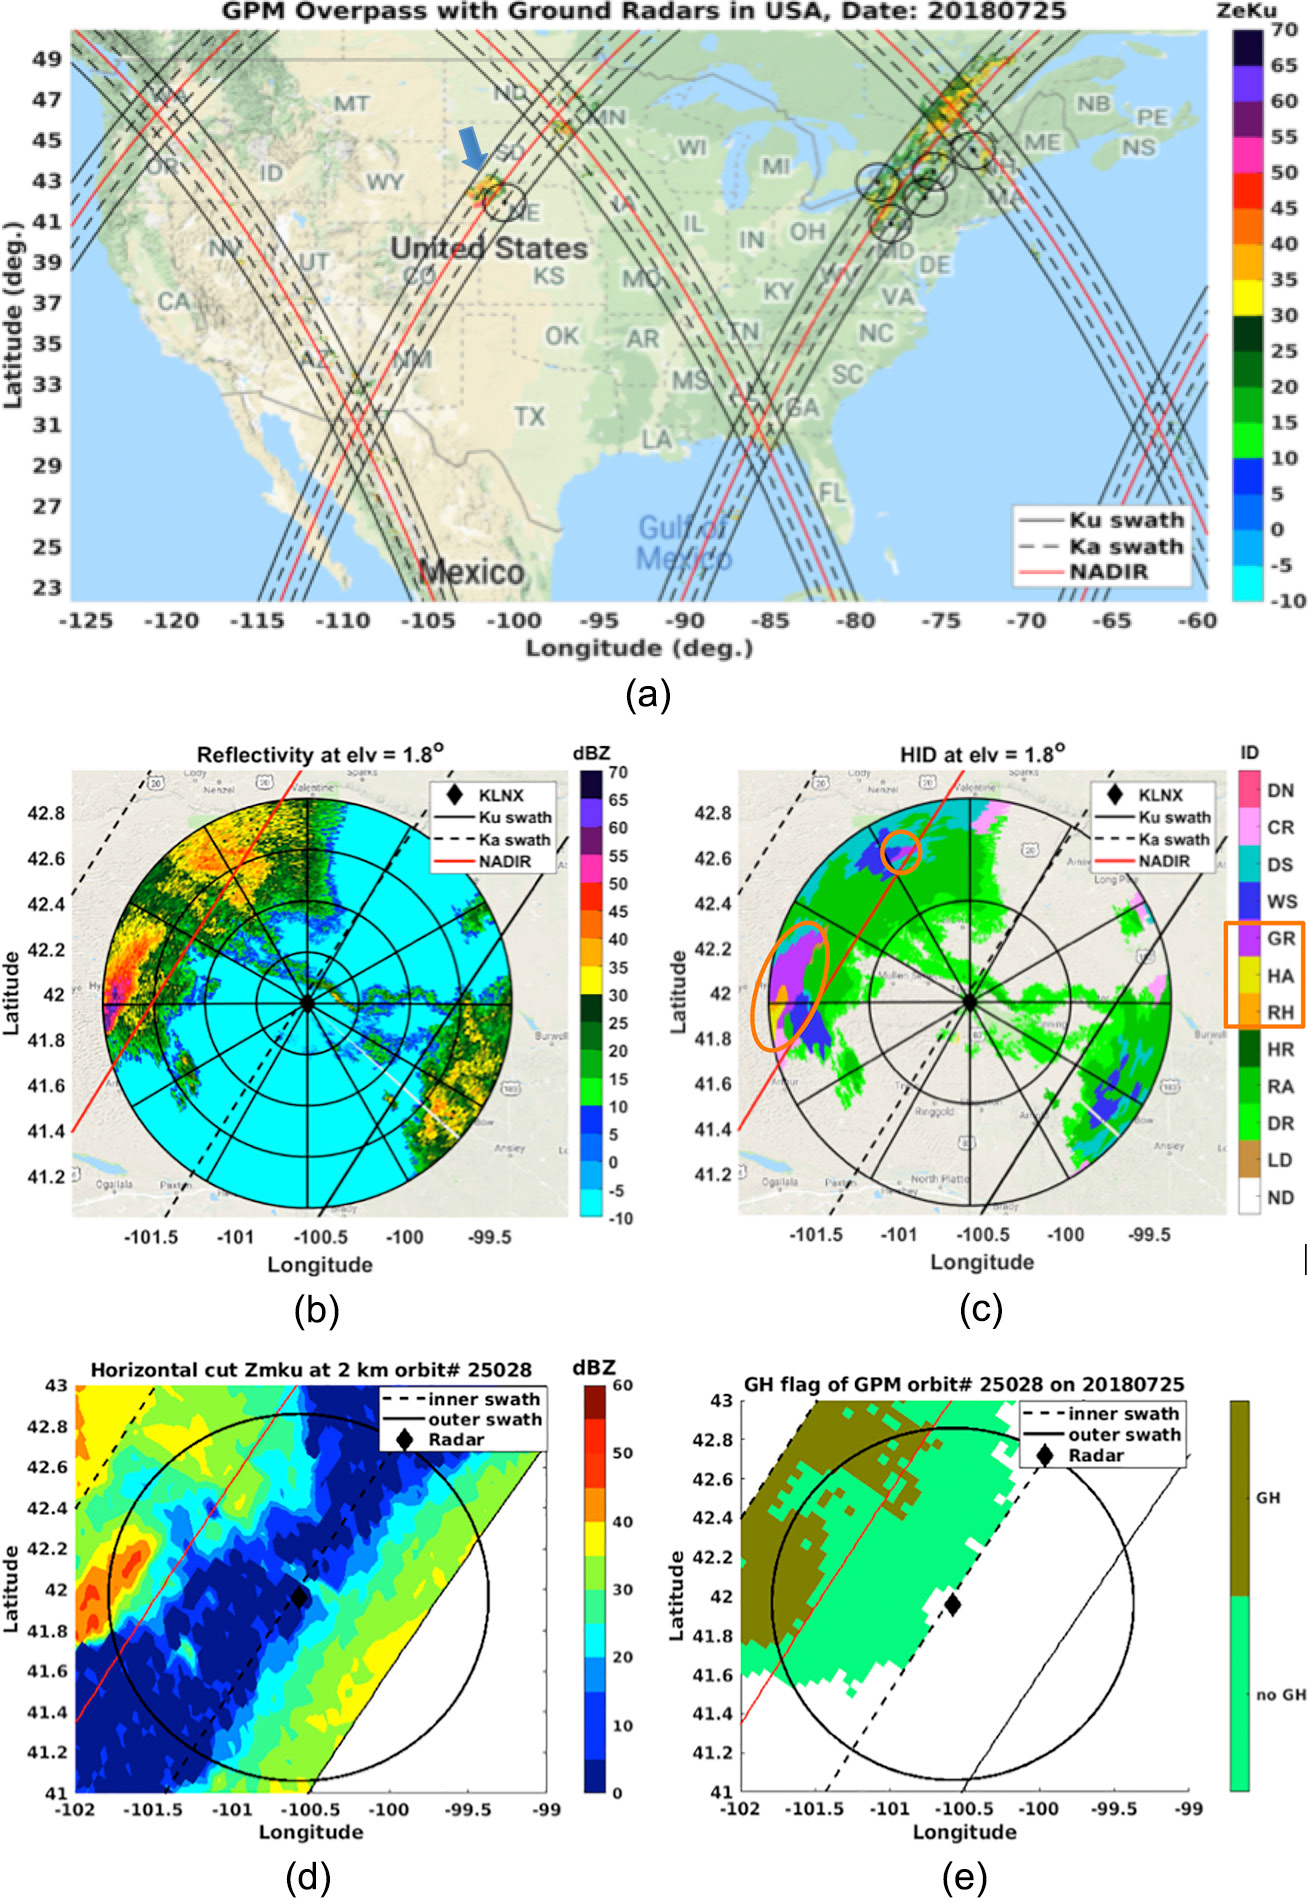
In Fig. 8a, another intense case is observed by GPM DPR orbit # 25028 near Platte, Nebraska at around UTC 11:25:49 with the nearby KLNX WSR-88D radar. Figure 8b is the reflectivity of the KLNX radar at an elevation of 1.8° at UTC 11:23:35. The hydrometeor identification of PPI in Fig. 8b is illustrated in Fig. 8c. “GR”, “HA”, and “RH” (shown as an orange color) in Fig. 8c represent graupel, hail, and rain with hail, respectively. To the west of the radar at a range of around 100 km, graupel, hail, and rain with hail are all identified. Figure 8d presents the DPR reflectivity of Zmku at a height of 2 km. Figure 8e is the result of flagGraupelHail, where dark green appears at corresponding locations, as in Fig. 8c.
Although sample cases are illustrated in this paper, point-to-point agreements can be found in most of the validation cases. This is a promising result considering the significant difference in geometry between space and ground radar systems. Further quantitative analysis of the validations forms part of the ongoing research.
4. Ground validation during the RELAMPAGO field campaign
The RELAMPAGO field program is a collaborative project funded by NSF, NOAA, NASA, Servicio Meteorologico Nacional; the Ministry of Education, Science and Technology of Argentina; the Province of Cordoba, Brazil (INPE, CNPq, and FAPESP), and INVAP, S.E. to observe convective storms that produce high-impact weather in the lee of the Andes Mountains in Argentina. The location of the campaign ranges from latitude −34.8° to −25.4° and from longitude −71.4° to −53.2°. RELAMPAGO provides unique observations of atmospheric and surface conditions in a region with substantial terrain and explores a regime of convection not comprehensively observed. The Extended Hydrometeorology Observing Period of the RELAMPAGO field campaign runs from June 1st 2018 to April 30th 2019. Data for this campaign were collected using both fixed and mobile instrumentation platforms, including aircraft, lightning instruments, weather balloons, and fixed/mobile Doppler/dualpolarization radars (from the W- to C-band). Meanwhile, overpasses from the GPM DPR captured a couple of precipitation events, which provide a good opportunity to perform a validation of the GH identification algorithm (refer to RELAMPAGO-CACTI for more information).
Figure 9a illustrates the map of South America, where the rectangle indicates the RELAMPAGO campaign area. A GPM overpass with orbit # 27991 flew over the region on January 31st, 2019 at around 22:35 UTC. A precipitation event was observed near Cordoba, Argentina. Figure 9b is an enlarged plot of Fig. 9a with the data showing the reflectivity of DPR Zmku at 4 km. The black circle is the range of the C-Band Scanning ARM Precipitation Radar (C-SAPR). The product of flagGraupelHail for this precipitation event is shown in Fig. 9c. The dark-green areas (where flagGraupelHail = 1) show up both north and south of Cordoba.

For the region north of Cordoba, the DPR scan ranges from 1,230 to 1,300. A three-dimensional (3-D) plot of DPR reflectivity at the Ku-band is presented in Fig. 10a. Around DPR angle bin # 40 is a clear melting region from scan # 1,250 to 1,270, while at around scan # 1,280, strong convection appears at angle bin # 20 ∼ 30 and also at around angle bin #15. These vertical profiles have peak reflectivity beyond 50 dBZ and the storm tops reach more than 10 km high. Figure 10b is the plot of flagGraupelHail. GH is identified by the corresponding red circles. The profiles marked by a, b, and c in Figs. 11a and 11b are illustrated in Fig. 10c to Fig. 10e. In each plot from Fig. 10c to Fig. 10e, the black, blue, and red lines are for Zmku, Zmka, and DFRm, respectively. For the profiles at Figs. 10c and 10d, the peaks at Zmka are over 20 dBZ above the 0° isotherm. The DFRm profile has a clear DFRm knee feature, where the peak values reach around 20 dB. These are clear indicators that hail exists in these two selected profiles and that multiple scattering effects are present (Battaglia et al. 2016). Figure 10e is a typical convective profile with high-density particles, such as graupel (Le and Chandrasekar 2013b). Large DFRm values suggest a large particle size and large attenuation difference. There is no multiple scattering effects. All three profiles have very high storm tops above 10 km, which is a key signature for precipitation containing GH.

For the region south of Cordoba, a 3-D reflectivity plot of DPR from scan # 1,170 to 1,210 is illustrated in Fig. 11a. The pink ovals encircle the two regions with strong convections. Figure 11b is the product of flagGraupelHail, which identifies GH at the corresponding areas. At locations a and b, two vertical profiles are selected and shown in Figs. 11c and 11d. Similar to the profiles illustrated in Fig. 10, the vertical profile in Fig. 11c is a hail-contaminated profile. The multiple scattering effects are very strong; however, there are no multiple scattering effects shown in the profile of Fig. 11d. With a significant difference in attenuation between the Ku- and Ka- bands of almost 20 dB and the features of the vertical profile of the DFRm (Le and Chandrasekar 2012b), it is a typical convective rain profile with high-density particles, such as graupel.

The C-SAPR ground validation radar is located on the edge of the DPR's overpass. C-SAPR is C-Band Scanning ARM Precipitation Radar. It is a dualpolarization Doppler weather radar that operates in a simultaneous transmit and receive mode. The C-SAPR measures the linear depolarization ratio, differential reflectivity, correlation coefficient, and specific differential phase. The dual-polarization variables enable the computation of rainfall rate estimates and the identification of precipitation types (ARM website https://www.arm.gov/capabilities/instruments/csapr). Figure 12a is an enlarged plot of GPM DPR reflectivity at 4 km for orbit # 27991 on January 31st, 2019 over the RELAMPAGO field campaign (close to the location of the C-SAPR). Three circles indicate the distance of 33.3, 66.6, and 100 km to the C-SAPR. Figure 12b is a PPI reflectivity plot of the C-SAPR at an elevation of 3.7°. Although the overlapped region is restricted to the left of the DPR's outer swath, the reflectivity pattern matches fairly well between Figs. 12a and 12b. The hydrometeor type for the C-SAPR is illustrated in Fig. 12c. Around 33.3 km west of the C-SAPR, the gray color in (c) indicates the existence of graupel. The product of flagGraupelHail in Fig. 12d is indicated by a dark-green color (flagGraupelHail = 1) at the same spot shown in Fig. 12c. In this case, the GH identification algorithm demonstrates excellent performance in the ground validation with the C-SAPR.

5. Global analysis
The GH identification algorithm discussed above was applied to single-year GPM DPR data and presents a global distribution map of GH occurrence on the basis of DPR observables (see Fig. 13a). The DPR data in 2018 were analyzed. For each qualified DPR vertical profile with precipitation, a Boolean value of flagGraupelHail was calculated. When flagGraupel- Hail = 1, the count keeps accumulating and is grouped according to the location of the measurement in each 2° × 2° latitude and longitude box. From the plot, peaks of GH occurrence are observed at e.g., equatorial Africa, the equatorial and subtropical Americas, the Pampas of Argentina, the Himalayan Forelands, and Indonesia. Most active lightning regions are believed to be associated with the existence of graupel at high altitudes (Deierling et al. 2008). Figure 13b illustrates a world lightning map generated by NASA's lightning group using data from the Lightning Imaging Sensor on board the TRMM satellite from 1995 to 2002. The places with the highest number of lightning strikes are deep red, grading to black. From (b), it is observed that 1) more lightning occurs over land than over the oceans, 2) more lightning occurs near the equator than at the poles, and 3) the yellow circles are the regions of intense lightning activity, which include areas such as The Democratic Republic of the Congo, most regions of South America (especially the northwestern area and the Pampas of Argentina), southeastern North America including central Florida, the Himalayan Forelands, and Indonesia. Comparing Figs. 13a and 13b, in general, good association can be found at the circled areas between these two maps, except for the Intertropical Convergence Zone (ITCZ) area in the western Pacific Ocean.
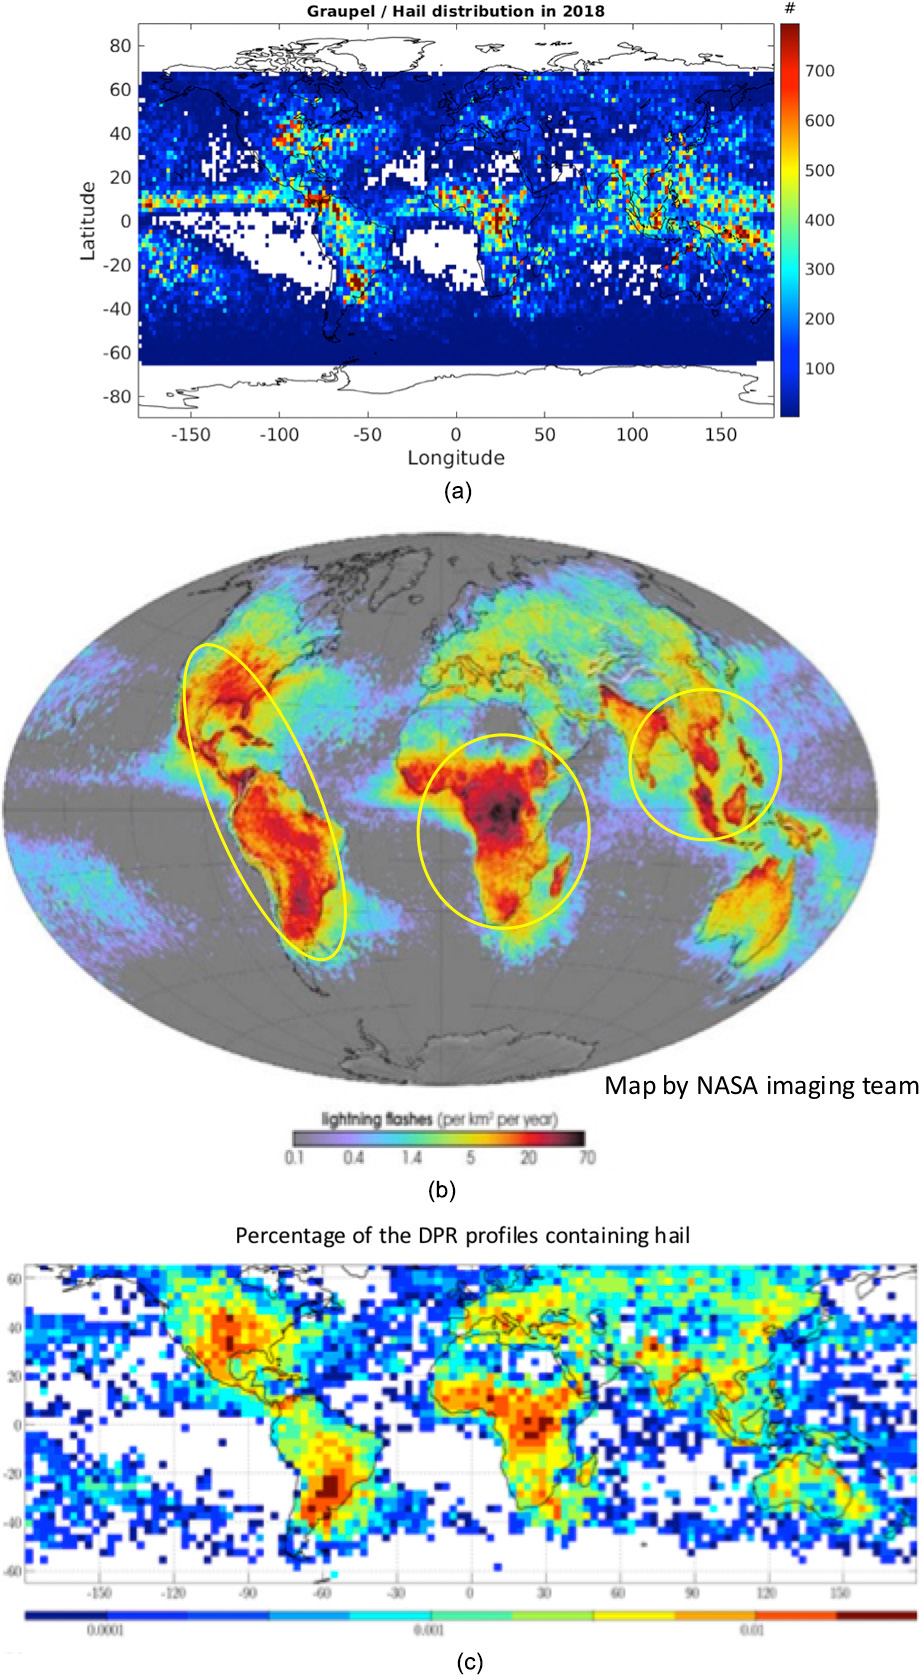
Figure 13c is a global map showing the fraction of the DPR profiles that contain hail based on a combined method of radar and GPM radiometer from 2014 to 2016 using a 3° × 3° latitude/longitude grid [reuse from Fig. 7 of Mroz et al. (2017)]. According to the map, most of the hail events occur over land and over regions adjacent to the land. The regions with local maxima are equatorial Africa, the subtropical Americas, Pakistan, and Bangladesh, which is similar to the findings in (a). In Mroz et al. (2017), it is mentioned that the region of severe weather in North America extends to around 48°N. In Fig. 13a, high counts of GH profiles at around 45° latitude in North America is observed. Despite that, some differences can also be observed, mainly in the southern part of Europe and in the ITCZ region. However, Fig. 13c is the global map for hail-contaminated profiles only.
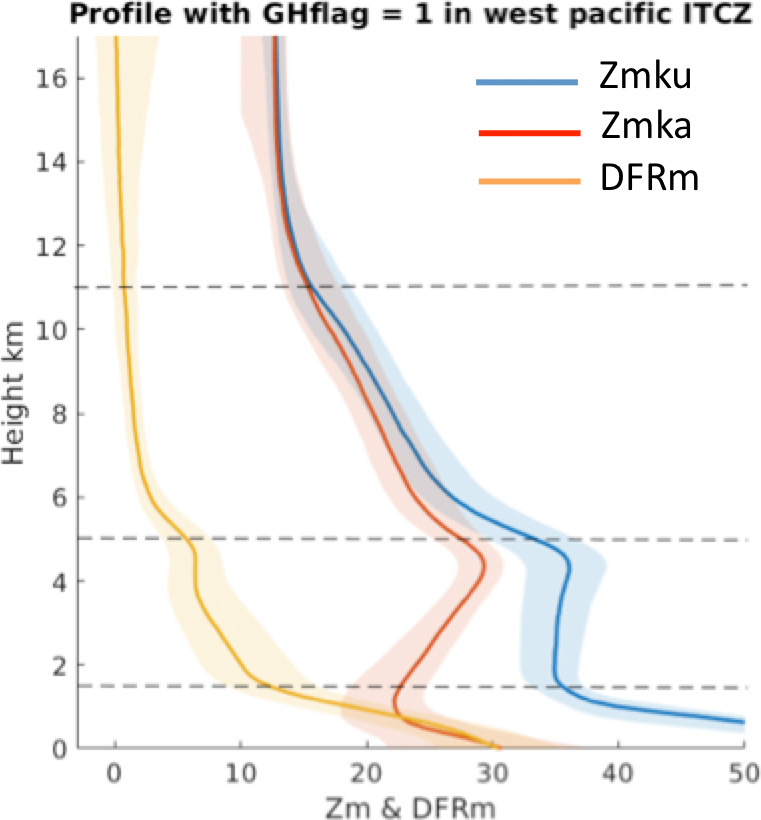
From Fig. 13, the most differences between the global maps are from the ITCZ area in the western Pacific Ocean region. The ITCZ is a belt of low pressure that circles the Earth generally near the equator, where the trade winds of the Northern and Southern Hemispheres meet. It is characterized by convective activity, which often generates vigorous thunderstorms over large areas. Since the region is over ocean, ground validation resources are limited. Figure 14 shows the median profiles of the DPR observables of the Ku- and Ka-bands and the DFRm within the western Pacific ITCZ region, where flagGraupelHail = 1. The data was taken from June of 2018. The semitransparent envelope marks the region between the 25th and 75th percentiles. The three horizontal dashed lines from the top to the bottom are the median heights (in km) of the storm top, the 0°C isotherm and the clutter-free height. From the figure, the Zmka peak value above the 0° isotherm height is above 20 dBZ, and the DFRm peak value is around 7 dB. These signatures indicate heavy precipitation particles, such as GH, along the vertical profile (Iguchi et al. 2018). It is known that lightning is caused by the downward flux of aloft high-density particles when they reach a certain density in a short time period (Deierling et al. 2008). The absence of lightning in the ITCZ region might be caused by not having enough graupel particles aloft. However, this does not imply an absence of graupel.
6. Summary and conclusions
This paper describes the new GH identification algorithm for the GPM DPR. The algorithm outputs a Boolean product named flagGraupelHail for each Ku- and Ka-band matched footprint. This product is currently stored in the Experimental Module in the DPR level-2 algorithm V6X. This algorithm is based on the PTI, which is also used in the surface snowfall identification algorithm for GPM DPR. Ground validation activities were performed with the WSR-88D radar network between May to September 2018. Thirteen intense weather events were chosen from the continental United States. Besides the excellent agreement illustrated in the sample cases, point-to-point agreements can be found in most of the validation cases. This is a promising result, considering the great difference in geometry between space and ground radar systems. More quantitative analysis for the validations is included in ongoing research.
Validation activities were expanded to South America during the RELAMPAGO field campaign, a regime of convection not comprehensively observed. The results from the GH identification algorithm were validated with the C-SAPR C-band dual-polarization radar deployed in the campaign region and illustrate good agreement.
Whole-year GPM DPR data from 2018 were analyzed and a map was generated, illustrating a global distribution of GH occurrence. The map shows consistency with the findings from the world lightning map and the map of hail occurrence using both active and passive devices from GPM. Close attention was paid to the differences in the ITCZ region. Preliminary results show there is evidence that graupel or hail can occur in the ITCZ area, even when there is not much lightning. . Currently, GH cannot be separated, but a new algorithm aiming to separate them is under development.
Acknowledgments
This research is supported by the NASA GPM/Precipitation Measurement Mission program and the National Science Foundation through the RELAMPAGO project. The authors acknowledge the Department of Energy (DOE), the Atmospheric Radiation Measurement (ARM) program for providing the C-SAPR radar observations.
References
- Battaglia, A., K. Mroz, S. Tanelli, F. Tridon, and P.-E. Kirstetter, 2016: Multiple-scattering-induced “ghost echoes” in GPM DPR Observations of a tornadic supercell. J. Appl. Meteor. Climatol., 55, 1653-1666.
- Bechini, R., and V. Chandrasekar, 2015: A semisupervised robust hydrometeor classification method for dual-polarization radar applications. J. Atmos. Oceanic Technol., 32, 22-47.
- Cecil, D. J., 2009: Passive microwave brightness temperatures as proxies for hailstorms. J. Appl. Meteor. Climatol., 48, 1281-1286.
- Deierling, W., W. A. Petersen, J. Latham, S. Ellis, and H. J. Christian, 2008: The relationship between lightning activity and ice fluxes in thunderstorms. J. Geophys. Res., 113, D15210, doi:10.1029/2007JD009700.
- Depue, T. K., P. C. Kennedy, and S. A. Rutledge, 2007: Performance of the hail differential reflectivity (HDR) polarimetric radar hail indicator. J. Appl. Meteor. Climatol., 46, 1290-1301.
- Hou, A. Y., R. K. Kakar, S. Neeck, A. A. Azarbarzin, C. D. Kummerow, M. Kojima, R. Oki, K. Nakamura, and T. Iguchi, 2014: The Global Precipitation Measurement mission. Bull. Amer. Meteor. Soc., 95, 701-722.
- Houze, R. A., Jr., 1997: Stratiform precipitation in regions of convection: a meteorological paradox? Bull. Amer. Meteor. Soc., 78, 2179-2196.
- Iguchi, T., N. Kawamoto, and R. Oki, 2018: Detection of intense ice precipitation with GPM/DPR. J. Atmos. Oceanic Technol., 35, 491-502.
- Le, M., and V. Chandrasekar, 2012a: Precipitation type classification method for dual-frequency precipitation radar (DPR) onboard the GPM. IEEE Trans. Geosci. Remote Sens., 51, 1784-1790.
- Le, M., and V. Chandrasekar, 2012b: Hydrometeor profile characterization method for dual-frequency precipitation radar onboard the GPM. IEEE Trans. Geosci. Remote Sens., 51, 3648-3658.
- Le, M., and V. Chandrasekar, 2019: Ground validation of surface snowfall algorithm in GPM dual-frequency precipitation radar. J. Atmos. Oceanic Technol., 36, 607-619.
- Le, M., V. Chandrasekar, and S. Biswas, 2017: An algorithm to identify surface snowfall from GPM DPR observations. IEEE Trans. Geosci. Remote Sens., 55, 4059-4071.
- Mazzoglio, P., F. Laio, S. Balbo, P. Boccardo, and F. Disabato, 2019: Improving an extreme rainfall detection system with GPM IMERG data. Remote Sens., 11, 677, doi:10.3390/rs11060677.
- Mroz, K., A. Battaglia, T. J. Lang, D. J. Cecil, S. Tanelli, and F. Tridon, 2017: Hail-detection algorithm for the GPM Core Observatory satellite sensors. J. Appl. Meteor. Climatol., 56, 1939-1957.
- Prakash, S., A. K. Mitra, D. S. Pai, and A. AghaKouchak, 2016: From TRMM to GPM: How well can heavy rainfall be detected from space? Adv. Water Resour., 88, 1-7.
- Skofronick-Jackson, G., W. A. Petersen, W. Berg, C. Kidd, E. F. Stocker, D. B. Kirschbaum, R. Kakar, S. A. Braun, G. J. Huffman, T. Iguchi, P. E. Kirstetter, C. Kummerow, R. Meneghini, R. Oki, W. S. Olson, Y. N. Takayabu, K. Furukawa, and T. Wilheit, 2017: The Global Precipitation Measurement (GPM) mission for science and society. Bull. Amer. Meteor. Soc., 98, 1679-1695.
- Wang, J., R. A. Houze, Jr., J. Fan, S. R. Brodzik, Z. Feng, and J. C. Hardin, 2019: The detection of mesoscale convective systems by the GPM Ku-band spaceborne radar. J. Meteor. Soc. Japan, 97, 1059-1073.
- Yamaji, M., H. G. Takahashi, T. Kubota, R. Oki, A. Hamada, and Y. N. Takayabu, 2020: 4-year climatology of global drop size distribution and its seasonal variability observed by spaceborne dual-frequency precipitation radar. J. Meteor. Soc. Japan, 98, 755-773.