Abstract
This article describes humidity data correction based on an intercomparison between two manufacturers' radiosondes with the assessment using precipitable water vapor (PWV) derived from Global Navigation Satellite System (GNSS) signals. In addition, we propose a method to determine whether the same correction procedure can be applied if such intercomparison cannot be conducted.
During the intensive observation called Years of the Maritime Continent (YMC) - Boreal Summer Monsoon (BSM) study in 2018 (YMC-BSM 2018), intercomparison of radiosonde between Lockheed Martin LMS6 and Vaisala RS41-SGP was conducted at Laoag, Ilocos Norte, Philippines from late July to early August 2018. While their mean difference of relative humidity (RH) was better than 5 %, dry bias was confirmed for LMS6 only during clear sky daytime soundings based on comparing PWV with that derived from GNSS signals. To use different radiosonde data with the same research-quality, we developed a correction table for LMS6 RH data.
While a direct intercomparison between different radiosondes and independently developed observational tools such as a GNSS-receiver is ideal to evaluate data quality, it cannot always be performed. We obtained LMS6 radiosonde data at different site at Yap Island, Federated States of Micronesia from another field campaign, YMC-BSM 2020, where any intercomparison could not be conducted. To decide whether the same correction procedure obtained from YMC-BSM 2018 can be applied to those data, we assessed their similarity based on the relationship between specific humidity from surface meteorological station data that were obtained independently before launch and radiosonde specific humidity averaged over 300 m from the initial radiosonde measurement point. This method allowed us to confirm the same behavior between Laoag data in 2018 and Yap data in 2020; thus, we applied our correction method to RH data in YMC-BSM 2020.
1. Introduction
Radiosonde is a basic observation tool to measure atmospheric vertical profiles and is often used in field campaigns, since it can capture the characteristics of the atmospheric structure at high vertical resolution (raw data are taken at every 4–6 m interval). Besides, additional radiosonde soundings considerably improve analysis fields (Moteki et al. 2011) and forecast skill (Inoue et al. 2015) using data assimilation. The international field program, Years of the Maritime Continent (YMC), has been carried out since 2017 (Yoneyama and Zhang 2020). YMC is a unique attempt to understand the weather and climate systems over the Maritime Continent through two field observational approaches; intensive observation focusing on specific phenomena with a limited observation period, and long-term measurement done by local meteorological agencies and special observation tool deployment including the mooring system and unmanned autonomous vehicles. In most cases, radiosonde is used. Accurate moisture distribution and variation obtained from radiosonde are crucial to understand dominant atmospheric convective variabilities such as the diurnal cycle of rain, the Madden–Julian oscillation, and the boreal summer intraseasonal oscillation (BSISO) over the Maritime Continent and adjacent seas, where the atmospheric convection is the most active area over the world (Neelin and Held 1987; Sobel et al. 2001; Yamanaka 2016; Yoneyama and Zhang 2020). While the radiosonde data are accurate as an in situ measurement system, it is often reported that their relative humidity (RH) data contain erroneous data mainly caused by the solar heating of humidity sensors from a research-quality viewpoint (e.g., Vömel et al. 2007a; Yoneyama et al. 2008). Furthermore, their accuracy varies with radiosonde manufacturers (Ciesielski et al. 2010; Nash et al. 2011).
Figure 1 shows a map of radiosonde types used during two field campaigns in 2018 and 2020. During the campaigns, the Vaisala RS41 and Lockheed Martin LMS6 radiosondes were used. When we analyze those data, any scientific knowledge obtained using those data should be the same, regardless of radiosonde type (LMS6 or RS41). Thus, we must reduce possible errors as much as possible. Ciesielski et al. (2012) provided a guideline of general procedures for producing research-quality radiosonde sounding data from field campaigns. They proposed adopting a naming convention for those procedures from level-1 to level-4, in addition to the original (raw) datasets as level-0. Level-1 denotes data in a common format, regardless of their original data types and systems. Data processed using automated quality control algorithms that remove obvious errors are labeled as level-2. The level-3 procedure identifies and reduces systematic errors or biases in high (original) vertical resolution data. Level-4 datasets can be obtained from level-3 datasets by producing data at a uniform vertical resolution (5 hPa) with quality control information flags. In these procedures, they emphasized the importance and difficulty of humidity data bias identification and reduction. Since many researchers who did not conduct observations themselves take radiosonde data as part of the YMC, researchers who conducted field experiments should evaluate data quality. Thus, this report is about the quality control of data from those who conducted field campaigns in 2018 and 2020.
In this study, we first show the data quality evaluation results based on the intercomparison done during the field campaign at Laoag, Ilocos Norte, Philippines, in July-August 2018 in Section 2. We apply the same correction procedure developed from the 2018 campaign onto field campaign data taken in 2020 at a different site (Yap, Federated States of Micronesia) on the basis of possible bias identification (Section 3). This procedure contains a suggestion of humidity data correction for the case that direct intercomparison cannot be performed during the campaign. A summary and remarks for data quality procedures are provided in Section 4.
2. Intercomparison during the YMC-BSM 2018
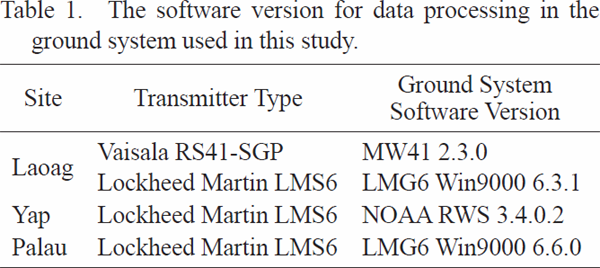
A field experiment to study the boreal summer monsoon (BSM) was conducted as YMC-Boreal Summer Monsoon study in 2018 (YMC-BSM 2018) at various sites in the tropical western Pacific region, where unique local phenomena are frequently observed. The campaign details are found on their website (https://www.jamstec.go.jp/ymc/campaigns/IOP_YMC-BSM_2018.html). One key research topic is to study a mechanism of offshore propagation of diurnally developed atmospheric convection along the coast and its relation to the large-scale atmospheric disturbances known as the northward propagating BSISO. Therefore, four radiosonde soundings were performed daily at Laoag (18.18°N, 120.53°E), Province of Ilocos Norte, Philippines, from July 1 to August 31, 2018. While the Lockheed Martin LMS6 and Graw DFM-09 radiosondes are usually used at the Laoag synop airport upper air station, only LMS6 was used during two months of the YMC-BSM 2018 period to avoid inconsistency of radiosonde data. Furthermore, intercomparison among different types of radiosonde was conducted to evaluate their relative differences to use such information when we use the same type of radiosonde data taken at different sites. As shown in the next section and Fig. 1, we also used LMS6 radiosonde data taken at Yap (9.50°N, 138.08°E), Palau (7.37°N, 134.54°E), Vaisala RS41-SGP (RS41) onboard the research vessel (R/V) Mirai (12.00°N, 135.00°E), and Legazpi (13.15°N, 123.73°E), Province of Albay, Philippines, during the YMC-BSM 2020 campaign. In this study, we focus on evaluating LMS6 radiosonde humidity data, which are used for both campaigns. Since the processing software of LMS6 is different for various sites and it might affect the results, their software version information is provided in Table 1. As shown, while the LMS6 transmitter is used at Yap, they use the U.S. National Oceanic and Atmospheric Administration's (NOAA's) original software “Radiosonde Replacement System (RRS) Workstation Software (RWS)” (National Oceanic and Atmospheric Administration 2018). Furthermore, we used relatively new sensors (within a year from their production) to avoid possible errors from sensor aging.

To evaluate LMS6 radiosonde humidity data, intercomparison between LMS6 and RS41 was performed by launching both radiosondes 20 times simultaneously from July 27 to August 3, 2018 (Table 2). Note that while we attached them 1 m apart using a plastic rod and launched using a single balloon at 03:00 UTC and 09:00 UTC, we launched them simultaneously but separately using two balloons at 00:00 UTC and 06:00 UTC. This is because we kept the same launching procedure for six-hourly sounding using LMS6 during the entire two-month YMC-BSM 2018 campaign period. Unfortunately, two soundings had failed to obtain data correctly for intercomparison, thus 18 sounding data (13 in daytime, 5 in evening) were used. Furthermore, during this period, a Global Navigation Satellite System (GNSS) receiver was installed at the Laoag weather station to measure precipitable water vapor (PWV; Rocken et al. 1993). The procedure to derive PWV from GNSS signals is the same as that shown in Fujita et al. (2008, 2020), who reported the mean difference using radiosonde-derived PWV is better than 1 mm with a root mean square error of 2–3 mm.

The result of intercomparison between LMS6 and RS41 is shown in Fig. 2. Note that the intercomparison was performed under clear sky conditions (Table 2). Here, we use the term “clear sky” not as cloud amount “0” but as within fewer clouds ranging 1–3, except one case of 4 at sounding number 15 in Table 2. RH profiles of LMS6 show dry bias compared to that of RS41 for the entire troposphere during daytime sounding (Fig. 2a), whereas such a difference cannot be found in the evening soundings (Fig. 2b). The mean difference between the two radiosondes in the 1000–200 hPa layer is 3.9 %, and the difference increases with height in the upper troposphere above the 200 hPa level. We cannot conclude that LMS6 has dry bias only from this figure, as RS41 might have a wet bias. Note that if we assume that RS41 data is correct (no wet nor dry bias), the difference of 3.9 % is ranged within the LMS6 specified accuracy (±5 %), indicating that such a difference is acceptable from the operational-use viewpoint.

Having said that, the same quality among different types of radiosonde is desirable especially when researchers use them to calculate a moisture flux in a certain domain or discuss humidity variation using different radiosonde data. As one index that can be obtained independently from the radiosonde measurement, a comparison of PWV derived from two sources (radiosonde and GNSS), is useful. Previous studies demonstrated the usefulness of GNSS-derived PWV for assessing radiosonde humidity data validation (Wang and Zhang 2008; Wang et al. 2013). Figure 3 shows PWV differences between GNSS-PWV and Radiosonde-PWV for LMS6 (Fig. 3a) and RS41 (Fig. 3b), respectively. The difference between GNSS and RS41-derived PWV is smaller than 1 mm regardless of the time of the day (the mean difference at 14:00 LT is −0.92 mm with a standard deviation of 1.1 mm), whereas LMS6 shows large dry bias in the daytime (the difference at 14:00 LT is −3.8 mm with a standard deviation of 1.2 mm). The difference found in RS41 and GNSS is comparable to previous studies (Realini et al. 2014) that compared GNSS-PWV with Vaisala RS92-derived PWV. Note that several studies confirm data consistency between RS92 and RS41 (Jensen et al. 2016; Kawai et al. 2017). Therefore, we decided that RS41 humidity data are more reliable than that obtained by LMS6, and we will use RS41 as a reference for RH data correction of LMS6.

Here, before describing the correction procedure, we discuss the causes of the biases briefly. The clear contrast between daytime and evening indicates that the differences between the two radiosonde types in the daytime soundings are caused by daytime solar radiation (Vömel et al. 2007a), although LMS6 has a sunshade to prevent solar radiation as much as possible. Since the difference can be found from the ground surface, one argument is that exposure under the sunshine about five minutes or more before the launch might result in some portions of this dryness. Another argument is that sunshade could not fully prevent solar radiation during ascent at a slight inclination rather than upright. Larger differences above 200 hPa might reflect that all radiosondes launched during the intercomparison period encountered strong winds over 10 m s−1 (not shown), which might result in the sunshade being unable to prevent the solar radiation due to inclination. Several other possible reasons exist to explain the difference. For example, we cannot exclude a possible error source by the slow sensor response at low temperatures, known as a time-lag error (Miloshevich et al. 2004). However, it is impossible to quantify the biases due to the time-lag error, as we do not have information about the sensor time constant, which is determined by the manufacturer based on dedicated measurements in a laboratory environment. Instead, we can minimize the gap between RS41 and LMS6 in producing seamless humidity datasets because the differences exist only in clear sky daytime soundings.
As for correction schemes, several methods have been proposed and used for previous field campaigns (e.g., Nuret et al. 2008; Ciesielski et al. 2014). If we can obtain the simultaneous sounding data using chilled-mirror hygrometers such as Snow White (Fujiwara et al. 2003) or the cryogenic frost-point hygrometer (Vömel et al. 2007b), with enough sample numbers, polynomial fitting with those data profiles might be better. However, we did not launch such hygrometers during the 2018 campaign. Thus, by assuming that the RH of RS41 is better than that of LMS6 during the 2018 campaign, as mentioned above, we fitted LMS6 RH data to that of RS41 using the cumulative distribution function (CDF) matching method, which produces a look-up table for humidity bias correction (Nuret et al. 2008; Ciesielski et al. 2009). Since we could not find a significant difference between 11:00 LT and 14:00 LT sounding cases, we simply calculated CDF matching using all 13 samples for daytime sounding. RH bias as a function of RH and temperature is shown in Fig. 4. Then, bias correction is performed on the RHs and its result is shown in Fig. 5, demonstrating that the humidity correction performed well for the entire troposphere. Figure 6, which shows the frequency distribution of RH occurrence for original/corrected values, provides the same information as Fig. 5 but also shows how this correction works. The peak of frequency in the higher RH range at 65–75 % in the original LMS6 data shifts to 75–85 % in the corrected one, whereas another peak around 20–30 % in the original LMS6 disappears in the corrected distribution. The former might capture moist conditions in the lower troposphere over the warm pool, whereas the latter corrected dry bias in the upper troposphere mainly above 200 hPa (Fig. 2a).

3. Application of correction scheme to another field campaign data
Although we obtained the quality-controlled LMS6 humidity data during the YMC-BSM 2018 campaign period, it does not guarantee that such correction is valid for other LMS6 data because the system has been improved by the manufacturer's effort and minor changes to the system is often done without notifying users.
In the boreal summer in 2020 (August to early September), another YMC field campaign, YMC-BSM 2020 was conducted. During this campaign period, a radiosonde network was formed by three land-based sites and the R/V Mirai (indicated in blue in Fig. 1). While RS41 was used at Legazpi and onboard the R/V Mirai, LMS6 was used at two sites, Yap, Federated States of Micronesia, and Palau. At these land-based sites, the twice-daily operational radiosonde soundings were increased to four times per day at a six-hour interval during the campaign period. For LMS6 data at these sites, is it possible to use their data without any correction or can the same correction procedure obtained from the YMC-BSM 2018 Laoag site be adopted, as shown in the previous section? We obtained only original high-resolution (every 1 s) radiosonde data from those sites, and we did not conduct any intercomparison there.
One idea to answer the above is using surface meteorology data taken independently using their surface weather station as initial ground surface data prior to launch. The specific humidity at the surface measured by the weather station and in a well-mixed boundary layer measured by the radiosonde should be close to each other. For example, Fitzjarrald and Garstang (1981) suggested the difference is between 1.0–1.5 g kg−1 from a tropical Atlantic Ocean experiment. However, since the LMS6 data obtained at Laoag during the YMC-BSM 2018 showed dry bias even in the boundary layer (Fig. 2a), their difference might be larger. Figure 7 shows a scatter plot of the specific humidity measured at the surface (Q_SFC) and that averaged over 300 m from the radiosonde initial data point (Q_BL). The mean difference between Q_SFC and the original Q_BL for daytime sounding (2.31 g kg−1) is higher than that in the evening sounding (0.88 g kg−1), and the contrast (1.43 g kg−1) is comparable to the LMS6's dry bias of ∼ 5 % for RS41 in the lower troposphere. The RH correction for daytime soundings improves the mean difference between Q_SFC and Q_BL to 1.14 g kg−1, which is close to that for evening soundings.

We also calculated the same scatter plot for all data obtained during the YMC-BSM 2018 period (Fig. 8). Here, it should be noted that although a similar comparison between the surface and boundary layers was used to detect dry bias and correction was applied to all data for the Tropical Ocean Global Atmosphere Coupled Ocean–Atmosphere Response Experiment (TOGA COARE) field experiment (Zipser and Johnson 1998; Lucas and Zipser 2000), it is different from our case. For TOGA COARE data, solar radiation-induced error is one error source, but the chemical contamination between the humidity sensor and radiosonde package material mainly caused dry bias for Vaisala RS80 radiosonde data (Wang et al. 2002). Such dry bias appeared in all sounding data. On the other hand, the dry bias studied here is mainly caused by daytime solar radiation. Thus, a correction scheme developed here can be applied only to daytime data. Furthermore, when the daytime data are obtained under heavy clouds or rainy days, it might not have to be corrected. As noted in Table 2, the intercomparison was conducted only under clear sky conditions. In other words, we should not apply the correction scheme obtained from the intercomparison at YMC-BSM 2018 to the data obtained on cloudy/rainy days. In this study, we identified cloudy/rainy days using a threshold of 93 % RH, following Zuidema (1998). When the data show RH higher than 93 % and have enough thickness (thicker than 30 hPa) between 800 hPa and 300 hPa, we identified that the sounding site is covered with clouds. Its threshold thickness (30 hPa) was determined based on several trials to detect the most similar value with that of the non-daytime period. Note that, however, their difference is not changed much from those layer-thickness selections, because it is often covered with thick layers due to rain when several points show values higher than 93 % RH (not shown). We confirmed that all daytime soundings shown in Table 2 were not categorized in the cloudy/rainy conditions defined using the RH threshold. Also, note that the range starting from 800 hPa was chosen to surely avoid the top of the boundary mixed layer, where high RH often appears, and cloudy layers from spotted/scattered shallow clouds. Thus, in Fig. 8, we plotted the specific humidity at the surface and 300 m-layer mean before/after correction for three cases: clear sky daytime, cloudy/rainy daytime, and others (evening-night). Those are indicated in different colors and shapes. Only data taken during clear sky daytime were corrected (indicated in red and magenta). We confirmed that the mean difference between Q_SFC and Q_BL during cloudy/rainy daytime (1.30 g kg−1) is significantly lower than that of clear sky daytime (2.20 g kg−1) and rather close to that of the others (1.23 g kg−1).

A similar plot was calculated for the data obtained at Yap from August 6 to September 9, 2020 (Fig. 9). We can confirm a similar difference and relationship for Yap LMS6 data. The mean difference between Q_ SFC and Q_BL for clear sky daytime soundings (2.49 g kg−1), which is close to that for the Laoag BSM2018 case (2.20 g kg−1), is significantly higher than that for cloudy/rainy daytime soundings (1.32 g kg−1), which is also close to that for the Laoag case (1.30 g kg−1). Therefore, it is possible to recognize that LMS6 used at Yap might have a dry bias similar to that in YMC-BSM 2018 and the same correction procedure can be applied, despite using different data processing software (Table 1). According to the data policy of the YMC, we must provide quality-controlled data to the public within one year from completing of the field campaign. Thus, when we release the YMC-BSM 2020 radiosonde data, they will be labeled as levels-3 and 4 (Ciesielski et al. 2012) with a notation of such humidity correction based on YMC-BSM 2018 intercomparison results.

4. Summary and concluding remarks
This article reported the evaluation of LMS6 and RS41 radiosonde humidity data obtained during the YMC-BSM 2018 campaign at Laoag, Ilocos Norte, Philippines, based on the intercomparison of simultaneous radiosonde observation and comparison of PWV derived from radiosonde and GNSS signals. LMS6 showed a dry bias of ∼ 4 %RH compared to RS41 in the entire troposphere with a higher difference above 200 hPa. Such differences were confirmed only during the clear sky daytime soundings and recognized to be caused by humidity sensor heating due to solar radiation. Since the comparison of PWV derived from radiosondes and GNSS showed that RS41-derived PWV was closer to GNSS-derived PWV, we corrected LMS6 bias using RS41 data. The CDF-matching method was applied to deduce the correction values of LMS6 RH data against RS41 as a function of the observed RH and temperature.
In addition to the YMC-BSM 2018 data, we obtained LMS6 data from another field campaign YMC-BSM 2020. In this study, we showed the case of data taken at Yap, Federated States of Micronesia during August–September 2020. Note that although we
obtained LMS6 data from Palau, currently we have not obtained their surface meteorological data taken independently. Thus, we focused only on Yap data in this study. However, as noted in Table 1, since Palau adopts a similar system to Laoag, this study can be applied to Palau.
Since we do not have any intercomparison between LMS6 and RS41 data during the YMC-BSM 2020 campaign period, we proposed using the relationship between the surface specific humidity data and mean specific humidity data averaged over 300 m in the boundary layer as a possible index to judge whether the correction scheme developed for YMC-BSM 2018 can be used for the 2020 case or not, since the surface value is obtained independently from the radiosonde at most stations. The mean difference is the same order for both campaigns and we confirmed that the mean difference between Q_SFC and Q_BL for clear sky daytime soundings was significantly higher than that for cloudy/rainy daytime soundings, as the Laoag case showed. Based on this qualitative similarity, we applied the same correction scheme to Yap LMS6 sounding data. Therefore, the same procedure can be applied to other sites, once the correction values for the same type of radiosonde have been determined, where intercomparison or any other evaluation method has not been established. Besides, we used RH values to detect cloudy/rainy conditions during the sounding, so that the humidity correction associated with solar radiation in the daytime can be applied only to affected data under clear sky days (judged as cloudy/rainy, if 93 % or higher RH appears over 30 hPa thickness between 800 hPa and 300 hPa).
The datasets used in this study are available from the YMC data archive site at https://www.jamstec.go.jp/ymc/ymc_data.html, and a look-up table for LMS6 is available on the same site and Supplements in this article. Note that this look-up table for LMS6 can be used only for the data taken during clear sky daytime.
Currently, the authors have also been developing a correction scheme for other radiosonde types, such as Graw obtained at Laoag. Those efforts should be made in collaboration with local meteorological agencies, so that not only field campaign data but also operational routine data can be used for weather and climate studies with high research-quality.
Supplements
Table S1: Look-up table for LMS6 relative humidity (RH in %) correction. Correction values (dRH) are stored in 1 % and 1°C bins as a function of RH from 0 % (left) to 100 % (right) and temperature from +30°C (top) to −90°C (bottom). Corrected RH (RH_cor) is obtained using original RH (RH_raw) and dRH as RH_cor = RH_raw + dRH.
Acknowledgments
The authors would like to express our sincere thanks to all staff of Laoag synop airport upper air station for their radiosonde sounding operation for the YMC-BSM 2018 campaign, and Dr. Vicente B. Malano, Dr. Landrico U. Dalida, Jr., and Dr. Flaviana D. Hilario at the Headquarters of PAGSA for their support and allowance of this collaborative observation. Many students from the University of the Philippines, Diliman, also helped with the work at Laoag. We also thank Mr. Souichiro Sueyoshi, a technical staff from Nippon Marine Enterprise Co. Ltd., for his support of the intercomparison experiment at Laoag. We appreciate the U.S. National Oceanic and Atmospheric Administration, Yap Weather Services, and Palau Weather Services for their enhanced radiosonde observations during the YMC-BSM 2020. The constructive comments from two anonymous reviewers and Prof. M. D. Yamanaka that helped improve the manuscript are greatly appreciated.
References
- Ciesielski, P. E., R. H. Johnson, and J. Wang, 2009: Correction of humidity biases in Vaisala RS80-H sondes during NAME. J. Atmos. Oceanic Technol., 26, 1763-1780.
- Ciesielski, P. E., W.-M. Chang, S.-C. Huang, R. H. Johnson, B. J.-D. Jou, W.-C. Lee, P.-H. Lin, C.-H. Liu, and J. Wang, 2010: Quality-controlled upper-air sounding dataset for TiMREX/SoWMEX: Development and corrections. J. Atmos. Oceanic Technol., 27, 1802-1821.
- Ciesielski, P. E., P. T. Haertel, R. H. Johnson, J. Wang, and S. M. Loehrer, 2012: Developing high-quality field program sounding datasets. Bull. Amer. Meteor. Soc., 93, 325-336.
- Ciesielski, P. E., H. Yu, R. H. Johnson, K. Yoneyama, M. Katsumata, C. N. Long, J. Wang, S. M. Loehrer, K. Young, S. F. Williams, W. Brown, J. Braun, and T. Van Hove, 2014: Quality-controlled upper-air sounding dataset for DYNAMO/CINDY/AMIE: Development and corrections. J. Atmos. Oceanic Technol., 31, 741-764.
- Fitzjarrald, D. R., and M. Garstang, 1981: Vertical structure of the tropical boundary layer. Mon. Wea. Rev., 109, 1512-1526.
- Fujita, M., F. Kimura, K. Yoneyama, and M. Yoshizaki, 2008: Verification of precipitable water vapor estimated from shipborne GPS measurements. Geophys. Res. Lett., 35, L13803, doi:10.1029/2008GL033764.
- Fujita, M., T. Fukuda, I. Ueki, Q. Moteki, T. Ushiyama, and K. Yoneyama, 2020: Experimental observations of precipitable water vapor over the open ocean collected by autonomous surface vehicles for real-time monitoring applications. SOLA, 16A, 19-24.
- Inoue, J., A. Yamazaki, J. Ono, K. Dethloff, M. Maturilli, R. Neuber, P. Edwards, and H. Yamaguchi, 2015: Additional Arctic observations improve weather and seaice forecasts for the Northern Sea Route. Sci. Rep., 5, 16868. doi:10.1038/srep16868.
- Jensen, M. P., D. J. Holdridge, P. Survo, R. Lehtinen, S. Baxter, T. Toto, and K. L. Johnson, 2016: Comparison of Vaisala radiosondes RS41 and RS92 at the ARM Southern Great Plains site. Atmos. Meas. Tech., 9, 3115-3129.
- Kawai, Y., M. Katsumata, K. Oshima, M. E. Hori, and J. Inoue, 2017: Comparison of Vaisala radiosondes RS41 and RS92 launched over the oceans from the Arctic to the tropics. Atmos. Meas. Tech., 10, 2485-2498.
- Lucas, C., and E. J. Zipser, 2000: Environmental variability during TOGA COARE. J. Atmos. Sci., 57, 2333-2350.
- Miloshevich, L. M., A. Paukkunen, H. Vömel, and S. J. Oltmans, 2004: Development and validation of a time-lag correction for Vaisala radiosonde humidity measurements. J. Atmos. Oceanic Technol., 21, 1305-1327.
- Moteki, Q., K. Yoneyama, R. Shirooka, H. Kubota, K. Yasunaga, J. Suzuki, A. Seiki, N. Sato, T. Enomoto, T. Miyoshi, and S. Yamane, 2011: The influence of observations propagated by convectively coupled equatorial waves. Quart. J. Roy. Meteor. Soc., 137, 641-655.
- Nash, J., T. Oakley, H. Vömel, and L. Wei, 2011: WMO intercomparison of high quality radiosonde systems. WMO/TD-No.1580, Instruments and Observing Methods, Report No.107, 238 pp. [Available at https://library.wmo.int/doc_num.php?explnum_id=9467.]
- National Oceanic and Atmospheric Administration, 2018: Radiosonde Replacement System (RRS) Workstation User Guide for RWS software version 3.4.0.2. U.S. Department of Commerce, NOAA, National Weather Service Headquarters, Field Systems Operations Center, Observing Systems Branch, 334 pp. [Available at https://www.weather.gov/upperair/RRS.]
- Neelin, J. D., and I. M. Held, 1987: Modeling tropical convergence based on the moist static energy budget. Mon. Wea. Rev., 115, 3-12.
- Nuret, M., J.-P. Lafore, O. Bock, F. Guichard, A. Agusti-Panareda, J.-B. N'Gamini, and J.-L. Redelsperger, 2008: Correction of humidity bias for Vaisala RS80-A sondes during the AMMA 2006 observing period. J. Atmos. Oceanic Technol., 25, 2152-2158.
- Realini, E., K. Sato, T. Tsuda, Susilo, and T. Manik, 2014: An observation campaign of precipitable water vapor with multiple GPS receivers in western Java, Indonesia. Prog. Earth Planet. Sci., 1, 17, doi:10.1186/2197-4284-1-17.
- Rocken, C., R. Ware, T. Van Hove, F. Solheim, C. Alber, J. Johnson, M. Bevis, and S. Businger, 1993: Sensing atmospheric water vapor with the global positioning system. Geophys. Res. Lett., 20, 2631-2634.
- Sobel, A. H., J. Nilsson, and L. M. Polvani, 2001: The weak temperature gradient approximation and balanced tropical moisture waves. J. Atmos. Sci., 58, 3650-3665.
- Vömel, H., H. Selkirk, L. Miloshevich, J. Valverde-Canossa, J. Valdés, E. Kyrö, R. Kivi, W. Stolz, G. Peng, and J. A. Diaz, 2007a: Radiation dry bias of the Vaisala RS92 humidity sensor. J. Atmos. Oceanic Technol., 24, 953-963.
- Vömel, H., D. E. David, and K. Smith, 2007b: Accuracy of tropospheric and stratospheric water vapor measurements by the cryogenic frost point hygrometer: Instrumental details and observations. J. Geophys. Res., 112, D08305, doi:10.1029/2006JD007224.
- Wang, J., and L. Zhang, 2008: Systematic errors in global radiosonde precipitable water data from comparisons with ground-based GPS measurements. J. Climate, 21, 2218-2238.
- Wang, J., H. L. Cole, D. J. Carlson, E. R. Miller, K. Beierle, A. Paukkunen, and T. K. Laine, 2002: Corrections of humidity measurement errors from the Vaisala RS80 radiosonde-application to TOGA COARE data. J. Atmos. Oceanic Technol., 19, 981-1002.
- Wang, J., L. Zhang, A. Dai, F. Immler, M. Sommer, and H. Vömel, 2013: Radiation dry bias correction of Vaisala RS92 humidity data and its impacts on historical radiosonde data. J. Atmos. Oceanic Technol., 30, 197-214.
- Yamanaka, M. D., 2016: Physical climatology of Indonesian maritime continent: An outline to comprehend observational studies. Atmos. Res., 178–179, 231-259.
- Yoneyama, K., and C. Zhang, 2020: Years of the Maritime Continent. Geophys. Res. Lett., 47, e2020GL087182, doi:10.1029/2020GL087182.
- Yoneyama, K., M. Fujita, N. Sato, M. Fujiwara, Y. Inai, and F. Hasebe, 2008: Correction for radiation dry bias found in RS92 radiosonde data during the MISMO field experiment. SOLA, 4, 13-16.
- Zipser, E. J., and R. H. Johnson, 1998: Systematic errors in radiosonde humidities: A global problem? Preprints, Tenth Symposium on Meteorological Observations and Instruments. Phoenix, AZ, USA, Amer. Meteor. Soc., 72-73.
- Zuidema, P., 1998: The 600–800-mb minimum in tropical cloudiness observed during TOGA COARE. J. Atmos. Sci., 55, 2220-2228.


