Abstract
Objectives: “Intention to leave” (ITL) has been used interchangeably with the more positive construct “intention to stay” (ITS). The implicit assumption appears to be that both constructs represent different sides of the same coin. This study challenges this assumption. The objectives were (i) to test whether these constructs were similar measures of the same construct, and (ii) to assess the strength of the relationships between ITL and ITS with work-related outcomes. Methods: The Workforce Dynamics Questionnaire (WDQ) was administered to 298 staff. The WDQ included two items on ITL and was supplemented with three items on ITS. Structural equation modelling (SEM) was used. Results: The response rate was 43%. The correlation between the two constructs was negative and quite high (r=−0.84), indicating potential issues with discriminant validity. However, the constructs behaved differently in relation to job satisfaction and job integration. ITS was a strong predictor (0.95, p<0.001), whereas ITL was not significantly related (0.34, p=0.195) to JS. The direct effects of JI on ITS was 0.30 and on ITL was −0.42. The indirect effects of JI were more contrasting, being 0.56 for ITS and −0.30 for ITL, via job satisfaction. Conclusions: This is the first study amongst British health and social care workers that has demonstrated that ITS and ITL are not measuring the same construct. While there is overlap, care should be taken when using these constructs interchangeably, particularly when measuring these concepts in organizations and when developing retention programs, policies, or activities to modify ITS and ITL.
(J Occup Health 2014; 56: 292-300)
Introduction
The health care sector has a rapidly increasing ageing workforce, rising health care demands, and nursing staff and other health professionals are increasingly working part-time and leaving the profession early1). Additionally, health and social care workforce shortages have a negative effect on the quality of care provided and are associated with high costs2). Hence, maintaining the current workforce is crucial for the health care sector.
Staff turnover is an important metric in human resources management and maintenance of the current workforce. “Intention to leave” (ITL) is a widely used and well-developed proxy for staff turnover3) and future behavior of actually leaving a profession4) or an organization5). Multiple factors have impacts on ITL, including sociodemographic factors (e.g., age, occupation and family responsibilities6) work-related factors (e.g., team climate5)), and macroeconomic factors such as local job supply7).
Job satisfaction is a well-documented predictor of exit intentions across professionals; lower levels of job satisfaction predict intention to leave amongst doctors8), municipal workers9) and nurses6). A meta-analysis3) found that ITL is more predictive of employee turnover than overall job satisfaction, satisfaction with the work itself or organizational commitment. More recent research has also demonstrated this effect. Hann and colleagues4) found that job satisfaction predicted ITL and that ITL predicted actually leaving. There is evidence that ITL mediates most of the effect of job satisfaction on actual leaving4, 10).
“Intention to stay” (ITS) has also been measured amongst many occupational groups such as physician assistants11) and personal support workers12). ITS has been found to be broadly associated with similar factors as ITL.
In recent years, there has been an upward trend in employers and researchers using this measure (ITS) on the assumption that it is a more positive construct than ITL and that it measures the same construct. This assumption need to be empirically tested.
Several studies have indeed explored predictors of both ITS and ITL leave in various occupational groups including the hospitality industry13), Indian workers14) and nurses6). Generally, these studies have demonstrated across different occupational groups that similar but also different factors predict ITL and ITS. Ghosh et al14) showed that affective and normative commitment and goal clarity were the best predictors of employees' ITS or ITL an organization. Importantly, Howe7) demonstrated, in line with US findings, that there is considerable asymmetry between ITS and ITL amongst aged care workers, meaning that the drivers of intention to stay are not simply the opposite side of the drivers of intention to leave. They found that drivers of ITS were: having financially dependent children, being born in a non-English speaking country, speaking a language other than English but “not in the job” and wanting to work more hours. Whereas, the main drivers for ITL were having no financial dependent children, poor/fair self-rated health, a preference to work fewer hours and working in a remote location. Factors that impacted both ITL and ITS were casual or fixed-term contracts and geographical location.
It appears that the effect of predictors on ITL and ITS varies amongst populations and the methods used to define ITL and ITS. A meta-analysis10) found that the operationalizaton of behavioral intentions moderate the relationship between behavioral intentions, turnover and job satisfaction. Therefore, studies need to be clear about how they operationalize ITL and ITS. However, this is not always clear6). Some work has been done to validate ITS measures, but more is needed. Graham11) validated a measure for ITS but found a lack of overall meaning with respect to the item hierarchy for ITS amongst physician assistants and concluded more work is needed to ensure that the instrument is valid and meaningful.
The purpose of this study was to compare ITS and ITL among health and social care workers, to determine whether they are, in fact, measuring the same constructs, and to determine whether the two factors can be used interchangeably.
Materials and Methods
Population and procedure
All health and social care staff employed by a north England National Health Service Partnership Trust (n=298) were invited to participate in the study through an email containing a link to the online survey. This population was chosen because it represents a range of disciplines, including allied health professionals, nurses and social care workers.
The survey was conducted in May 2013 and included three reminders at weekly intervals. The survey was developed using the Qualtrics© online survey tool, which also managed the mail out and reminders. Ethics approval was received from the University of Sheffield ethics committee and was endorsed by the Trust (0621/KW; 17 May 2013).
The Workforce Dynamics Questionnaire
This study involved administration of the Workforce Dynamics Questionnaire (WDQ) in a set of community care services, which were being integrated into one15). The WDQ is a validated, 58 item, Likert-scale self-report questionnaire. It explores 11 domains: management; team working; training and skills development; access to support and equipment; autonomy; role perception; satisfaction; integration with team members; and role confidence. The WDQ also explores closeness of working and role overlap of the staff members to provide an “interprofessional” score. The WDQ is a reliable and valid scale16).
ITL and ITS
Items for ITL and ITS were measured on a 10-point Likert scale with ranging from 1=N/A and 2=strongly disagree to 11=strongly agree17). The items for ITL were as follows:
The items for ITS were as follows:
Work-related outcomes
Job satisfaction was measured in the WDQ by one item: “How satisfied are you with your current job?” Responses were scored on a 10-point Likert-scale from extremely dissatisfied to extremely satisfied. Job integration with peers and colleagues was measured by asking about various aspects of how well teams were working together.
Statistical analyses
ITL and ITS are considered latent variables in that they are not directly measurable but are estimated by various indicators. Therefore, structural equation modelling (SEM) was used to assess the relationship between the two variables (discriminant validity) and the relative relationships between ITL and ITS with other work-related variables (path analysis).
Discriminant validity of ITS and ITL was measured in three steps. First, as a preliminary measure, correlational analysis was used to assess whether the items of ITL and ITS correlated equally across all indicators, which would mean that ITL and ITS measure the same construct. If, however, they were to cluster together by correlating highly with each other and lowly with the items of the other construct, this would suggest the presence of two clear constructs. Second, confirmatory factor analysis (CFA) was used to assess the strength of the correlation between ITL and ITS. If the correlation coefficient was high (≥0.85) this would suggest that ITL and ITS measure the same construct, as it would indicate (R2)>75% variance shared between the constructs, which would allow for a minimum of 30% error variance, or 15% per construct. Third, SEM was used to investigate the relationship between ITL and ITS with job satisfaction and job integrity, to see whether the strength of the structural relationships were similar, as given by the size of the relative regression coefficients (path analysis). If ITL and ITS are alike, then the strength of the coefficients (paths) should be similar, with the only difference being the directions (sign) of the coefficients.
All preliminary and correlational analyses were conducted using IBM SPSS v20. SEM including CFA were conducted using MPlus v6. Prior assumption testing for correlational analysis included checking for independence, linearity and normality. Variables not meeting these assumptions were transformed. Missing values (MVs) were dealt with on a case by case basis prior to SEM analysis. Where MVs were found not missing at random, cases were excluded. Where MVs were found to be missing at random, the EM (expectation-maximization) algorithm in SPSS was used to impute the MV based on maximum likelihood methods.
SEM models were assessed by a range of goodness of fit (GOF) statistics. Chi-square (χ2) and Root Mean Square Error of Approximation (RMSEA) statistics are reported, along with the CFI (Comparative Fit Index). As chi-square and RMSEA are both influenced by sample size, it is usual practice to make a holistic assessment of the model fit using a range of GOF indices. A significant chi-square statistic indicates poor model fit. The chi-square/degrees of freedom (df) differential was used to assess model fit, with adequate model fit suggested at χ2/df<3. RMSEA values <0.08 and CFI values >0.95 are considered adequate model fit.
Results
Sampling
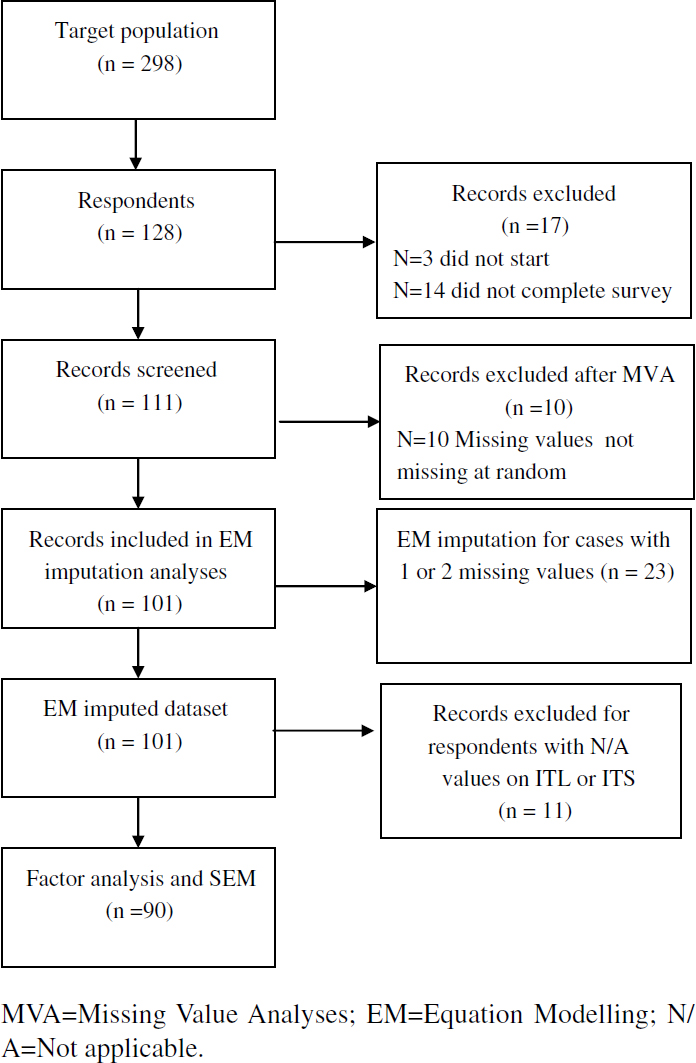
The response rate was 43% (128/298) (Fig. 1). Of the initial respondents, 17 cases had not started (n=3) or had not completed the survey (n=14) and were withdrawn from the analysis. Further cases (n=10) were withdrawn for missing data that were not missing at random but were missing for 3 or more consecutive items, suggesting systematic non-response. After these exclusions, there were 23 cases with one or two missing values, which seemed to be missing at random. EM imputation in SPSS was used to impute the missing values into the data set, resulting in n=111. A further 11 cases were withdrawn, as the respondents had responded with N/A (not applicable) to one or more of the items measuring ITL and ITS. The final sample size for analysis was n=90.
Descriptive statistics
Table 1 displays the sociodemographic and work characteristics of the participants.
Table 1.
Prevalence of demographic and work characteristics of the participants (N=128)
| Variable |
% |
| Gender: Female |
83 |
| Main profession: |
|
| District nurse |
21 |
| Occupational therapist |
21 |
| Physiotherapist |
19 |
| Other |
39 |
| Primary place of care provision |
|
| Clients' homes |
55 |
| Community |
38 |
| In-patient hospital setting |
6 |
| Full-time status |
54 |
|
Mean (sd) |
Range |
| Age (years) |
43.5 (11.0) |
(20–69) |
| Hours of work |
31.7 (7.5) |
|
| Duration of employment (years) |
9.2 (6.5) |
(10 months to 25 years) |
The timing of the survey coincided with a process of structural integration, where 6.7% had completed integration, 66.7% were currently undergoing integration and 25.1% had not commenced integration. Most of the respondents in the sample (70%) strongly disagreed with the statement they were professionally isolated (by indicating 1, 2 or 3 on the 10-point Likert scale). Most of the respondents in the sample (55.5%) were clear about their own role on the team (scoring 1, 2 or 3). There was a lot of uncertainty in the workplace, however, with 61.1% strongly disagreeing that they had a clear idea of how the team will look in 12 months (scoring 1, 2 or 3) and 46.6% strongly disagreeing (scoring 1, 2 or 3) that they felt secure in their job. Most (53.4%) were dissatisfied with the management structure and styles (scoring 1, 2 or 3), with 55% strongly disagreeing (scoring 1, 2 or 3) with the statement they can express concerns to their manager.
Preliminary analyses
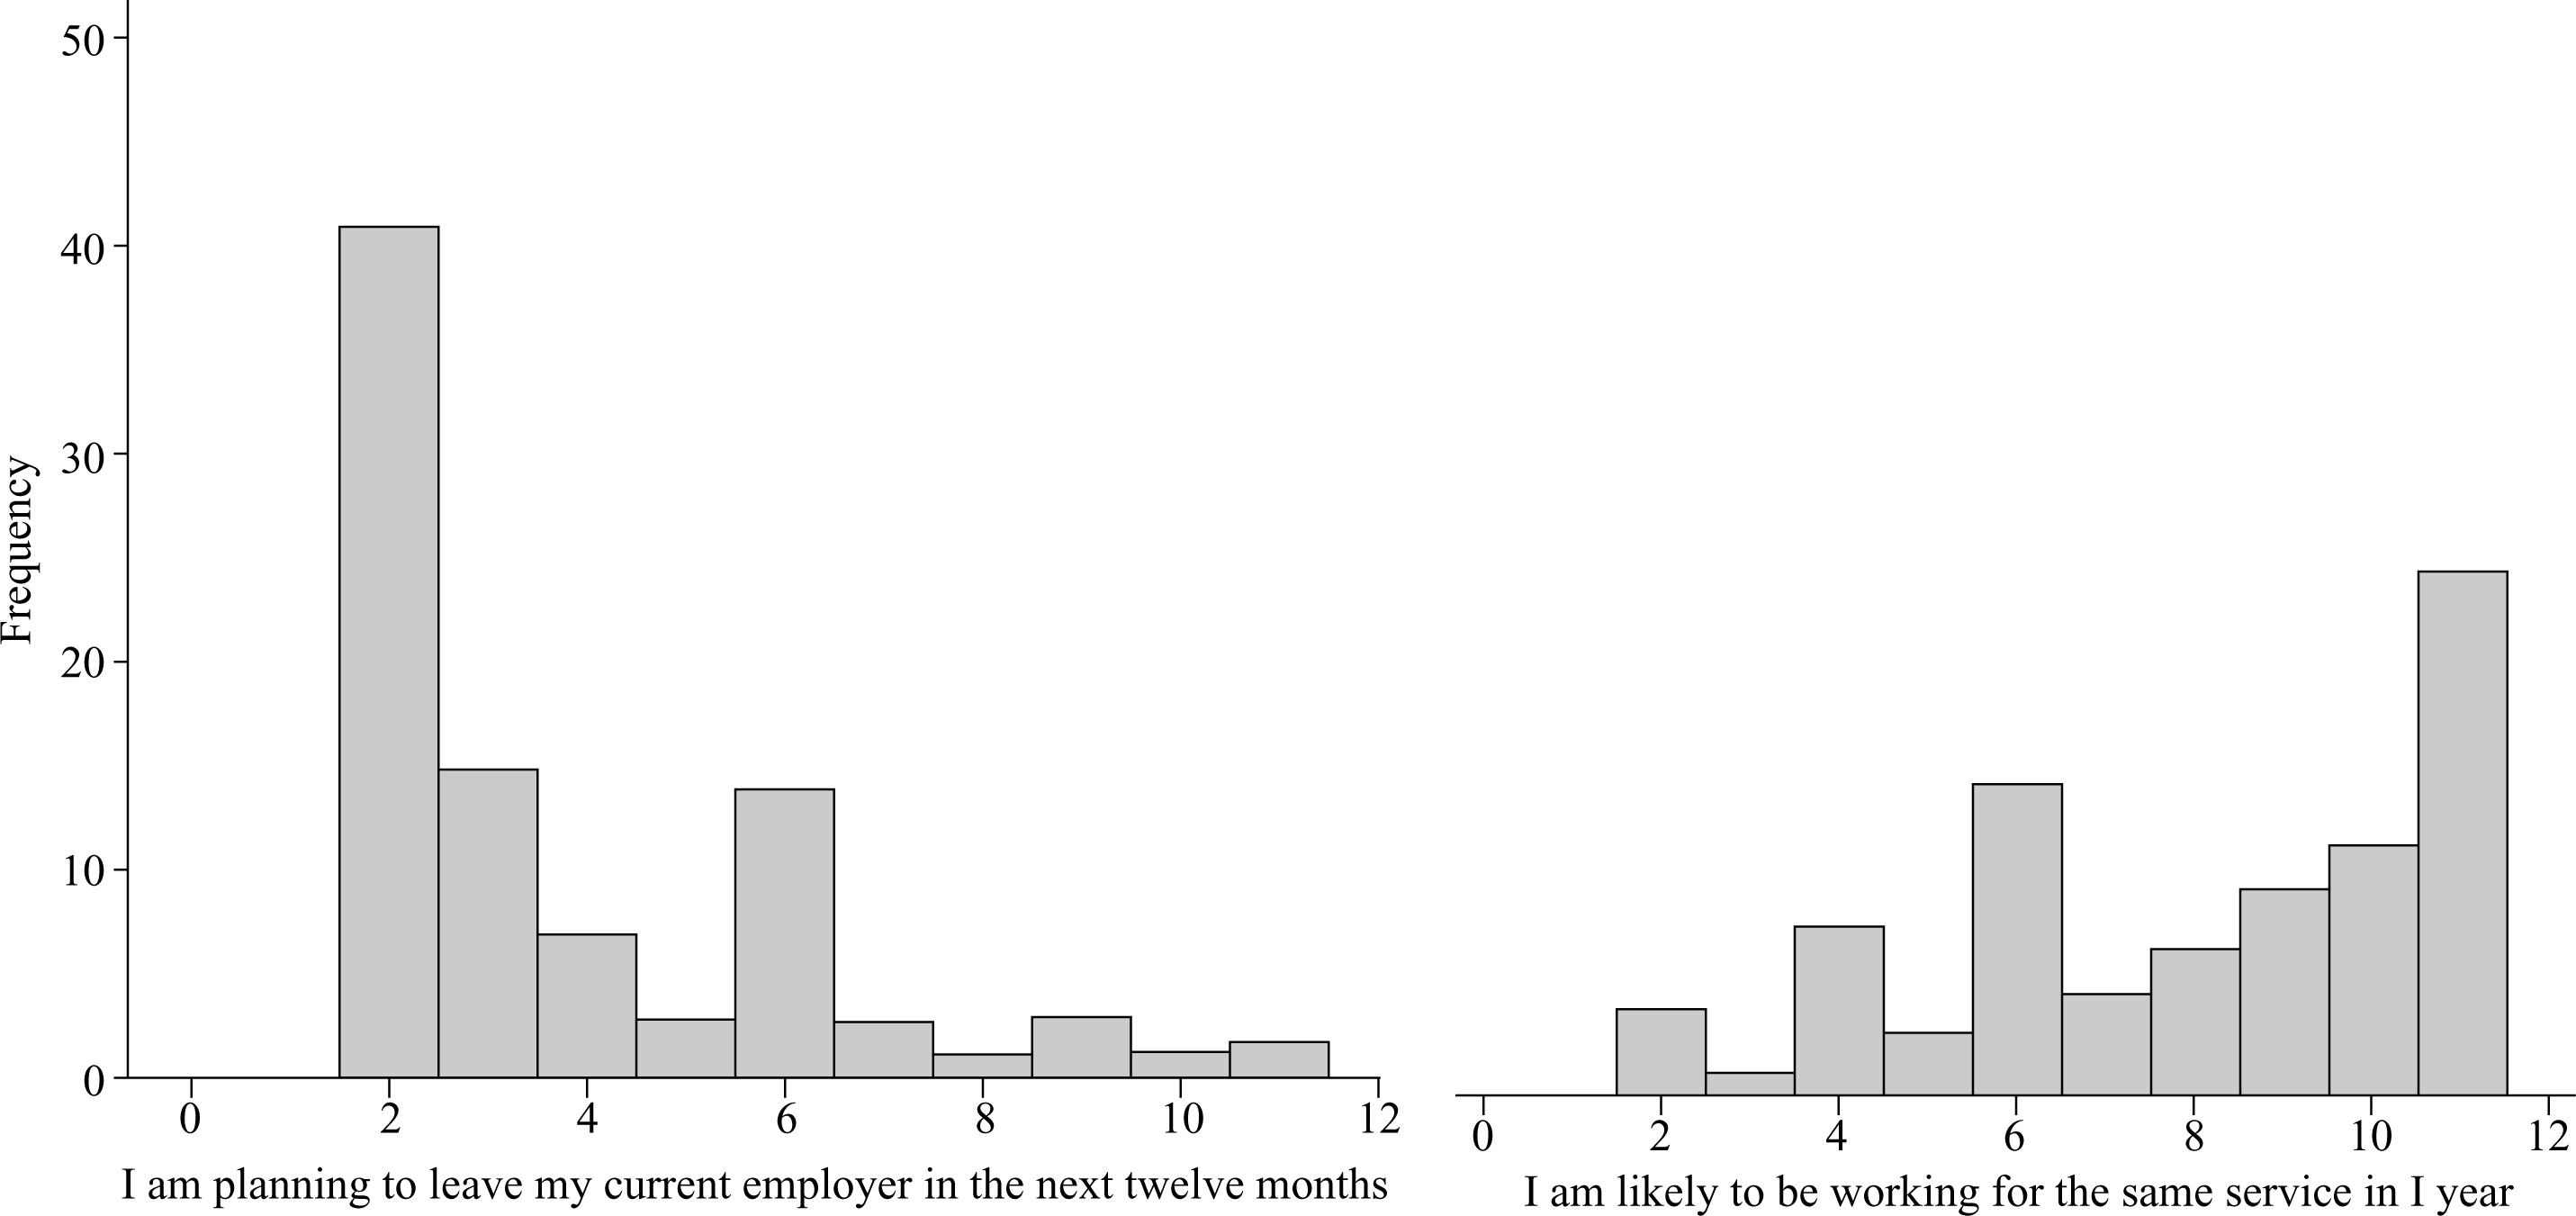
The distributions of the ITL items demonstrated that most of the respondents in the sample were not planning to leave their current employment within the next 12 months (ITL1), or change profession (ITL2). Indeed 45.6% of the sample strongly disagreed (Fig. 2). This was higher for ITL2 (change profession, graph not shown), which had a response rate of 62.6% for 1=strongly disagree, and 70% for 1 and 2 combined.
The responses for the corresponding ITS item were not as clear, but the majority (28%) strongly agreed that they would be likely to be working for the same service in the next 12 months.
Correlational analysis
Log 10 transformations were applied to each of the items. The two ITL items had the highest correlation (r=0.77, p<0.01, n=90) with each other and were more mildly correlated with the ITS items (−0.51 to −0.64) (Table 2 shaded area).
Table 2.
Correlational analysis of the five items for the two constructs (ITS and ITL)
|
ITS1 |
ITS2 |
ITS3 |
ITL1 |
ITL2 |
| ITS1 |
|
|
|
|
|
| ITS2 |
0.46 |
|
|
|
|
| ITS3 |
0.58 |
0.69 |
|
|
|
| ITL1 |
−0.60 |
−0.53 |
−0.64 |
|
|
| ITL2 |
−0.55 |
−0.58 |
−0.51 |
0.77 |
|
All Pearson two-tailed correlations; all significant at p<0.01; all items log 10 transformed; n=90.
On the other hand, the ITS items were not as highly correlated with each other; indeed the lowest correlation was between two items of the ITS construct (r=0.46). The average of the three ITS inter-item correlations (0.46 + 0.58 + 0.69) was 0.58, and the average of the correlations between ITS and ITL (Table 1 shaded area) was 0.57. This suggests that, on average, the ITS items are not discriminating between their own construct and the ITL construct.
The r2 was 34% for the average of the ITS items and 59% for the ITL items, suggesting that the ITS items had about one-third shared variance, whereas the ITL items had almost double this level of overlap in explained variance among themselves. In summary, the two ITL items appeared to be clearly more representative of the ITL construct than the ITS construct, but the three ITS items did not appear to represent ITS any more so than they could represent ITL.
Structural equation modelling
The model with the two constructs and their respective indicators is illustrated in Figure 3a. It was a reasonable model fit to the data (χ2(4)=13.42, p=0.009, RMSEA=0.162 [90%CI: 0.072, 0.221), CFI=0.958, TFI=0.895). The RMSEA was a little too high, and its confidence interval (CI) was too wide, but this can be a result of a low sample size and low degrees of freedom. Additionally, the CFI and chi-square differential suggested this model has an adequate model fit, and its estimates are considered reliable.
The factor loadings for the indicators are given on the paths in Fig. 3, and the error variances are given on the arrows pointing into the indicators (rectangles). The largest error term was for ITS2, and indicates that 50% of the variance in the item was not explained by the model. The correlation between the two constructs was −0.842. The constructs share 70% common variance (R2=0.70).
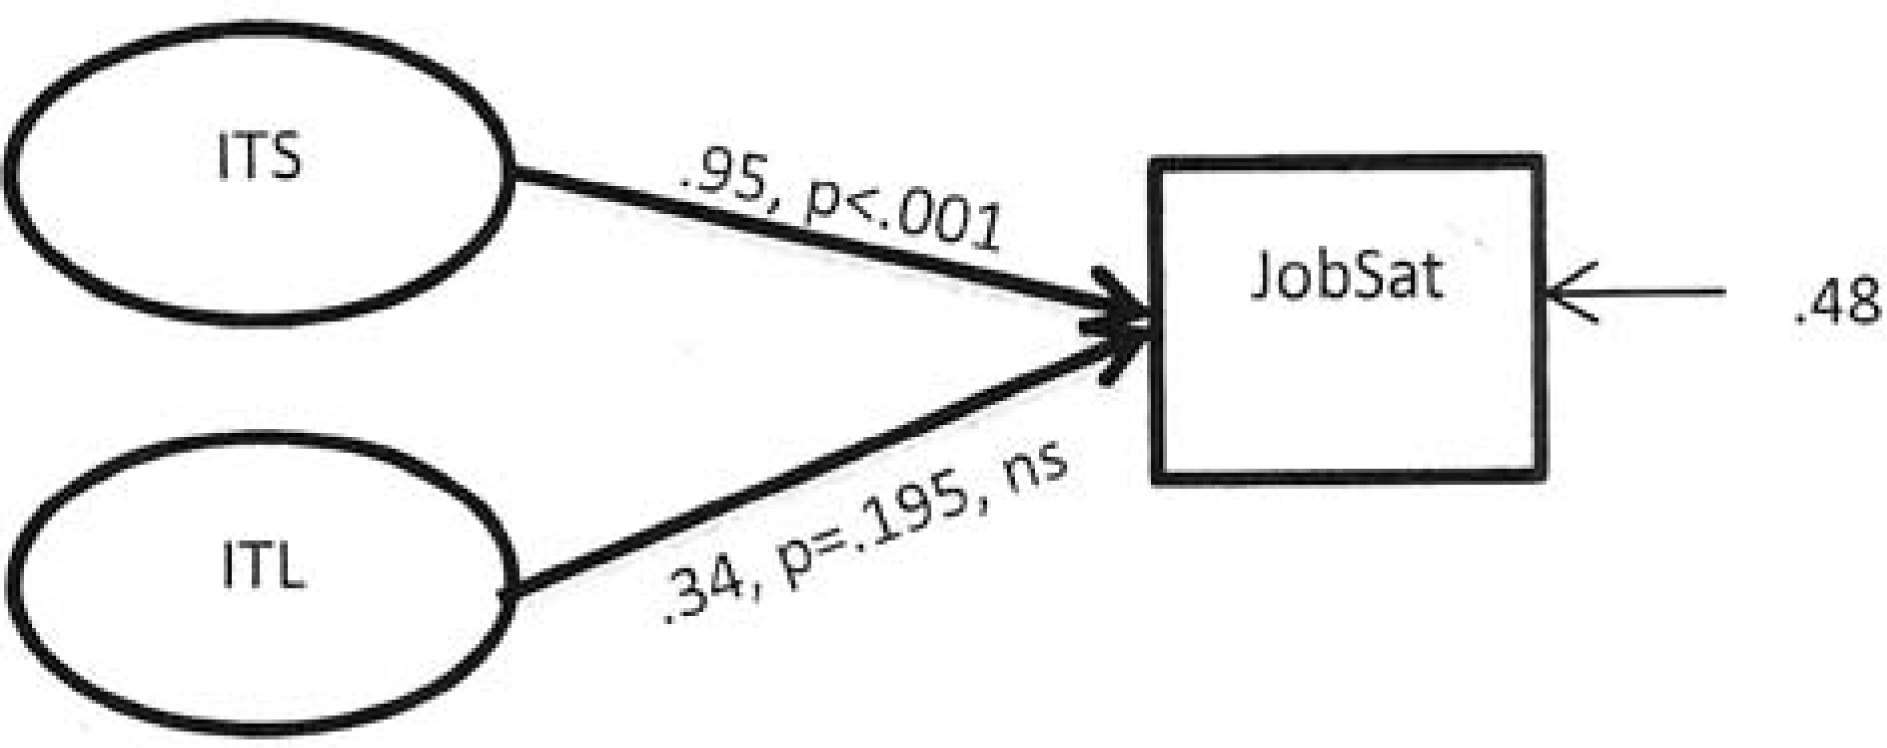
The second model explored whether ITS and ITL could equally predict job satisfaction (Fig. 3b). The distribution followed the normal bell curve, with a mean of 6.07 (SD=1.99). The error variance for job satisfaction (JobSat) was 0.48, indicating that 52% of the variance in job satisfaction was explained by the model. From the path coefficients, it is apparent that most of this was explained by ITS (0.95, p<0.001). Indeed ITL was not a significant predictor of job satisfaction, while ITS was a highly significant predictor. The paths in this model were standardized regression coefficients; thus for each unit increase in ITS, there was a corresponding 0.95 unit increase in job satisfaction.
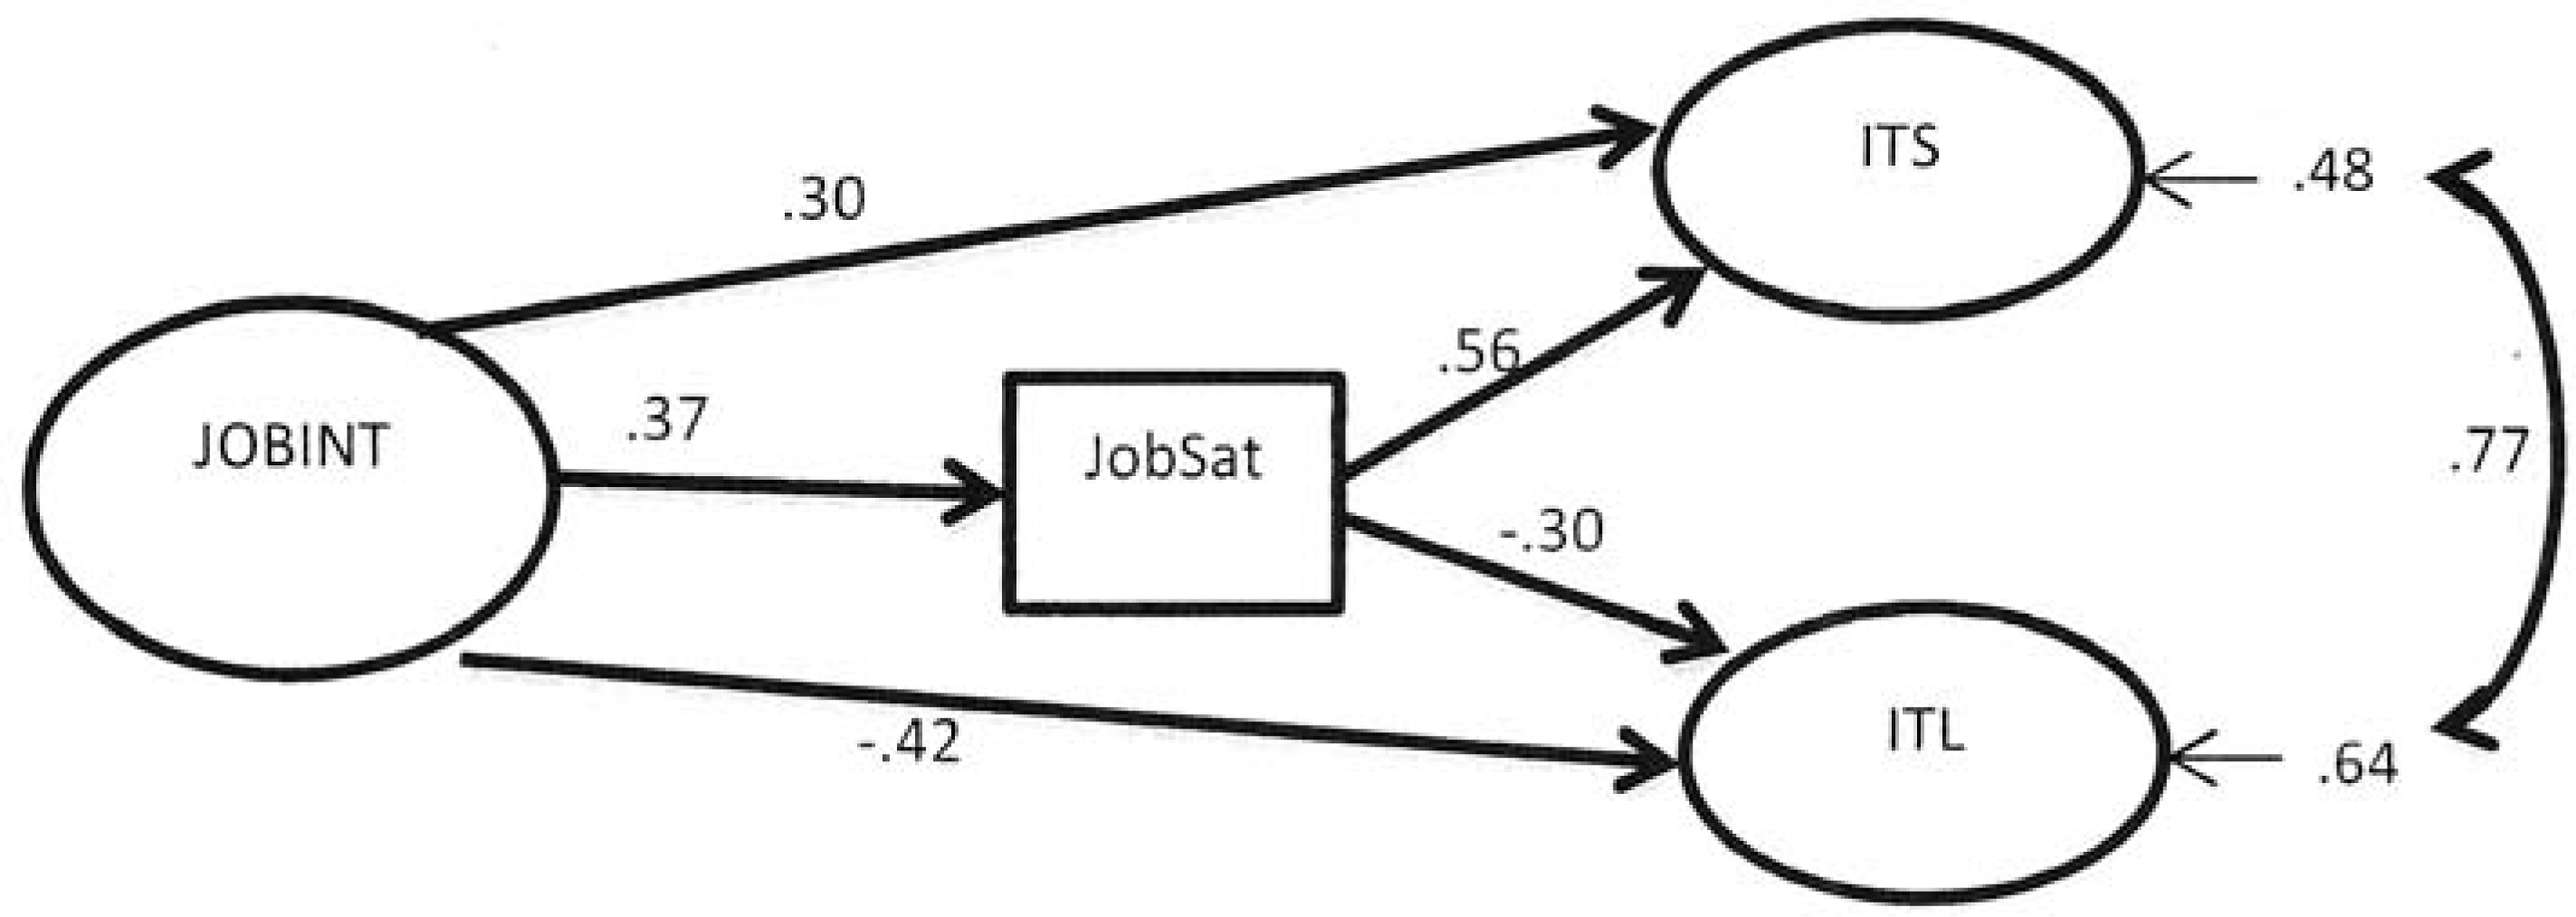
While modelling is useful to explore for relative differences in the relationships between constructs and other variables in cross-sectional data, in reality, however, job satisfaction is much more likely to precede ITS and ITL than the other way around. The third model (Fig. 3c) shows that job satisfaction was a positive predictor of ITS and a negative predictor of ITL.
A predictor of job satisfaction, job integration (JOBINT), was then added to the model (Fig. 3c). JOBINT was a latent construct (denoted by use of capital letters in its label) with seven indicator variables, not shown, having the factor loadings given in Table 3. In theory, a team that is working well together would enhance job satisfaction, which would reduce ITL and increase ITS. This would be a mediated model, with JobSat mediating the relationship between JOBINT and ITL and ITS.
Table 3.
Standardized factor loadings for job integration (JOBINT), the construct representing the seven items relating to job integration on the WDQ
| Factor loadings |
|
| Q15_1 |
0.532 |
| Q15_2 |
0.554 |
| Q15_3 |
−0.426 |
| Q15_4 |
0.647 |
| Q15_5 |
0.383 |
| Q15_6 |
0.607 |
To assess this theory, modelling was conducted leaving in all the path variables to assess the relative strengths of the mediated versus the direct effects. When these relationships were modelled, all the paths were significant, indicating that the latent construct JOBINT, as measured by its seven indicators, has both direct and indirect effects on both ITS and ITL with indirect effects mediated via JobSat (Fig. 3c).
The third model (Fig. 3c) had the best model fit statistics of all the models, as given by an RMSEA of 0.088 and a narrowed CI (0.058, 0.117), indicating that more of the variance in the data were being accounted for by the model and therefore that there was less error variance. Clearly, the paths leading to ITS and ITL had coefficients of different sizes. For instance, the direct effects of JOBINT on ITS was 0.30 and on ITL was −0.42. The indirect effects were more contrasting, being 0.56 for ITS and −0.30 for ITL, via JobSat. In addition, the error terms for the outcome constructs were different. These estimates indicate that 52% of the variance in ITS and 36% of the variance in ITL was explained by the model. The error terms between ITS and ITL were correlated, indicating that 59% of the error variances were shared. That is, there was an overlap of around 60% of variance that was unique to ITS and ITL that was not explained by the model.
Discussion
ITS is a highly significant predictor of job satisfaction but ITL is not. This suggests that it is redundant to measure ITS separately from job satisfaction. However because ITL is different from job satisfaction, it should be measured in addition to job satisfaction.
The results demonstrated that, on average, the ITS items are not discriminating between their own construct and the ITL construct. While it appears there is considerable overlap between the constructs ITL and ITS, they have also been observed to behave in very different ways during modelling. The most glaring difference was observed when modelling the constructs as predictors of job satisfaction (Fig. 3B), where for every unit change in ITS, there was a corresponding 0.96 of a standard deviation of change in job satisfaction, but only 0.34 standard deviation change in ITL. In reality, however, job satisfaction is more likely to be the predictor and ITL and ITS are more likely to be the outcome6, 11). Indeed, job satisfaction was a positive predictor of ITS and a negative predictor of ITL. This follows the theory that low scores for job satisfaction would predict high scores for ITL and low scores for ITS and is also in line with studies conducted amongst nurses6) and in the context of other occupational groups such as the US military18) or Chinese managers in the car manufacturing industry19) but contrasts slightly with a study amongst British GPs4). This study also found that higher job satisfaction was associated with ITL and that higher dissatisfaction was predictive of actually leaving but also that higher job satisfaction did not lead to staying. This may reflect differences between occupational groups or operationalization of ITS and ITL.
In our study, when ITL and ITS were modelled as outcome variables in a mediation model with job integration as the predictor variable with direct and indirect effects mediated via job satisfaction (Fig. 3C), it was evident that the two constructs, ITL and ITS, were distinctly different for two reasons. First, there were variations in the effect sizes of job integration and job satisfaction on both ITL and ITS. The direct effects of job integration on ITS was 0.30 and on ITL was −0.42. Additionally, the indirect effects of job integration via job satisfaction was even more contrasting, with the effect being 0.56 for ITS and −0.30 for ITL. Secondly, there were variations in the amount of variance the model explained for each outcome variable.
The correlation between ITL and ITS was quite high (r=0.84), suggesting a large degree of overlap in the constructs (70%). This could be interpreted as borderline discriminant validity, particularly if a cutoff of r=0.85 was used to determine discriminant validity. The correlational analysis suggested that the two items for the ITL construct, were not as strongly associated with ITS, but that the three items for the ITS construct, were as strongly associated with the ITL items as they were with their own ITS items. This may be a matter of how the questions were asked. It could also reflect the degree of uncertainty in this sample. Indeed, the respondents in the sample were in the process of structural integration, and high proportions of the respondents in the sample were unsure of how things were going to turn out for the team and their own jobs. Despite the uncertainty, there was a strong sense of team building and bonding within the sample.
Job integration was highly predictive of job satisfaction, which in turn was predictive of intention to leave and ITS outcomes. In addition, job integration had significant direct effects on the outcomes. Indeed, both job integration and job satisfaction explained 52% of the variance in ITS and 36% of the variance in ITL.
Strengths and limitations
The main study limitations were the cross-sectional nature of the study, the relatively small sample size, the restriction of the sample to health and social care staff in the UK and the transitioning of the workforce into a model of increased job integration. However, the latter may also be seen as a strength of the study because globally most organizations are in a constant flux of change, so the results may apply to other organizations that face uncertainty or change. There were also no differences in levels of job satisfaction between those staff who had been through integration and those who had not (p=0.97)20).
Additionally, societal, legislative and policy factors that have impacts on early exit intentions21) can be difficult to change22). The validation method represents a strength of the study together with the finding that ITL and ITS are different constructs which has not previously been previously investigated amongst British health and social care workers. When generalizing the study results and validity, one should take into account the differences between countries, professional groups and the operationalization of ITS and ITL.
When all these factors are considered, the weight of evidence suggests that there are distinctions between ITL and ITS that should be considered in future analyses. Failure to account for the uniqueness in the respective constructs risks increased error variances and reduced precision of estimates. The modelling presented in this work suggests that while there is a degree of overlap between these constructs, there may also be a degree of variance that remains unique to each construct. This is particularly important if employers, researchers or policy makers need to understand the reasons behind employees' intention to leave or stay. The findings from the structural relationships with other variables during modelling, in particular, suggest that the two constructs are different. The findings add to management theory because they demonstrate that management needs to be clear about whether they want to reduce ITL or improve ITS. Management also needs to be clear about which factors they should select to address ITL or ITS in order to achieve organizational goals. From a practical viewpoint, this study has demonstrated that workforce managers and policy developers wishing to improve retention should carefully choose whether to measure ITL, ITS or both in their organizations. Their choice will have an impact on the further development of retention programs, policies, and activities to modify ITS and ITL within their organization and hence on the productivity of their employees. Practitioners should be aware that there may be occupational differences in ITL and ITS. For example, Howe et al. showed that factors having an impact on workers' intentions to stay or leave operated differently in the residential and community care workforces7).
Further research on probability samples is required to further explore these differences amongst different occupational groups. Additionally, because ITL is a proxy for turn-over3), longitudinal studies with a larger sample size are required to include turnover rates as an outcome measure.
Conclusions
This is the first study amongst British health and social care workers that has demonstrated that ITS and ITL are not measuring the same constructs. It is also the first study to compare the direct and indirect effects of job satisfaction and job integration on ITL and ITS, and thereby contribute to the theoretical literature on determinants of intention to stay or leave. While there is overlap, care should be taken when using these constructs interchangeably, particularly when measuring these concepts in organizations and when developing retention programs, policies, or activities to modify ITS and ITL.
Acknowledgments: We gratefully acknowledge the staff who took part in this survey.
References
- 1) Pit S, Hansen V. Factors influencing early retirement intentions in Australian rural general practitioners. Occup Med 2014; 64: 297-304.
- 2) Contino DS. Can room and board lead to hidden revenue? Nurs Manage 2002; 33: 10-11.
- 3) Steel RP, Ovalle NK. A review and meta-analysis of research on the relationship between behavioral intentions and employee turnover. J Appl Psychol 1984; 69: 673-86.
- 4) Hann M, Reeves D, Sibbald B. Relationships between job satisfaction, intentions to leave family practice and actually leaving among family physicians in England. Eur J Public Health 2011; 21: 499-503.
- 5) Kivimäki M, Vanhala A, Pentti J, et al. Team climate, intention to leave and turnover among hospital employees: prospective cohort study. BMC Health Serv Res 2007; 7: 170.
- 6) McCarthy G, Tyrrell M, Lehane E. Intention to ‘leave’ or ‘stay’ in nursing. J Nurs Manag 2007; 15: 248-55.
- 7) Howe AL, King DS, Ellis JM, Wells YD, Wei Z, Teshuva KA. Stabilising the aged care workforce: an analysis of worker retention and intention. Aust Health Rev 2012; 36: 83-91.
- 8) Sibbald B, Bojke C, Gravelle H. National survey of job satisfaction and retirement intentions among general practitioners in England. BMJ 2003; 326: 22.
- 9) von Bonsdorff ME, Huuhtanen P, Tuomi K, Seitsamo J. Predictors of employees' early retirement intentions: an 11-year longitudinal study. Occup Med 2010; 60: 94-100.
- 10) Irvine D, Evans M. Job satisfaction and turnover among nurses: integrating research findings across studies. Nurs Res 1995; 44: 246-53.
- 11) Graham K. Development and Validation of a Measure of Intention to Stay in Academia for Physician Assistant Faculty [Ph.D.]. Ann Arbor: The University of Toledo; 2013.
- 12) Zeytinoglu IU, Denton M, Brookman C, Plenderleith J. Task shifting policy in Ontario, Canada: Does it help personal support workers' intention to stay? Health Policy [In press, corrected proof]. (DOI: http://dx.doi.org/10.1016/j.healthpol.2014.01.004)
- 13) Cho S, Johanson MM, Guchait P. Employees intent to leave: a comparison of determinants of intent to leave versus intent to stay. International Journal of Hospitality Management 2009; 28: 374-81.
- 14) Ghosh P, Satyawadi R, Joshi JP, Shadman M. Who stays with you? Factors predicting employees' intention to stay. Int J Organizational Analysis 2013; 21: 288-312.
- 15) Nancarrow SA, Moran A, Enderby P, et al. The relationship between workforce flexibility and the costs and outcomes of older peoples services. London: National Institute of Health Research, 2010.
- 16) Nancarrow SA, Moran A, Bradbury J, Enderby P, Jones G. Development and preliminary validation of a Workforce Dynamics Questionnaire: an instrument to measure the impact of worker flexibility on staff outcomes. Unpublished. 2014.
- 17) Cummins RA, Gullone E, editors. Why we should not use 5-point Likert scales: The case for subjective quality of life measurement. Proceedings. Second International Conference on Quality of Life in Cities. Singapore: National University of Singapore; 2000.
- 18) Harrington D, Bean N, Pintello D, Mathews D. Job satisfaction and burnout. predictors of intentions to leave a job in a military setting. Admin Soc Work 2001; 25: 1-16.
- 19) Lin Q-H, Jiang C-Q, Lam TH. The relationship between occupational stress, burnout, and turnover intention among managerial staff from a Sino-Japanese joint venture in Guangzhou, China. J Occup Health 2014; 55: 458-67.
- 20) Enderby P, Ariss S, Nancarrow S, Blinston A. Staffordshire and Stoke on Trent Partnership NHS Trust: ‘Better Together’ Integrated Health and Social Care Evaluation Report. Sheffield (UK): School of Health and Related Research, University of Sheffield, Innovation Centre; 2013.
- 21) O'Loughlin K, Humpel N, Kendig H. Impact of the global financial crisis on employed Australian baby boomers: a national survey. Australas J Ageing 2010; 29: 88-91.
- 22) Humphreys J, Wakerman J, Kuipers P, et al. Improving workforce retention: developing an integrated logic model to maximise sustainability of small rural & remote health care services. Canberra: Australian Primary Health Care Research Institute, ANU; College Of Medicine, Biology & Environment, ANU; School Of Rural Health, Monash University; Bendigo Centre For Remote Health; Menzies Centre For Health Policy, ANU; 2009.