Abstract
The voltammetric determination of metsulfuron-methyl, a type of pesticide, was investigated on a hanging mercury drop electrode using a differential pulse cathodic stripping voltammetry technique. The experimental parameters, such as the pH of the Britton–Robinson buffer, accumulation time, accumulation potential and initial potential were optimized for the metsulfuron-methyl determination. A well-defined reduction peak was observed at pH 2.0 to 4.0 in the potential range of −0.75 to −1.0 V. The pH of 2.0 was chosen as the optimum pH due to a good stripping signal of the reduction peak. There were no significant interfering ion effects on the electroanalysis of metsulfuron-methyl. The optimized parameters were then used to determine metsulfuron-methyl in the commercial pesticide Ally. The proposed method was highly sensitive due to the lower limit of determination (0.04 mg/L), being relatively selective, and consisting of good precision. The recovery values achieved were about 93% in water samples for this analysis.
Introduction
Pesticides play main role in agriculture as they are widely used in pest control so as to reduce yield loss and maintain the quality of products. The usage of pesticide has greatly increased worldwide during the last three decades.1,2) Almost all pesticides are toxic, which may lead to long-term adverse effects in the aquatic environment.3,4) These negative effects can be controlled by implementing “Good Agriculture Practices” to overcome the hazardous problems of pesticide usage.5,6)
Metsulfuron-methyl (MSM; structure shown in Fig. 1) is a sulfonylurea herbicide in a small, white, granular form that can be used to kill broadleaf weeds and some annual grasses.7–9) MSM can be utilized on various crops such as maize, wheat, rice, and soybeans.7,10) Additionally, MSM is highly mobile in soil and moderately persistent in water, though it can enter water sources from field drainage or runoff water.7,11) The degradation of MSM in soil is basically reliant on the soil pH, moisture content, and temperature.11) MSM can be easily degraded in acidic media, as well as in soils with high moisture content and high temperature.12)
The available literature reports that numerous methods, such as chromatography,7,13–16) capillary electrophoresis,10,17) and spectrophotometry,18) have been used for the determination of MSM. However, these methods are usually costly, time-consuming, and tedious, and they consist of a sample pretreatment step. Currently, the application of voltammetric techniques is widespread in the study of pesticides17,19) due to their advantages, such as having a simple process, portability, and good sensitivity, as well as being less time-consuming and more cost-effective. Moreover, stripping voltammetry is a very sensitive technique for measuring trace level organics, including pesticides.20)
In the present study, a novel analytical method that is highly selective, sensitive and rapid for the determination of MSM was applied. The voltammetric behavior of MSM was examined using a hanging mercury drop electrode (HMDE), and the parameters that influenced the differential pulse cathodic stripping voltammetry (DPCSV) determination of MSM were optimized. Furthermore, the optimized parameters were applied for determining the active ingredient (MSM) in the commercial product, Ally, as well as in water samples, which were taken from tap water and a drinking-water dispenser to ensure the reliability of the proposed method. This is the first report that has correlated the voltammetric studies of MSM on an HMDE using DPCSV. This technique was found to be suitable and sensitive in MSM analysis, which led to a lower limit of determination. From the recovery values that were obtained, it can be deduced that the DPCSV technique can be effectively applied for the determination of MSM in Ally and water samples.
Materials and Methods
1. ChemicalsMetsulfuron-methyl, C14H15N5O6S (99.2% purity) was purchased from Sigma-Aldrich (Seelze, Germany). The stock solution of MSM (191 mg/L) was prepared by dissolving 0.010 g of MSM in 50 mL of deionized water. Ally was obtained from the Malaysian Palm Oil Board (MPOB), Keratong Research Station, Pahang, Malaysia. A Britton-Robinson (BR) buffer (0.04 mol/L) was used as a supporting electrolyte and it was prepared by dissolving 2.47 g of boric acid, 2.3 mL of glacial acetic acid and 2.7 mL of orthophosphoric acid in 1000 mL of deionized water. The pH values (2.0 to 12.0) of the BR buffer solution were adjusted with hydrochloric acid (0.2 mol/L) or sodium hydroxide (0.2 mol/L). All solutions used in this study were prepared with water purified in a Millipore Milli-Q system (resistivity ≥18 MΩ cm). All working solutions were stored at 4°C.
2. Stripping procedureDifferential pulse voltammetry experiments were performed with a PGSTAT 30 Autolab Metrohm VA 663 stand (Netherlands). The voltammetric method was implemented using a three-electrode system. A hanging mercury drop working electrode, a platinum counter electrode, and a Ag/AgCl/KCl (3.0 mol/L) reference electrode were used in this study. A bench-top pH meter (CyberScan pH 500, Eutech Instruments (Netherlands)) was used for pH measurements. All preparations and measurements were performed at room temperature (25°C). The procedure to obtain the DPCSV curves was as follows: (i) the the blank solution was recorded after degassing the solution with a nitrogen flow in the voltammetric cell and stirring for 300 sec, and (ii) the sample aliquot was added to the voltammetric cell and degassed for 30 sec, and the voltammogram was recorded. Finally, the peak current of the sample solution was measured.
3. Metsulfuron-methyl determination in different samplesThe determination of MSM was carried out for Ally, a known commercialized product, and for several water samples collected from tap water and a drinking-water dispenser at Universiti Teknologi Malaysia, Johor, Malaysia. The water samples were spiked with the appropriate amount of standard MSM. The procedure for the DPCSV determination of MSM in model samples was as follows: 18.0 mL of the model water sample was diluted to 20.0 mL with the BR buffer (pH 2.0), and after deaeration with nitrogen, the DPCSV voltammograms at the HMDE were recorded.
The recovery percentage of MSM in Ally and the spiked water samples was calculated using the following equation (Equation 1):
 | (1) |
Results and Discussion
1. Effect of pHDifferential pulse voltammetric studies of MSM on an HMDE were carried out at various pH levels, ranging from 2.0 to 12.0. A well-defined reduction peak was observed, and the stripping signal showed a decrease as the pH was increased from 2.0 to 4.0, though it became unstable after pH 7.0. This instability may have been due to the hydrolysis of MSM at alkaline conditions, which could have caused the peak current to become unstable at a more basic condition. Fig. 2 shows the voltammetric behavior of MSM at pH 2.0 to 4.0. With the increase in pH value, the reduction peak also shifted toward a more negative potential due to the existence of a protonation reaction in the reduction mechanism of MSM.21,22)
From Fig. 2, pH 2.0 was chosen as the optimum pH for this voltammetric analysis due to the good stripping signal of MSM. Fig. 3 illustrates the DPCSV voltammogram recorded for MSM using an HMDE at the optimum pH.
It can be stated that the pH of the supporting electrolyte (0.04 mol/L, BR buffer) was one of the most important issues to be considered in the measurement of the voltammetric response. In general, the voltammetric behavior is controlled by the amount of electroactive species adsorbed on the HDME, which is influenced by the pH of the supporting electrolyte.23)
2. Effect of operating parametersIn the voltammetric method, the accumulation of analyte on the electrode surface is a crucial phase to accomplish a greater sensitivity for quantitative studies. The experiments were performed for the accumulation potentials (Eacc) varying from 0.0 to −1.0 V to classify the electrostatic attraction or repulsion between the electrode surface and MSM. Fig. 4(a) represents the differential pulse voltammetric behaviors of 0.57 mg/L for MSM on the HMDE with different accumulation potentials at the optimum pH 2.0 of the BR buffer. From Fig. 4(a), it can be observed that the cathodic peak current slowly increased until the Eacc=−0.2 V and then it increased sharply until Eacc=−0.5 V, after which it gradually decreased. The maximum peak current was found at Eacc=−0.5 V for MSM on the HMDE, indicating maximum accumulation of MSM on the surface of HMDE at this potential.24,25)
The effect of the initial potential, Ei on MSM was inspected in a BR buffer at pH 2.0 by observing the effects of Ei on the peak current. Fig. 4(b) shows the studies of MSM on an HMDE at different values of Ei. The Ei varied from 0.0 to −1.0, whereas the final potential, Ef, remained constant at −1.4 V. For a good stripping voltammetric response of 0.57 mg/L MSM on the HMDE, an Ei of −0.5 V was chosen for this study.
The optimum accumulation time, tacc of 1 to 250 sec was studied at Eacc=−0.5 V and Ei=−0.5 V for MSM. The peak current increased gradually up to tacc 30 sec and decreased after tacc 60 sec. An accumulation time of 30 sec was selected as the optimum time for stripping studies of MSM on an HMDE due to the maximum current signal, which may have occurred due to the maximum electrode surface coverage that transpired under these conditions. Fig. 4(c) depicts the interaction between the accumulation time and the peak current at the optimum accumulation potential and initial potential.
3. Influence of interfering ions on metsulfuron-methylThe interference studies on the analytical peak of MSM were examined by spiking the BR buffer (pH 2.0) with excess amounts of several metal ions such as Cu2+, Cd2+, Fe3+, Pb2+ and Zn2+, using the DPCSV technique under optimum conditions. The experiments were conducted separately for each metal and the concentrations of metal ions when spiked into the voltammetric cell were 0.1, 0.3, and 0.5 mg/L. The differential pulse voltammogram for MSM at the optimum condition is shown in Fig. 5.
It can be observed that no metal–pesticide interaction occurred as there were no significant changes in the initial peak current of MSM after the addition of metals (Cu2+, Cd2+, Fe3+, Pb2+, and Zn2+). Fig. 6(A) and (B) shows the interference study of Pb2+ with MSM, and it can be stated that Pb2+ did not interfere with MSM. The same results were observed with the other selected metal ions, as shown in Fig. 6(C)–(F). Theoretically, a new peak can be observed if any metal–MSM interactions occurred or if the initial peak current of MSM decreased or increased due to the formation of complex between metals and MSM. Hence, this interference study strongly suggests that none of the metals caused any significant interference in the MSM analysis.
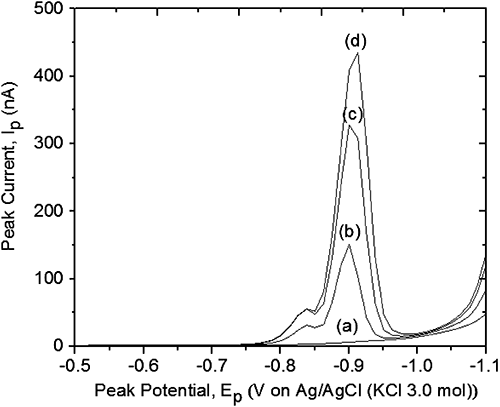
4. Analytical characteristics of metsulfuron-methyl using the DPCSV techniqueThe voltammogram in Fig. 7(A) shows the rise of a peak current along with the increasing concentration of MSM. The linear plot of the peak current versus the concentration of MSM is as illustrated in Fig. 7(B). A summary of the analytical calibration plot for MSM using the DPCSV technique is shown in Table 1. The correlation coefficient (R2) for MSM was found to be 0.996, which indicated a good correlation.
Table 1. Parameters of DPCSV calibration plot for MSM
| Sample | Calibration equation and R2 value | Linear range (mg/L) | Limit of detection (LOD), mg/L | Limit of quantitative (LOQ), mg/L |
|---|
| MSM | y=2×10⁻⁷x+2×10⁻⁸ | 0.10–0.76 | 0.04 | 0.13 |
| R2=0.996 |
The selectivity and applicability of the proposed electroanalytical method for the analysis of MSM were evaluated by determining its presence in Ally and in spiked water samples. The DPCSV technique was used for the quantitative determination of Ally. For this purpose, the standard addition method was used at the optimum condition of MSM in order to eliminate the matrix effect. In the present study, pH 2.0 of the BR buffer was chosen since this medium gave the highest cathodic peak with a maximal current. A cathodic peak was identified in this Ally studies using DPCSV technique as the active ingredient in the commercial pesticide was MSM. The accuracy of the pesticides was understood from the low relative standard deviation (RSD) values. Table 2 represents the recovery of MSM in Ally, where it was found to be around 88 to 93%, in which a very good repeatability was obtained (1.6%).
Table 2. Recovery values of MSM in ultra-pure water (spiked) and in commercial product, Ally at different level of concentrations
| Spiked conc. (mg/L) | Average peak current (nA) | Found conc. (mg/L) | Recovery (%) (±RSD%) |
|---|
| MSM | 0.38 | 87.3 | 0.37 | 97.0±1.1 |
| 0.57 | 123.0 | 0.56 | 99.0±4.6 |
| 0.67 | 137.0 | 0.64 | 97.0±1.1 |
| Ally | 0.27 | 66.8 | 0.26 | 90.0±1.6 |
| 0.38 | 81.0 | 0.34 | 88.0±1.3 |
| 0.67 | 132.0 | 0.62 | 93.0±0.7 |
Based on the data in Table 3, it could be deduced that the DPCSV technique can be successfully applied for the determination of MSM in water samples. The proposed method using an HMDE can determine the amount of MSM at lower concentration levels. Notably, the sensitivity of the HMDE in the pesticide analysis was also better in the practical process of analysis. Moreover, this method is simple and fast as compared to other voltammetric methods using modified electrodes.8,26,27)
Table 3. Recovery values for MSM in spiked water samples
| Samples | Drinking water dispenser sample | Tap water sample |
|---|
| Spiked conc. (mg/L) | Found conc. (mg/L) | Recovery values (±RSD%) | Spiked conc. (mg/L) | Found conc. (mg/L) | Recovery values (±RSD%) |
|---|
| MSM | 0.38 | 0.35 | 93.0±1.0 | 0.10 | 0.09 | 97.0±4.8 |
| 0.57 | 0.58 | 101.0±2.8 | 0.38 | 0.37 | 97.0±1.5 |
| 0.67 | 0.64 | 97.0±1.8 | 0.48 | 0.45 | 93.0±1.1 |
| Ally | 0.38 | 0.37 | 99.0±2.7 | 0.38 | 0.37 | 99.0±0.7 |
| 0.48 | 0.47 | 99.0±0.6 | 0.57 | 0.54 | 94.0±2.4 |
| 0.57 | 0.56 | 97.0±1.4 | 0.67 | 0.66 | 99.0±2.0 |
Conclusions
The pesticide MSM was successfully determined using DPCSV with an HMDE as the working electrode. The DPCSV technique is highly sensitive and, in this study, the voltammogram of MSM showed a well-defined single reduction peak, which reached its maximum peak height at pH 2.0. In this condition, the limit of determination of MSM was 0.04 mg/L. This technique can be effectively applied for the determination of MSM in Ally and water samples.
Acknowledgment
The authors wish to acknowledge Universiti Teknologi Malaysia (UTM) and the Ministry of Higher Education Malaysia for providing the LRGS grant (R. J30000. 7809. 4L810) on Water Security entitled Protection of Drinking Water: Source Abstraction and Treatment (203/ PKT/ 6720006) as financial support of this project. We are also grateful for the financial support given to Author from the UTM Zamalah scholarship.
References
- 1) J. Zolgharnein, A. Shahmoradi and J. Ghasemi: Clean: Soil, Air, Water 39, 1105–1119 (2011).
- 2) P. Parron, M. Requena, A. F. Hernandez and R. Alarcon: Toxicol. Lett. 230, 157–165 (2014).
- 3) K. Vorkamp, R. Bossi, K. Bester, U. E. Bollmann and S. Boutrup: Sci. Total Environ. 470–471, 459–468 (2014).
- 4) T. Ahmad, M. Rafatullah, A. Ghazali, O. Sulaiman, R. Hashim and A. Ahmad: J. Environ. Sci. Health C 28, 231–271 (2010).
- 5) M. J. Mohd Fuad, A. B. Junaidi, A. Habibah, J. Hamzah, M. E. Toriman, N. Lyndon, A. C. Er, S. Selvadurai and A. M. Azima: Adv. in Nat. Appl. Sci. 6, 65–70 (2012).
- 6) O. Oksel, N. Razali, M. K. Yusoff, M. Z. Ismail, K. F. Pa’ee and K. N. Ibrahim: Int. J. Eng. Technol. IJET-IJENS 9, 55–58 (2009).
- 7) C. C. Acebal, M. Grünhut, I. Šrámková, P. Chocholouš, A. G. Lista, H. Sklenářová, P. Solich and B. S. F. Band: Talanta 129, 233–240 (2014).
- 8) H. Li, C. Xie and X. Fu: Sens. Actuators B Chem. 181, 858–866 (2013).
- 9) M. C. Zabaloy, J. L. Garland and M. A. Góme: Appl. Soil Ecol. 40, 1–12 (2008).
- 10) V. H. Springer and A. G. Lista: Talanta 83, 126–129 (2010).
- 11) N. Song, D. Wang, Z. Shan and L. Shi: Procedia Environ. Sci. 18, 585–591 (2013).
- 12) Q. Zhou, W. Wang and J. Xiao: Anal. Chim. Acta 559, 200–206 (2006).
- 13) M. C. Hurtado-Sánchez, R. Romero-González, M. I. Rodríguez-Cáceres, I. Durán-Merás and A. Garrido Frenich: J. Chromatogr. A 1305, 193–202 (2013).
- 14) S. Seccia, S. Albrizio, P. Fidente and D. Montesano: J. Chromatogr. A 1218, 1253–1259 (2011).
- 15) Q. Wu, C. Wang, Z. Liu, C. Wu, X. Zeng, J. Wen and Z. Wang: J. Chromatogr. A 1216, 5504–5510 (2009).
- 16) I. Losito, A. Amorisco, T. Carbonara, S. Lofiego and F. Palmisano: Anal. Chim. Acta 575, 89–96 (2006).
- 17) C. Quesada-Molina, M. del Olmo-Iruela and A. M. García-Campańa: Anal. Bioanal. Chem. 397, 2593–2601 (2010).
- 18) L. Bandžuchová, R. Šelešovská, T. Navrátil and J. Chŷlková : Electrochim. Acta 113, 1–8 (2013).
- 19) H. L. Tcheumi, I. K. Tonle, E. Ngameni and A. Walcarius: Talanta 81, 972–979 (2010).
- 20) P. Manisankar, S. Viswanathan, A. M. Pusphalatha and C. Rani: Anal. Chim. Acta 528, 157–163 (2005).
- 21) A. Farahi, S. Lahrich, M. Achak, L. El Gaini, M. Bakasse and M. A. El Mhammedi: Anal. Chem. Res. 1, 16–21 (2014).
- 22) X. Ye, Y. Gu and C. Wang: Sens. Actuators B Chem. 173, 530–539 (2012).
- 23) C. Swarupa, M. S. P. M. Dhananjayulu and N. Y. Sreedhar: International Journal of Scientific and Engineering Research 4, 1234–1241 (2013).
- 24) H. El Harmoudi, M. Achak, A. Farahi, S. Lahrich, L. El Gaini, M. Abdennouri, A. Bouzidi, M. Bakasse and M. A. El Mhammedi: Talanta 115, 172–177 (2013).
- 25) P. Manisankar, G. Selvanathan and C. Vedhi: Talanta 68, 686–692 (2006).
- 26) L. L. C. Garcia: Sens. Actuators B Chem. 181, 306–311 (2013).
- 27) A. Farahi, M. Achak, L. El Gaini, M. A. El Mhammedi and M. Bakasse: J. Assoc. Arab Univ. Basic Appl. Sci 19, 37–43 (2016).