Abstract
The maturity date of soybean (Glycine max (L.) Merr.) is sensitive to photoperiod, which varies with latitude and growing seasons. The maturity group (MG) system, composed of 13 MGs, is a major approach in characterizing varieties’ ecological properties and adaptable areas. A total of 512 world soybean varieties, including 48 MG checks, were tested at a major site (Nanjing, 32.04°N) with portions tested in supplementary sites (Heihe, 50.22°N; Mudanjiang, 44.60°N; Jining, 35.38°N and Nanning, 22.84°N) in China to explore the worldwide MG distribution. The maturity date of the world soybean varied greatly (75–201 d) in Nanjing. Along with soybeans disseminated to new areas, the MGs further expanded during the last 70 years from MG I–VII to the early MG 0–000 in the north continents and to the late MG VIII–X in the south continents with the growth period structure differentiated into two subgroups in each MG 0–VIII except V. The cluster analysis among MGs and subgroups using genome-wide markers validated the MG sequential emergence order and the subgroup differentiation in eight MGs. For future evaluation, in addition to one major site (Nanjing), one supplementary southern site (Nanning) and one supplementary northern site (Heihe) are sufficient.
Introduction
Soybean (Glycine max (L.) Merr.) is an old crop in the eastern world but has been a new crop in the western world for the last two centuries. Soybean is rich in nutritional value due to its high protein and oil content as well as aspects of its functional composition, such as isoflavones. Along with its dissemination worldwide, soybean has adapted to diverse ecological conditions, especially to the local day length and temperature conditions created by geographic latitude and altitude. The most significant trait related to adaptation to diverse environments is growth period, or maturity date. Originally, soybean was a short-day crop with a sensitive response to photoperiod, as well as temperature. Because day length changes with the seasons, cropping season is another ecological factor determining the maturity date of soybean. The maturity date varies greatly among soybean varieties around the world, even within a same geographic region. Initially, farmers and early soybean scientists classified soybeans as early, medium and late maturity types. This classification was extensively used everywhere. However, it was insufficient at comparing varieties from different ecological regions. An early maturing variety in one region may be considered a late variety in another region.
Hartwig (1973) noted that the Regional Soybean Laboratory of the USDA established a maturity group (MG) classification system, the first suggestion of 7 MGs designated as MG I–VII was made by Carter, and the classification was based on the response to photoperiod or latitude (almost parallel to the latitude). Based on this grouping, earlier maturing varieties were developed in the northern USA, causing the maturity groups extended to MG 0 and MG 00, as well as further north in the USA and Canada to MG 000. With the expansion of soybean planting areas in the southern USA and lower latitudes of the Americas and in southern Asia and Africa, the MGs extended to MG VIII–X. Ultimately, 13 MGs, i.e. MG 000, 00, 0, I, ... X, were formed in the world. The difference in maturity date between two adjacent groups is approximately 10 to 15 days in an adapted area (Norman 1978).
Zhang et al. (2007) used ArcGIS to modify the geographic distribution of different soybean varieties’ MG types in the USA, according to the data from 139 state soybean variety trials conducted from 1998 to 2003. They found that the adapted regions for the early maturing varieties (MG 0–III) had not changed, but the adapted zones for MG IV–VI were much broader, MG VII and VIII were only in limited areas. Categorizing soybeans into different MGs allows for more accurate and quick judgment of the prospects for introducing new varieties and plays an important role in the breeding and production of soybeans in North America.
Many soybean scientists in different countries have adopted this MG system and have classified their local varieties into different MGs. Saito and Hashimoto (1980) indicated the soybeans in Japan involved with eight MGs (MG 0–VII) with their geographic distribution in Japan illustrated in details. Indian soybeans are strong short-day and late-maturing varieties and are mainly in MG VI–VIII due to their low latitude environment (between 10°N–33°N) (Tiwari et al. 1999). In Europe, the soybean varieties in Italy are mainly from MG 0 to MG II, and in France they are mainly from MG 000 to MG II (Rüdelsheim and Smets 2012). Monsanto was the first company to introduce the concept of maturity groups to Brazil (Penariol 2000). As an increasing number of private companies used the North American system, the traditional Brazilian method of classifying varieties into early, medium and late was gradually replaced with the MG system and was classified into MG VI–VIII. Because of its imports of large amount of the commercial USA soybean germplasm (Abdurakhmonov and Abdukarimov 2008), Argentina adopted the MG system earlier than Brazil and grouped varieties into MG II–VIII (Alliprandini et al. 2009).
In China, the traditional way of grouping soybeans was also early, medium and late, relative to a local area and even to the cropping system (Hao et al. 1992, Ren et al. 1987, Wang 1981). Gai et al. (2001) used the USA MG system to classify 256 Chinese soybean varieties into 12 MGs (MG 000–IX) by comparing their days from sowing to R8 (full maturity) with those of 48 MG checks introduced from North America. In addition, they found that the significant difference in flowering date was related to geographic locations and cropping systems in MG 0, I, II and III and divided each group into two subgroups according to the days to R1 (beginning bloom). Wu et al. (2012) defined the MGs of 19 varieties in the National Soybean Uniform Trials by comparing the days from VE (emergence) to R7 (first pod matured) with those of the 38 MG checks from North America. Jia et al. (2014) found that certain high-latitude cold region varieties matured much earlier than MG 000 based on the days from VE to R7. They proposed a new MG (MG 0000) for the varieties maturing much earlier than MG 000. It seemed that the early maturity group continued to increase as the soybean area expanded northward and new varieties developed. According to the trials at nine locations in Northeast China, Fu et al. (2016) proposed a MG grouping procedure (including the testing locations and grouping criteria) in Northeast China, using it the 361 northeast spring-planted soybean varieties were grouped into MG 000–III with their geographic distribution ascertained.
Fukui and Arai (1951) studied the ecological classification of soybean varieties in Japan based on the days from germination to blooming and from blooming to ripening with special reference to their geographical differentiation. They grouped soybean varieties into five vegetative stage groups and three reproductive stage groups in a total of nine combined groups. The growth period structure differentiation among varieties was also studied in China (Sun et al. 1990, Wang 2008). Gai et al. (2001) indicated that the performed growth periods and the MG types of the Chinese varieties were affected by the geographic location (latitude) and sowing season (caused by different cropping systems). They found that a different structure of growth periods existed within each group of MG 0–III and further divided them into two subgroups: one with a shorter vegetative period but a longer reproductive period, mainly in the northern spring-planted area, and another with a longer vegetative period but a shorter reproductive period, mainly in the spring-planted soybean of double cropping areas.
However, no study has been carried out to evaluate the variation of MG of the worldwide soybean varieties under a uniform environment, due to the extreme diversity of the sensitivity to day length and temperature. The present study aimed to reveal the variation of MGs of the world soybean varieties under a uniform environment (Nanjing, China in this study) and the distribution of MGs in world geographic regions. The first step was to establish a procedure to identify diverse MGs for a large number of varieties, i.e. to choose several major latitude sites for MG evaluation in the field. According to our previous experiences in identifying the MGs of Chinese soybeans (Gai et al. 2001), Nanjing was chosen as a major latitude site along with additional supplementary latitude sites scattered in the north and south of Nanjing for a normal maturity evaluation of the world-wide soybean varieties. In addition, with reference to the previous sub-division of MGs of Chinese varieties, the ratio of flowering date to maturity date (F/M) was also evaluated for the inspection of subgroups of world-wide soybeans. The knowledge of the world MG expansion and geographic distribution will benefit both the development of soybean varieties and the exploration of the evolutionary processes of growth period traits.
Materials and Methods
Plant materials
A total of 512 world soybean varieties was sampled from the Germplasm Storage of the National Center for Soybean Improvement (NCSI) of China. These varieties were introduced from Sweden, Russia, China, Japan, the USA and 22 other countries. According to the dissemination paths described by Singh and Hymowitz (1999), they were further divided into 13 geographic populations: Huang-Huai River Valleys in China (O-HCHN), Changjiang River Valleys and south of it in China (O-SCHN), Northeast China (A-NCHN), Far-East of Russia (A1-RUFE), southern Sweden (A2-SSWE), the Korean Peninsula (B-KORP), the Japan islands (B-JPAN), Southeast Asia (B1-SEAS), South Asia (B2-SASI), Africa (B3-AFRI), northern North America (C-NNAM), southern North America (C-SNAM) and Central and South America (C1-CSAM) (Supplemental Table 1). The meanings of the prefix “O”, “A”, “B” and “C” were explained in the notes of Table 5. Of these varieties, 48 varieties were MG checks for respective MGs (MG 000–X), among them, 41 were PIs (USDA code) with their MGs calibrated in the USA. The other 7 were from China, with their MGs calibrated in China by Gai et al. (2001).
Experimental design
The field experiments were set in five locations: the major site for testing all materials was in Nanjing (32.04°N) with Jining (35.38°N) as its supplementary site, the two additional supplementary sites for early MGs were in Heihe (50.22°N) and Mudanjiang (44.60°N), and the additional supplementary site for late MGs was in Nanning (22.84°N). Table 1 shows the entire experimental scheme with the MG checks arranged.
Table 1
The trial sites for maturity group (MG) classification of soybeans
| Trial site |
Geographic coordinate |
Year |
Maturity type (No. of varieties) |
Maturity group check |
| Latitude (°N) |
Longitude (°E) |
000 |
00 |
0 |
I |
II |
III |
IV |
V |
VI |
VII |
VIII |
IX |
X |
| Heihe |
50.22 |
127.53 |
2011 |
Early (40) |
✓ |
✓ |
✓ |
|
|
|
|
|
|
|
|
|
|
| 2012 |
Early (74) |
✓ |
✓ |
✓ |
|
|
|
|
|
|
|
|
|
|
| Mudanjiang |
44.60 |
129.58 |
2012 |
Early (172) |
✓ |
✓ |
✓ |
✓ |
✓ |
|
|
|
|
|
|
|
|
| Jining |
35.38 |
116.59 |
2011 |
All (504) |
✓ |
✓ |
✓ |
✓ |
✓ |
✓ |
✓ |
✓ |
✓ |
✓ |
✓ |
✓ |
✓ |
| 2012 |
All (505) |
✓ |
✓ |
✓ |
✓ |
✓ |
✓ |
✓ |
✓ |
✓ |
✓ |
✓ |
✓ |
✓ |
| Nanjing |
32.04 |
118.78 |
2011 |
All (504) |
✓ |
✓ |
✓ |
✓ |
✓ |
✓ |
✓ |
✓ |
✓ |
✓ |
✓ |
✓ |
✓ |
| 2012 |
All (505) |
✓ |
✓ |
✓ |
✓ |
✓ |
✓ |
✓ |
✓ |
✓ |
✓ |
✓ |
✓ |
✓ |
| 2013 |
Late (133) |
|
|
|
|
|
|
|
|
|
✓ |
✓ |
✓ |
✓ |
| Nanning |
22.84 |
108.33 |
2012 |
Late (65) |
|
|
|
|
|
|
|
|
|
✓ |
✓ |
✓ |
✓ |
In “Trail site” column, Heihe, and Mudanjiang are located in Heilongjiang province, China; Jining is located in Shandong province, China; Nanjing is located in Jiangsu province, China; and Nanning is located in Guanxi province, China.
The field tests at the major site of Nanjing and its supplementary site of Jining were conducted in two years. In 2011, the 504 varieties were sown on April 28 in Nanjing (Nanjing I) and on May 13 in Jining. Here, spring planting was used for testing the full season response of the materials rather than the local summer planting which is the regular double cropping system after winter wheat. In 2012, one additional earliest variety (Glycine max (L.) Merr. ‘Dengke 2’) was added. The 505 varieties were sown on April 25 in Nanjing (Nanjing I) and on May 15 in Jining.
An additional test for late MGs was conducted in Nanjing in 2013, in which 133 late varieties were sown approximately 10 days earlier than in 2011 and 2012. This was performed to make a clear distinction between adjacent MGs that included seven local MG checks for MG VII–IX (Nanjing II).
The field test at the supplementary site of Heihe was conducted in two years. In 2011, 40 early varieties (around MG 000–0) were sown on May 17, and in 2012, 74 early varieties were sown on May 13. Another additional supplementary test was conducted in Mudanjiang in 2012, in which 172 early varieties (around MG 000–II) were sown on May 12.
An additional supplementary test was conducted in Nanning, in which 65 late varieties were sown on July 12.
The soybeans were tested in single row plots, 1 m in length and 0.4 m apart, with 2 replications. After emergence, they were thinned to 6–8 seedlings.
Measurements and data analysis
The phenological stages of emergence (VE), beginning bloom (R1) and full maturity (R8) were recorded as Fehr and Caviness (1977) described. The flowering date and maturity date were calculated as the period from sowing to R1 and from sowing to R8, respectively. When some materials could not mature normally, the maturity date was estimated from the maturity date of MG VIII checks plus the difference in the flowering date between the MG VIII checks and the immature MG IX and X checks.
The maturity dates of the 48 MG checks were used as standards for identifying the MGs of each tested material at each site. The MG type of a variety was identified from the results in Nanjing with reference to those in Jining. This was mainly for MG II–IX, while the early MGs (MG 000–I) were determined from the results in Heihe with reference to those in Mudanjiang and Nanjing/Jining. The reference range/limits for each MG was determined as the threshold to classify MGs using the two averages, one between the involved and lower MG checks, another between the involved and upper MG checks, keeping the range within each MG to be approximately 10 to 15 days (Gai et al. 2001). In the case of MGs with ranges too small or too large in the major site of Nanjing/Jining, the MG of a variety would be determined according to the supplementary site criteria with ranges of 10–15 days.
The days to flowering (R1) and days to maturity (R8) were calculated, from which the ratio of R1 to R8 (F/M) was obtained. The frequency distribution of F/M values in each MG was observed, from which some MGs were found to have lowest frequency or valley(s) around the mid-point of a MG. Therefore, some MGs were separated into subgroups (first subgroup and second subgroup). To save space, the detailed procedure will be explained in the corresponding results section.
Genotyping and clustering analysis
For revealing the genetic relationship among the MGs, 371 of the 512 varieties were genotyped using RAD-seq (restriction-site-associated DNA sequencing). All the genotyping work was done at BGI Tech, Shenzhen, China. DNA was extracted from young leaves of one plant per variety according to the method of CTAB (Murray and Thompson 1980). The sequences of the 371 varieties were obtained by using Illumina HisSeq2000 instrument through MSG (multiplexed shotgun genotyping) method (Andolfatto et al. 2011), which read length (120.17 Gb of sequence) with an approximately × 4.08 depth and 4.64% coverage. Using SOAP2 (Li et al. 2009) with parameters that included sequences similarity, pair-end relationships and sequences quality, all sequence reads were aligned with the reference genome of Williams 82 (Schmutz et al. 2010). The SNPs of the population were identified by the RealSFS (Yi et al. 2010), and 98,482 SNPs were finally confirmed according to the criteria, from which the SNPs of 371 varieties were polymorphic with a rate of missing and heterozygous alleles calls ≤30% and minor allele frequencies ≥1%. The heterozygous loci were replaced by missing alleles, then filled by the software fastPHASE (Scheet and Stephens 2006). The 98,482 SNPs were divided into haplotype blocks (SNP linkage disequilibrium block) by the software Haploview (Barrett et al. 2005, Wall and Pritchard 2003) under linkage disequilibrium D’ > 0.7 criterion. Finally 20,701 SNPLDBs were identified.
Based on Nei’s (1983) genetic distances, a Neighbor-joining dendrogram was constructed for analyzing the relationships among different MGs as well as subgroups using PowerMarker version 3.25 (Liu and Muse 2005), then displayed by MEGA 4 (Tamura et al. 2007).
Results
Genetic diversity of the maturity date of the world soybean varieties
We found that when using the full season conditions in Nanjing, China (sown in early spring), all of the Chinese soybean varieties could mature naturally (Gai et al. 2001). That means to compare the maturity date of the world soybean varieties in a uniform environment in Nanjing, China (32.04°N) is possible. Therefore, the major site for evaluation of the worldwide soybean maturity date was set in Nanjing. Tables 2 and 3 show that under natural and full season conditions in Nanjing, all of the MGs except MG IX and X can mature naturally, while some MG IX varieties can mature under sowing 10 days earlier. The evaluation results in the Nanjing I environment indicated a very large variation in maturity date among the world soybeans, ranging from 75–201 d with an average of 124.2 d and a GCV of 25.5% (Table 2, Supplemental Table 2). Nanjing is better than Jining in its sensitivity for detecting maturity date differences (range between 73–181 d, an average of 126.4 d and a GCV of 19.7%). The frequency distribution of the world soybean maturity date in Nanjing comprised multiple peaks, this indicates that the population of world soybean varieties is a mixture of multiple subpopulations with the extremes as rare types (Table 2).
Table 2
The frequency distribution and descriptive statistics of the maturity date in world soybean varieties (including 48 MG checks)
| Trial site |
Class mid-value |
∑a |
Mean |
Range |
GCVb (%) |
h2c (%) |
| 73 |
82 |
91 |
100 |
109 |
118 |
127 |
136 |
145 |
154 |
163 |
172 |
181 |
190 |
199 |
208 |
217 |
| Nanjing I |
8 |
43 |
66 |
48 |
55 |
50 |
61 |
32 |
8 |
37 |
28 |
26 |
30 |
2 |
10 |
|
|
504 |
124.2 |
75–201 |
25.5 |
96.7 |
| Nanjing II |
|
|
|
|
|
|
|
|
2 |
10 |
5 |
26 |
22 |
33 |
24 |
1 |
10 |
133 |
185.0 |
143–221 |
10.0 |
93.7 |
| Jining |
4 |
27 |
38 |
49 |
35 |
70 |
85 |
55 |
27 |
31 |
52 |
21 |
10 |
|
|
|
|
504 |
126.4 |
73–181 |
19.7 |
96.1 |
| Heihe |
|
|
|
12 |
6 |
4 |
6 |
4 |
8 |
|
|
|
|
|
|
|
|
40 |
119.5 |
98–145 |
12.6 |
96.3 |
| Mudanjiang |
|
|
1 |
18 |
18 |
28 |
29 |
34 |
44 |
|
|
|
|
|
|
|
|
172 |
126.7 |
95–145 |
11.7 |
97.0 |
| Nanning |
|
|
12 |
53 |
|
|
|
|
|
|
|
|
|
|
|
|
|
65 |
97.3 |
92–101 |
2.4 |
96.5 |
b GCV: genotypic coefficient of variation.
c h2: heritability value.
The maturity dates in Nanjing I, Jining and Heihe were the average data of 2011 and 2012.
The maturity dates in Nanjing II were the 2013 data, and the maturity dates in Mudanjiang and Nanning were the 2012 data.
Table 3
The maturity date of the 48 MG checks at each trial site
| MGa |
MG check |
Nanjing I |
Nanjing II |
Jining |
Heihe |
Mudanb |
Nanning |
| 2011 |
2012 |
Mean |
2013 |
2011 |
2012 |
Mean |
2011 |
2012 |
Mean |
2012 |
2012 |
| 000 |
PI 548594 |
79 |
81 |
80 |
|
78 |
79 |
79 |
107 |
107 |
107 |
101 |
|
| PI 567787 |
80 |
78 |
79 |
|
78 |
85 |
82 |
111 |
110 |
111 |
102 |
|
| 00 |
PI 592523 |
84 |
83 |
84 |
|
84 |
91 |
88 |
121 |
121 |
121 |
109 |
|
| PI 295952 |
83 |
81 |
82 |
|
87 |
93 |
90 |
128 |
114 |
121 |
111 |
|
| PI 548648 |
77 |
78 |
78 |
|
84 |
77 |
81 |
113 |
121 |
117 |
105 |
|
| 0 |
PI 424242 |
86 |
93 |
90 |
|
87 |
87 |
87 |
139 |
142 |
141 |
120 |
|
| PI 607835 |
84 |
85 |
85 |
|
86 |
87 |
87 |
–c |
140 |
140 |
124 |
|
| PI 629004 |
93 |
81 |
87 |
|
84 |
89 |
87 |
129 |
140 |
135 |
119 |
|
| PI 596541 |
84 |
90 |
87 |
|
100 |
88 |
94 |
126 |
126 |
126 |
– |
|
| I |
PI 507717 |
102 |
95 |
99 |
|
108 |
90 |
99 |
|
|
|
128 |
|
| PI 608438 |
97 |
92 |
95 |
|
114 |
98 |
106 |
|
|
|
136 |
|
| PI 548641 |
90 |
88 |
89 |
|
101 |
96 |
99 |
|
|
|
129 |
|
| PI 614833 |
94 |
92 |
93 |
|
108 |
98 |
103 |
|
|
|
133 |
|
| II |
PI 595843 |
101 |
108 |
105 |
|
116 |
115 |
116 |
|
|
|
138 |
|
| PI 597383 |
104 |
108 |
106 |
|
123 |
120 |
122 |
|
|
|
145 |
|
| PI 602059 |
105 |
108 |
107 |
|
125 |
108 |
117 |
|
|
|
145 |
|
| PI 533655 |
103 |
112 |
108 |
|
122 |
119 |
121 |
|
|
|
145 |
|
| III |
PI 547873 |
123 |
125 |
124 |
|
130 |
122 |
126 |
|
|
|
|
|
| PI 597387 |
109 |
115 |
112 |
|
134 |
126 |
130 |
|
|
|
|
|
| PI 612932 |
111 |
129 |
120 |
|
126 |
122 |
124 |
|
|
|
|
|
| IV |
PI 598222 |
123 |
138 |
131 |
|
137 |
135 |
136 |
|
|
|
|
|
| PI 590932 |
131 |
135 |
133 |
|
142 |
129 |
136 |
|
|
|
|
|
| PI 606748 |
111 |
128 |
120 |
|
132 |
126 |
129 |
|
|
|
|
|
| V |
PI 613195 |
143 |
151 |
147 |
|
154 |
138 |
146 |
|
|
|
|
|
| PI 564849 |
127 |
142 |
135 |
|
144 |
137 |
141 |
|
|
|
|
|
| PI 561400 |
136 |
163 |
150 |
|
149 |
137 |
143 |
|
|
|
|
|
| VI |
PI 509104 |
145 |
163 |
154 |
|
154 |
157 |
156 |
|
|
|
|
|
| PI 614702 |
151 |
163 |
157 |
|
167 |
160 |
164 |
|
|
|
|
|
| PI 602597 |
154 |
167 |
161 |
|
155 |
163 |
159 |
|
|
|
|
|
| VII |
PI 595645 |
169 |
171 |
170 |
181 |
169 |
157 |
163 |
|
|
|
|
92 |
| PI 617041 |
166 |
171 |
169 |
184 |
170 |
158 |
164 |
|
|
|
|
93 |
| N03325.2 |
|
|
|
190 |
|
|
|
|
|
|
|
|
| N03328 |
|
|
|
191 |
|
|
|
|
|
|
|
|
| N09978 |
|
|
|
175 |
|
|
|
|
|
|
|
|
| VIII |
PI 133226 |
184 |
178 |
181 |
193 |
170 |
173 |
172 |
|
|
|
|
97 |
| PI 603953 |
174 |
178 |
176 |
200 |
172 |
161 |
167 |
|
|
|
|
93 |
| N04370.1 |
|
|
|
200 |
|
|
|
|
|
|
|
|
| N05661.1 |
|
|
|
193 |
|
|
|
|
|
|
|
|
| IX |
PI 323576 |
202 |
200 |
201 |
221 |
180 |
181 |
181 |
|
|
|
|
– |
| PI 209834 |
202 |
200 |
201 |
221 |
180 |
181 |
181 |
|
|
|
|
99 |
| N04869.2 |
|
|
|
206 |
|
|
|
|
|
|
|
|
| N04815 |
|
|
|
203 |
|
|
|
|
|
|
|
|
| X |
PI 483251 |
202 |
200 |
201 |
221 |
180 |
181 |
181 |
|
|
|
|
99 |
| PI 240664 |
202 |
200 |
201 |
221 |
180 |
181 |
181 |
|
|
|
|
99 |
| PI 495016 |
202 |
200 |
201 |
221 |
180 |
181 |
181 |
|
|
|
|
97 |
| PI 341262 |
202 |
200 |
201 |
221 |
180 |
181 |
181 |
|
|
|
|
100 |
| PI 205910 |
202 |
200 |
201 |
221 |
180 |
181 |
181 |
|
|
|
|
98 |
| PI 285096 |
202 |
200 |
201 |
221 |
180 |
181 |
181 |
|
|
|
|
97 |
In “MG check” column: “PI” represents the code of USDA Germplasm Collection, “N” represents the code of Nanjing Agricultural University.
The maturity dates in italics were estimated from the maturity dates of MG VIII checks plus the difference of the flowering dates between MG VIII checks and the immature MG IX and X checks.
Table 3 shows the maturity date of the MG checks at five trial sites. In the major site of Nanjing, the MG 000–VIII checks could normally mature, and the MG IX checks from China could normally mature too, but the MG IX and X checks from foreign countries did not mature normally, some reached R6 stage (full seed) (Fehr and Caviness 1977) at the first frost. In Jining, only the MG 000–VIII checks could normally mature. A similar trend was shown in the 13 MGs between those in Nanjing and Jining, with some early MGs (MG 000–IV) performing more days and some late MGs performing fewer days in Jining than in Nanjing. This might be because in the higher latitude of Jining (35.38°N), the temperature rose slower in spring and declined faster in autumn than in Nanjing even the day length was somewhat longer than in the lower latitude of Nanjing (32.04°N) during the growing season.
According to the data of MG checks in Table 3, the reference ranges or boundaries of each MG at each site were determined and listed in Table 4. If a 10–15 days range is required for a normal grouping, MG II–VII/VIII in Nanjing and MG I–V in Jining can be identified normally. The determination of early MGs (MG 000–0) should refer to the grouping in the supplementary sites of Heihe and Mudanjiang. The determination of late MGs (MG IX–X) should refer to the grouping in the supplementary site of Nanning. However, there was not a large enough range (10–15 d) for the distinction among MG VII–X. This is because of the delayed planting date (July 12). The reference ranges can be expected to expand to the required size if planted in spring. In any case, in the present study, we could classify varieties into MG 000–VIII but had to leave MG IX and X together as MG IX/X because the criteria in Nanning were yet to be determined.
Table 4
Performed the maturity date of the 48 MG checks at each trial site to be used for grouping the world varieties into MGs
| MGa |
Nanjing I |
Nanjing II |
Jining |
| Max |
Min |
Mean |
RRsb |
Max |
Min |
Mean |
RRs |
Max |
Min |
Mean |
RRs |
| 000 |
80 |
79 |
80 |
79–80 |
|
|
|
|
82 |
79 |
80 |
79–83 |
| 00 |
84 |
78 |
81 |
81–84 |
|
|
|
|
90 |
81 |
86 |
84–87 |
| 0 |
90 |
85 |
87 |
85–90 |
|
|
|
|
94 |
87 |
89 |
88–96 |
| I |
99 |
89 |
94 |
91–100 |
|
|
|
|
106 |
99 |
102 |
97–107 |
| II |
108 |
105 |
106 |
101–111 |
|
|
|
|
122 |
116 |
119 |
108–118 |
| III |
124 |
112 |
119 |
112–123 |
|
|
|
|
130 |
124 |
127 |
119–129 |
| IV |
133 |
120 |
128 |
124–136 |
|
|
|
|
136 |
129 |
134 |
130–140 |
| V |
150 |
135 |
144 |
137–150 |
|
|
|
|
146 |
141 |
143 |
141–151 |
| VI |
161 |
154 |
157 |
151–163 |
|
|
|
|
164 |
156 |
159 |
152–161 |
| VII |
170 |
169 |
169 |
164–174 |
191 |
175 |
184 |
175–190 |
164 |
163 |
164 |
162–166 |
| VIII |
181 |
176 |
179 |
175–181 |
200 |
193 |
197 |
191–201 |
172 |
167 |
169 |
167–172 |
| IX |
201 |
201 |
201 |
182–201 |
206 |
203 |
205 |
202–206 |
181 |
181 |
181 |
173–181 |
| X |
201 |
201 |
201 |
182–201 |
221 |
221 |
221 |
207–221 |
181 |
181 |
181 |
173–181 |
| MG |
Heihe |
Mudanjiang |
Nanning |
| Max |
Min |
Mean |
RRs |
Max |
Min |
Mean |
RRs |
Max |
Min |
Mean |
RRs |
| 000 |
111 |
107 |
109 |
101–112 |
102 |
101 |
102 |
101–105 |
|
|
|
|
| 00 |
121 |
117 |
120 |
113–126 |
111 |
105 |
108 |
106–114 |
|
|
|
|
| 0 |
141 |
126 |
135 |
127–141 |
124 |
119 |
121 |
115–126 |
|
|
|
|
| I |
|
|
|
|
136 |
128 |
132 |
127–137 |
|
|
|
|
| II |
|
|
|
|
145 |
138 |
143 |
138–145 |
|
|
|
|
| VII |
|
|
|
|
|
|
|
|
93 |
92 |
93 |
92–94 |
| VIII |
|
|
|
|
|
|
|
|
97 |
93 |
95 |
95–97 |
| IX |
|
|
|
|
|
|
|
|
99 |
99 |
99 |
98–100 |
| X |
|
|
|
|
|
|
|
|
100 |
97 |
98 |
98–100 |
The maturity dates of Nanjing I, Jining and Heihe were the average data of 2011 and 2012.
The maturity dates of Nanjing II were the 2013 data.
The maturity dates of Mudanjiang and Nanning were the 2012 data.
The maturity dates in italics were estimated from the maturity dates of MG VIII checks plus the difference of the flowering dates between MG VIII checks and the immature MG IX and X checks.
According to the grouping criteria in Table 4, the 464 world soybean varieties were first grouped according to the Nanjing I and Nanjing II criteria. Then, the early maturing varieties were further checked successively according to the criteria in Jining, Mudanjiang and Heihe. Some late-maturing varieties that could not be distinguished between MG IX or X were grouped into MG IX/X. Accordingly, the 464 varieties were classified into MG 000–IX/X and were listed in Supplemental Table 3. Among the 464 varieties along with the 48 MG checks in a total of 512 world soybean varieties, the major part was MG 0–IV, this part accounted for 8.6%, 11.7%, 12.7%, 17.8% and 13.1%, respectively, in a total 63.9% of the entire varieties (Table 5). The second major part was MG VI–VIII, accounted for 8.2%, 9.6% and 5.3%, respectively, in a total 23.1% of the entire varieties, while the earliest part, MG 000 and 00, accounted for only 5.5% and 1.4%, respectively, in a total of 6.9% and the latest part, MG IX/X, accounted for only 2.3% (Table 5). This result implied that the major part of the world soybean varieties was in MG 0–IV, or geographically in northern East Asia and northern North America, while modern varieties tended to the early and late MGs along with the soybean expanded northward and southward.
Table 5
MG types of 512 world soybean varieties distributed in 13 geographic populations (including 48 MG checks)
| MG a |
O-HCHN b |
O-SCHN |
A-NCHN |
A1-RUFE |
A2-SSWE |
B-KORP |
B-JPAN |
B1-SEAS |
B2-SASI |
B3-AFRI |
C-NNAM |
C-SNAM |
C1-CSAM |
All (%) |
| 000 |
|
|
9 |
|
17 |
|
|
|
|
|
2 |
|
|
28 (5.5) |
| 00 |
|
|
4 |
1 |
|
|
|
|
|
|
2 |
|
|
7 (1.4) |
| 0 |
|
|
28 |
4 |
|
1 |
3 |
|
|
|
8 |
|
|
44 (8.6) |
| I |
3 |
|
38 |
5 |
|
2 |
4 |
|
|
|
8 |
|
|
60 (11.7) |
| II |
14 |
8 |
22 |
4 |
|
2 |
3 |
|
|
|
12 |
|
|
65 (12.7) |
| III |
41 |
2 |
15 |
4 |
|
2 |
2 |
1 |
|
|
24 |
|
|
91 (17.8) |
| IV |
28 |
7 |
2 |
1 |
|
6 |
8 |
2 |
|
|
12 |
1 |
|
67 (13.1) |
| V |
|
1 |
|
|
|
1 |
6 |
|
|
1 |
|
10 |
1 |
20 (3.9) |
| VI |
|
9 |
|
|
|
3 |
2 |
|
2 |
|
1 |
8 |
17 |
42 (8.2) |
| VII |
|
10 |
|
|
|
2 |
6 |
9 |
7 |
2 |
1 |
8 |
4 |
49 (9.6) |
| VIII |
|
6 |
|
|
|
|
|
11 |
3 |
2 |
|
4 |
1 |
27 (5.3) |
| IX/X |
|
2 |
|
|
|
|
|
3 |
3 |
2 |
|
|
2 |
12 (2.3) |
| Total |
86 |
45 |
118 |
19 |
17 |
19 |
34 |
26 |
15 |
7 |
70 |
31 |
25 |
512 |
b O represents the center of origin in both Huang-Huai River Valleys (HCHN) and Changjiang River Valleys and its south (SCHN); A and B represent the two secondary centers moved from the center of origin, the former to Northeast China (NCHN), the latter to Korea Peninsular (KORP) and Japan islands (JPAN); C represents the third center moved from O, A and B to northern North America (NNAM) and southern North America (SNAM); A1, A2, B1, B2, B3 and C1 represent the derived centers from A, B and C, i.e. Far-East of Russia (RUFE), southern Sweden (SSWE, it should be a sample from Europe, but we had to use southern Sweden due to the limited European varieties in our collection), Southeast Asia (SEAS), South Asia (SASI), Africa (AFRI), and Central and South America (CSAM).
In “All” column, the number in parenthesis was the percent of each MG varieties in the total 512 varieties.
Table 5 and Fig. 1 show the distribution of world soybean MGs in different geographic populations. In the center of the origin in China, the varieties in the Huang-Huai River Valleys (O-HCHN) covered MG I–IV due to the relatively simple cropping systems, usually summer-sowing soybean in the soybean-wheat double cropping system and a few spring-sowing soybeans. On the other hand, for those in the Changjiang River Valleys and south of it (O-SCHN), the varieties covered a wider MG range (from MG II to MG IX/X) due to the complicated cropping systems involving spring-sowing soybean, summer-sowing soybean and autumn-sowing soybean.
After soybeans were disseminated northward, the early MG varieties (MG 0–000) were developed in Northeast China (A-NCHN), thus covering a wide range of MGs (from MG 000 to MG IV). Similar MGs were in the neighboring area of Far-East of Russia (A1-RUFE). However, in southern Sweden (A2-SSWE), the varieties were mainly in MG 000.
Soybeans were disseminated very early to eastern Asian countries, especially to the Korea peninsula (B-KORP) and Japan islands (B-JPAN). The varieties covered a wide range of MGs, from MG 0 to MG VII. It is very interesting that in this small area the varieties clearly differed in MGs. This might be due to the multiple cropping systems as well as the warm weather in sea and ocean environments.
Soybeans were disseminated southward and southwestward to Southeast Asia (B1-SEAS), South Asia (B2-SASI) and Africa (B3-AFRI). The varieties in Southeast Asia covered some relatively early MGs (MG III–IV), but mainly the late ones of MG VII–IX/X. There were only late MGs (MG V–IX/X) in South Asia and Africa.
A tremendous improvement in soybean occurred in the Americas after it was disseminated to the USA. The latitude of northern North America (C-NNAM) approximates that of the Huang-Huai River Valleys (O-HCHN) in China, but its MGs covered a wider spectrum, from MG 000 to MG VII. This might be due to that the USDA widely introduced soybean germplasm from all over the world and left some late MGs grown in this region. The latitude of southern North America (C-SNAM) is also similar to that of the Changjiang River Valleys and south of it (O-SCHN) in China, but its MGs only covered from MG IV to MG VIII, this was less than those in O-SCHN because of the simple cropping system (full season soybean) in C-SNAM. After soybeans disseminated from the USA southward to Central and South America (C1-CSAM), both the introduced and derived varieties expanded very fast. The varieties covered MG V–IX/X, which was very similar to that in C-SNAM.
In summary, the soybean maturity groups comprised only MG I–VII, seven groups in the 1940s, but 70 years later, this has been extended to 13 MGs. Soybean has also been disseminated throughout the whole world and has been genetically improved for adaptation to various latitudes. More MGs are expected to be possible in areas of high and low latitudes.
Growth period structure differentiation and subgrouping MGs of the world soybean varieties
Gai et al. (2001) distinguished each of the MG 0–III into two subgroups using the relative vegetative and reproductive growth lengths in Nanjing, China. In the present study, we also found that a similar phenomenon existed among the world soybeans using the F/M value (growth period structure). In the world soybean population, the ratio of F/M varied from 0.27–0.65 in Nanjing and from 0.24–0.66 in Jining (Supplemental Table 4). For individual MGs, the MG 000 and 00 varieties showed less variation in F/M in all testing sites. The MG 0, I and II varieties showed more diversity in F/M in Mudanjiang, and the MG II–IV and VI–IX/X varieties showed even more diversity in F/M in Nanjing and Jining (Supplemental Table 5). Only the early MGs (MG 000–II) were comparable for their F/M values among the different latitude locations since the varieties from southern latitudes could not mature naturally in northern latitudes. Here the early MG varieties had their F/M mean values and ranges in higher latitude (Heihe, Mudanjiang) larger than those in lower latitude (Nanjing). In addition, the worldwide variation of flowering date (Supplemental Table 6) showed a similar trend as F/M, flowering date (F) is a sensitive part to the geographic conditions in the constitution of maturity date (M).
The F/M frequency distribution in some MGs showed some valley(s), indicating different subgroups existing in a MG. For a comparable subgrouping, we used the F/M data set mainly from Nanjing supplemented with those of the early MGs from northern latitude. That means the F/M date set of 2012 in Mudanjiang were used in the MG 0–I subgrouping, the data set of the F/M averaging over 2011 and 2012 in Nanjing I were used in the MG II–IV and MG VI subgrouping, and the F/M data set of 2013 in Nanjing II was used in the MG VII–VIII subgrouping. The MG IX/X was not sub-grouped due to the inadequate data for these two MGs. It was interesting that the F/M value of MG V varieties did not show large variation as the others did. Obviously, the growth period structure (F/M) varied greatly in each of the 8 MGs: i.e., 0.37–0.58 (MG 0), 0.38–0.55 (MG I), 0.32–0.50 (MG II), 0.29–0.53 (MG III), 0.27–0.52 (MG IV), 0.31–0.56 (MG VI), 0.27–0.60 (MG VII) and 0.33–0.67 (MG VIII), except MG V (0.31–0.43). Accordingly, each of the MG 0–IV and VI–VIII were separated into two subgroups with the subgroup boundaries listed in Table 6. The boundaries between the two subgroups in a MG were determined from the lowest frequency point in a MG with reference to the corresponding MG mid-value. The breaking value between the first subgroup and second subgroup in the MGs varied slightly, the two extreme MGs (MG 0 and VIII) were 0.50 and the others were between 0.40–0.50 (Table 6). Based on the criteria, all varieties in MG 0–IV and VI–VIII were checked and placed into subgroups (Supplemental Table 3, Table 7).
Table 6
The boundaries of MG subgroups of the world soybean varieties
| F/Ma limit |
01 |
02 |
I1 |
I2 |
II1 |
II2 |
III1 |
III2 |
IV1 |
IV2 |
VI1 |
VI2 |
VII1 |
VII2 |
VIII1 |
VIII2 |
| Lower limit |
0.37 |
0.50 |
0.38 |
0.49 |
0.32 |
0.45 |
0.29 |
0.43 |
0.27 |
0.43 |
0.31 |
0.40 |
0.27 |
0.42 |
0.33 |
0.50 |
| Upper limit |
0.50 |
0.58 |
0.49 |
0.55 |
0.45 |
0.50 |
0.43 |
0.53 |
0.43 |
0.52 |
0.40 |
0.56 |
0.42 |
0.60 |
0.50 |
0.67 |
a F/M: the ratio of flowering date to maturity date.
The data of MG 01–I2 were from 2012 in Mudanjiang, the data of MG II1–VI2 were the average data of 2011 and 2012 in Nanjing I, and the data of MG VII1–VIII2 were from 2013 in Nanjing II.
The upper limit of the first subgroup was equal to the lower limit of the second subgroup in each MG because of the continuity of the trait. When a variety’s F/M value was equal to the first subgroup upper limit, this variety was classified into the second subgroup.
Table 7
Subgroups of MGs of world soybean varieties distributed in 13 geographic populations
| MG a |
O-HCHN b |
O-SCHN |
A-NCHN |
A1-RUFE |
A2-SSWE |
B-KORP |
B-JPAN |
B1-SEAS |
B2-SASI |
B3-AFRI |
C-NNAM |
C-SNAM |
C1-CSAM |
All |
| 01 |
|
|
28 |
4 |
|
|
1 |
|
|
|
6 |
|
|
39 |
| 02 |
|
|
|
|
|
1 |
2 |
|
|
|
2 |
|
|
5 |
| I1 |
2 |
|
38 |
5 |
|
1 |
1 |
|
|
|
8 |
|
|
55 |
| I2 |
1 |
|
|
|
|
1 |
3 |
|
|
|
|
|
|
5 |
| II1 |
12 |
3 |
22 |
4 |
|
2 |
2 |
|
|
|
12 |
|
|
57 |
| II2 |
2 |
5 |
|
|
|
|
1 |
|
|
|
|
|
|
8 |
| III1 |
36 |
|
15 |
4 |
|
2 |
2 |
1 |
|
|
24 |
|
|
84 |
| III2 |
5 |
2 |
|
|
|
|
|
|
|
|
|
|
|
7 |
| IV1 |
25 |
6 |
2 |
1 |
|
5 |
7 |
|
|
|
12 |
1 |
|
59 |
| IV2 |
3 |
1 |
|
|
|
1 |
1 |
2 |
|
|
|
|
|
8 |
| VI1 |
|
3 |
|
|
|
3 |
2 |
|
2 |
|
1 |
5 |
|
16 |
| VI2 |
|
6 |
|
|
|
|
|
|
|
|
|
3 |
17 |
26 |
| VII1 |
|
5 |
|
|
|
2 |
5 |
2 |
4 |
|
1 |
8 |
4 |
31 |
| VII2 |
|
5 |
|
|
|
|
1 |
7 |
3 |
2 |
|
|
|
18 |
| VIII1 |
|
2 |
|
|
|
|
|
1 |
|
|
|
4 |
1 |
8 |
| VIII2 |
|
4 |
|
|
|
|
|
10 |
3 |
2 |
|
|
|
19 |
| Total |
86 |
42 |
105 |
18 |
0 |
18 |
28 |
23 |
12 |
4 |
66 |
21 |
22 |
445 |
b O represents the center of origin in both Huang-Huai River Valleys (HCHN) and Changjiang River Valleys and its south (SCHN); A and B represent the two secondary centers moved from the center of origin, the former to Northeast China (NCHN), the latter to Korea Peninsular (KORP) and Japan islands (JPAN); C represents the third center moved from O, A and B to northern North America (NNAM) and southern North America (SNAM); A1, A2, B1, B2, B3 and C1 represent the derived centers from A, B and C, i.e. Far-East of Russia (RUFE), southern Sweden (SSWE, it should be a sample from Europe, but we had to use southern Sweden due to the limited European varieties in our collection), Southeast Asia (SEAS), South Asia (SASI), Africa (AFRI), and Central and South America (CSAM).
Table 7 shows that in the center of the origin in China, all 4 MGs in O-HCHN and each of the 6 MGs in O-SCHN involved two subgroups except only MG III2 (without MG III1) involved in the O-SCHN region. However, only the first subgroup rather than the second subgroup in the 5 MGs (MG 0–IV) was involved in the northern regions (A-NCHN, A1-RUFE), while no subgroup differentiation was observed in A2-SSWE. In B-KORP and B-JPAN, 2 and 5 of the 7 MGs (MG 0–IV, VI–VII) involved subgroup differentiation, respectively. In the southern regions (B1-SEAS, B2-SASI and B3-AFRI), MG VII and VIII involving subgroup differentiation are dominated by the second subgroup. It was interesting that all the 6 MGs (MG I–IV, VI–VII) except MG 0 in northern North America (C-NNAM) involved only the first subgroup. This was quite different from the case in O-HCHN, which might be due to lack of a double cropping system in C-NNAM previously. A similar situation was observed in southern North America as well as in Central and South America (C-SNAM and C1-CSAM), only the first subgroup was involved in MG VII–VIII, while the second group was involved mainly in MG VI.
Genetic relationship among the world MGs and the subgroups
The genetic relationship among the MGs of the world cultivated soybeans (Glycine max (L.) Merr.) was studied using clustering analysis based on 20,701 SNPLDB markers obtained from genome-wide 98,482 SNPs in 371 varieties. In the Neighbor-joining dendrogram (Fig. 2A), at the genetic distance of 0.001, the 12 MGs were grouped into three clusters. The first cluster (Cluster i), comprising MG V and MG VI, was the base of the three clusters. Its nearest cluster (Cluster ii) comprised MG IV up to MG 000 successively. The distant cluster (Cluster iii) comprised MG VII up to MG VIII and MG IX/X successively. This results indicated that among the 12 MGs, MG V and MG VI (Cluster i) was the base maturity groups in Glycine max (L.) Merr., between them MG VI was the relatively original one, from which early maturity groups (Cluster ii) formed and later on late maturity groups (Cluster iii) formed. It is very interesting that the evolutionary relationship is strictly in a sequential order based on the genome-wide markers.
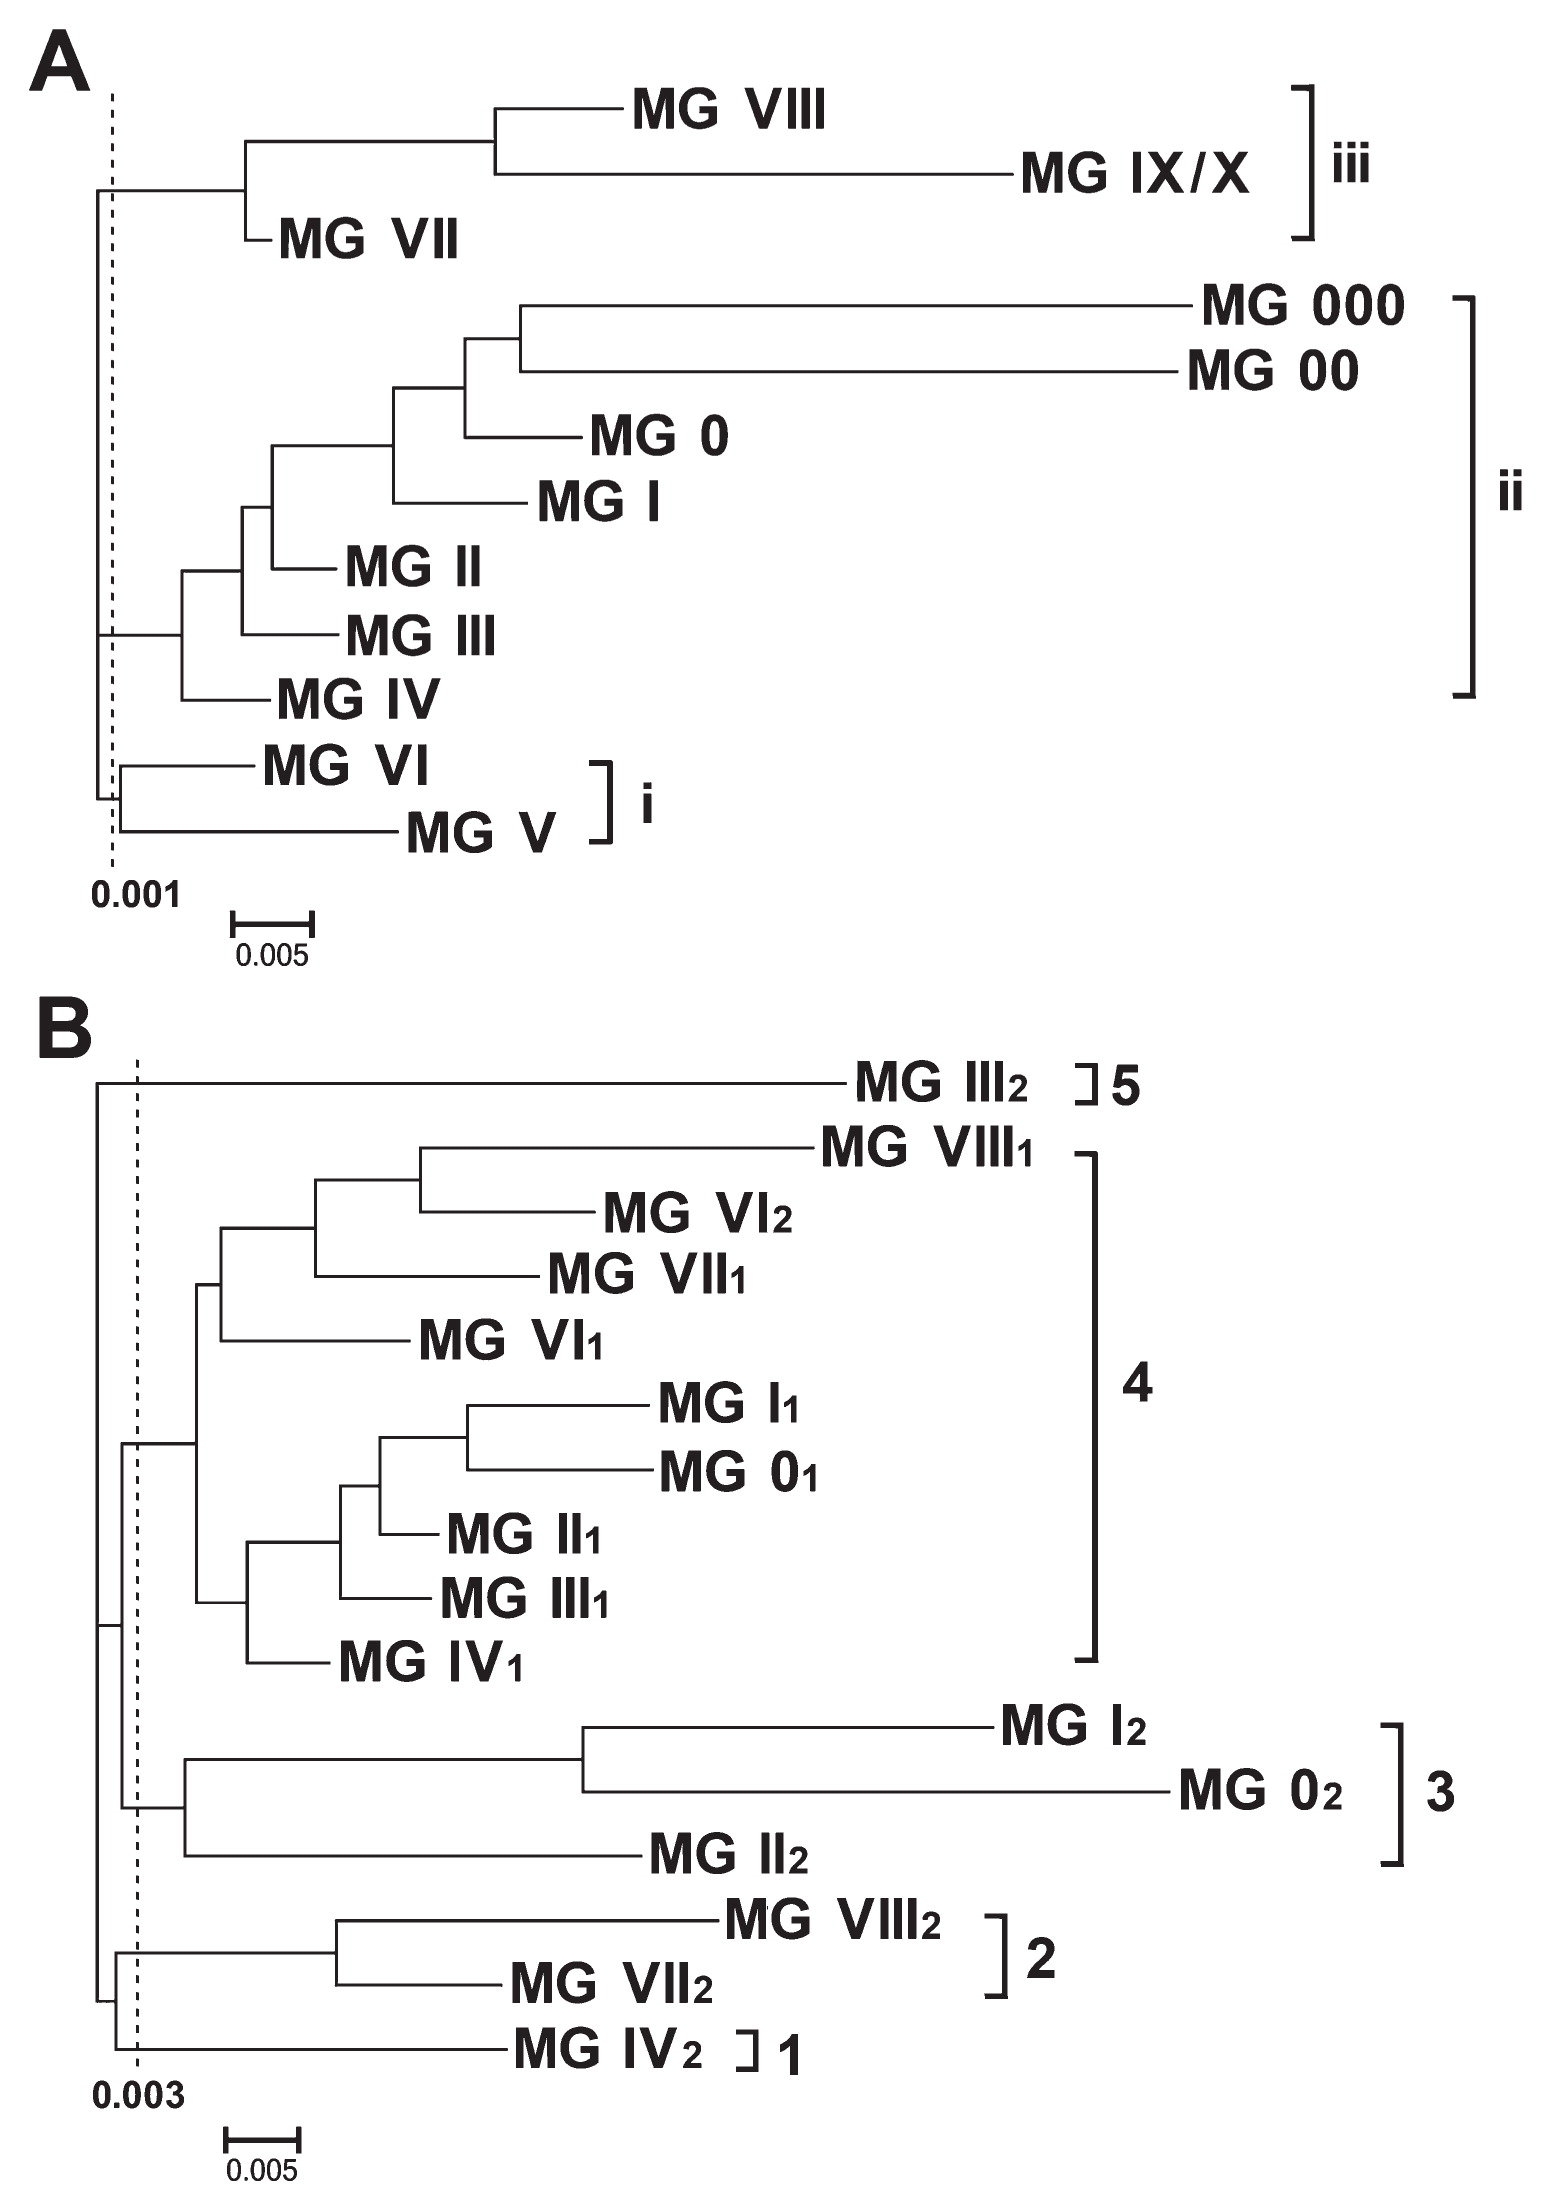
Fig. 2B shows that the 16 subgroups in MG 0–IV and MG VI–VIII (315 varieties) were grouped into five clusters at the genetic distance of 0.003. Among the five clusters, Cluster 1, 2, 3 and 5 were all the second subgroups (larger F/M value) while Cluster 4 were all the first subgroups (smaller F/M value) with only one exception of MG VI2. The first subgroups concentrated in one cluster and the second subgroups scattered in several clusters indicated that genetically all the first subgroups were close to each other and all the second subgroups were distinct from each other but more distinction appeared between the first and the second subgroups. Therefore, the two subgroups in a MG must have their own specific properties, respectively. The subgrouping is concrete and meaningful, in which the mechanism is to be further studied.
Discussion
Measurement of maturity date and MG classifying strategy
Two different approaches exist in the literature regarding the measurement of the maturity date, one is the days from sowing to R8 (Gai et al. 2001), and another is the days from VE to R7 (Jia et al. 2014, Wu et al. 2012). There are two reasons to use the former approach. First, a plant initiates activity by absorbing water and moisture right after sowing in the soil. Second, R7 is the date that one normal pod at any node on the main stem reaches its mature pod color (brown or tan). In fact, at this time, the plant has not fully matured, and there are still an average of nine days to reach R8 (full maturity), although this differs from variety to variety.
In the present study, 148 of the 464 tested varieties were from the USA, and their MG was recorded (http://www.ars-grin.gov/npgs/acc/acc_queries.html). Another 25 varieties were also studied for their MGs (Gai et al. 2001, Jia et al. 2014, Wu et al. 2012). Among the 173 varieties evaluated in this study, 128 were completely consistent with the previous results, while the remaining 45 varieties showed roughly one group difference from the previous record, which might be due to environmental differences. Accordingly, the days from sowing to R8 should be a reasonable and accurate measurement of maturity date.
In classifying soybean varieties into respective MGs, the usual method is to compare the maturity date of the tested material with some possible checks at several locations, from which the best location results are chosen. For a large number of varieties to be classified, it is better to design a testing system to be used consistently. In this study, with reference to Gai et al. (2001), a major site near 32°N latitude such as Nanjing, a supplementary northern site near 50°N such as Heihe, and a supplementary southern site near 23°N such as Nanning enabled the evaluation of many types of maturity groups in China, as well as for soybeans worldwide. The study site may be adjustable within ±1–2°N.
Classification of MG subgroups
The maturity subgrouping of soybean was proposed by Gai et al. (2001) when they studied the maturity groups of Chinese landraces. The MG 0–III varieties were distributed in a large region, including the north and south of Qinling Mountain-Huai River in China. According to geographic distribution of the variation in flowering date in a same MG, the MG 0–III varieties from the north of Qinling Mountain-Huai River with relatively shorter flowering date were divided into 01, I1, II1 and III1; those from south of this area which had relatively longer flowering date were divided into 02, I2, II2 and III2 (Gai et al. 2001). It is known that the subgroup differentiation in MG 0–III in China is mainly due to the soybeans growing in different seasons, a full season (sowing in spring) in the north and a short season (sowing in summer) in the south.
In this study, we found that in addition to the previous 4 MGs (MG 0–III), the later 4 MGs (MG IV and VI–VIII) could also be divided into subgroups according to the structure of growth periods (F/M) with the results also demonstrated by the genetic clustering analysis. Very similar with the previous 4 MGs, the growth period structures (F/M) of the later 4 MGs were obviously different among geographic populations (Table 7), the first subgroups were mostly from higher latitudes, but the second subgroups were mostly from lower latitudes. The photoperiod is different among geographic regions, of course, it its accompanied with temperature differences. The previous day length studies have demonstrated that long day length made the flowering date delayed, therefore influenced the F/M values (Cheng et al. 2011, Wang et al. 2015). Accordingly, the subgroup differentiation in the eight MGs (MG 0–IV, VI–VIII) follows a similar mechanism and is likely due to the photoperiod accompanied with temperature differences among the geographic regions, as well as different cropping systems, multiple cropping in eastern Asia but single cropping in the southern South Americas for the later MGs. Anyway, more detailed mechanism merits further exploration.
Evolutionary relationship among the MGs and a possible new earliest MG
From Fig. 2A, the genetic relationship among the MGs implied that the early emerged maturity groups of the cultivated soybean (G. max) might be MG VI and MG V (Cluster i, mainly in southern latitudes, such as Changjiang valleys and south of it in China), rather than MG II, MG III and MG IV (Cluster ii, mainly in northern latitudes, such as Huang-Huai valleys in China). This coincides with the southern origin hypothesis of the cultivated soybean (O-SCHN), which was concluded from the results of all the cultivated soybeans having their genetic distances shortest with the annual wild soybean population from Changjiang valleys and south of it in China (Gai et al. 2000, Wen et al. 2009, Zhao and Gai 2004).
Fig. 2A also shows that the earliest and the latest MGs were most evolutionary ones. In Heilongjiang, China, the earliest varieties were Mancangjin, Muckden, Zihua 4, etc. (introduced to the USA in early years of the last century) which were classified into MG I in our recent study (Fu et al. 2016). But now MG 0–000 varieties were developed due to the breeding effort for extending cultivation areas northward during the late half of the last century. Even further early varieties are coming out.
In the experiment in Heihe, we found that ‘Dengke 2’ (N27419), ‘Hujiao 07-2479’ (N27298) and ‘Hujiao 07-2123’ (N27299) matured 7–13 days earlier than ‘Maple Presto’ and ‘OAC Vision’ (MG 000 checks) (Table 8). Jia et al. (2014) reported that ‘Hujiao 07-2479’ and ‘Hujiao 07-2123’ obviously matured earlier than the checks and suggested classifying them into a new group as MG 0000. We believe these varieties are much earlier than the checks used, but whether a new MG should be defined for the two varieties requires further study because only a few MG 000 checks were used in this study. However, earlier MG soybean is a potential breeding trend to increase the acreage in northern Heilongjiang, China, as well as in the northern part of Asia, Europe and North America.
Table 8
Maturity date of extremely early matured varieties in Heihe
| Name of varieties |
Heihe |
| 2011 |
2012 |
Mean |
| Maple Presto (PI 548594) |
107 |
107 |
107 |
| OAC Vision (PI 567787) |
111 |
110 |
111 |
| Dengke 2 (N27419) |
–a |
98 |
98 |
| Hujiao 07-2479 (N27298) |
100 |
99 |
100 |
| Hujiao 07-2123 (N27299) |
100 |
96 |
98 |
a –: In 2011, ‘Dengke 2’ was not planted in Heihe.
Acknowledgments
This work was financially supported by the China National Key Basic Research Program (2011CB1093), the China National High-tech R&D Program (2012AA101106), the Natural Science Foundation of China (31571695), the MOE 111 Project (B08025), the MOE Program for Changjiang Scholars and Innovative Research Team in University (PCSIRT13073), the MOA CARS-04 program, the Jiangsu Higher Education PAPD Program, the Fundamental Research Funds for the Central Universities, and the Jiangsu JCIC-MCP. We thank Prof. Tianfu Han from the Institute of Crop Science, the Chinese Academy of Agricultural Sciences, and Prof. Wanhai Zhang from the Hulunbeier Academy of Agricultural Sciences, who kindly provided the maturity checks and the extra-early materials, respectively, used in this study.
Literature Cited
- Abdurakhmonov, I.Y. and A. Abdukarimov (2008) Application of association mapping to understanding the genetic diversity of plant germplasm resources. Int. J. Plant Genomics 2008: 574927.
- Alliprandini, L.F., C. Abatti, P.F. Bertagnolli, J.E. Cavassim, H.L. Gabe, A. Kurek, M.N. Matsumoto, M.A.R. de Oliveira, C. Pitol and L.C. Prado (2009) Understanding soybean maturity groups in Brazil: environment, cultivar classification, and stability. Crop Sci. 49: 801–808.
- Andolfatto, P., D. Davison, D. Erezyilmaz, T.T. Hu, J. Mast, T. Sunayama-Morita and D.L. Stern (2011) Multiplexed shotgun genotyping for rapid and efficient genetic mapping. Genome Res. 21: 610–617.
- Barrett, J.C., B. Fry, J. Maller and M.J. Daly (2005) Haploview: analysis and visualization of LD and haplotype maps. Bioinformatics 21: 263–265.
- Cheng, L., Y. Wang, C. Zhang, C. Wu, J. Xu, H. Zhu, J. Leng, Y. Bai, R. Guan, W. Hou et al. (2011) Genetic analysis and QTL detection of reproductive period and post-flowering photoperiod responses in soybean. Theor. Appl. Genet. 123: 421–429.
- Fehr, W.R. and C.E. Caviness (1977) Stages of soybean development. Special Report, Agriculture and Home Economic Experiment Station, Iowa State University.
- Fu, M.M., Y.P. Wang, H.X. Ren, D.L. Wang, R.J. Bao, X.Y. Yang, Z.Y. Tian, J.J. Cao, L.S. Fu, Y.X. Cheng et al. (2016) A study on criterion, identification and distribution of maturity groups for spring-sowing soybeans in Northeast Chian. Soybean Sci. 35: 181–192.
- Fukui, J. and M. Arai (1951) Ecological studies on Japanese soy-bean varieties. I. Classification of soy-bean varieties on the basis of the days from germination to blooming and from blooming to ripening with special reference to their geographical differentiation. Japan. J. Breed. 1: 27–39.
- Gai, J., D. Xu, Z. Gao, Y. Shimamoto, J. Abe, H. Fukushi and S. Kitajima (2000) Studies on the evolutionary relationship among eco-types of G. max and G. soja in China. Acta Agron. Sin. 26: 513–520.
- Gai, J.Y., Y.S. Wang, M.C. Zhang, J.A. Wang and R.Z. Chang (2001) Studies on the classification of maturity groups of soybeans in China. Acta Agron. Sin. 27: 286–292.
- Hao, G., X.J. Chen and M.H. Pu (1992) Classification of the Chinese soybean cultivars into maturity groups. Acta Agron. Sin. 18: 275–281.
- Hartwig, E.E. (1973) Varietal development. In: Caldwel, B.E. (ed.) Soybeans: Improvement, production, and uses. Agron. J. 16: 187–207.
- Jia, H.C., B.J. Jiang, C.X. Wu, W.C. Lu, W.S. Hou, S. Sun, H.R. Yan and T.F. Han (2014) Maturity group classification and maturity locus genotyping of early-maturing soybean varieties from high-latitude cold regions. PLoS ONE 9: e94139.
- Li, R., C. Yu, Y. Li, T.W. Lam, S.M. Yiu, K. Kristiansen and J. Wang (2009) SOAP2: an improved ultrafast tool for short read alignment. Bioinformatics 25: 1966–1967.
- Liu, K. and S.V. Muse (2005) PowerMarker: an integrated analysis environment for genetic marker analysis. Bioinformatics 21: 2128–2129.
- Murray, M.G. and W.F. Thompson (1980) Rapid isolation of high molecular weight plant DNA. Nucleic Acids Res. 8: 4321–4325.
- Norman, A.G. (1978) Soybean physiology, agronomy, and utilization. Academic Press, New York, p. 249.
- Penariol, A. (2000) Soja: Cultivares no lugar certo. Informações Agronômicas 90: 13–14.
- Ren, Q.X., J.Y. Gai and Y.H. Ma (1987) Study on the ecological properties of the growth periods of the Chinese soybean varieties. Acta Agron. Sin. 20: 23–28.
- Rüdelsheim, P.L.J. and G. Smets (2012) Baseline information on agricultural practices in the EU Soybean (Glycine max (L.) Merr.). Perseus BVBA 42.
- Saito, M. and K. Hashimoto (1980) Classification, distribution and cultivation characterizations of varieties. In: Saito, M. and T. Okubo (eds.) Soybean ecology and cultivation technology, Rural Culture Association Japan, Tokyo, pp. 37–62.
- Scheet, P. and M. Stephens (2006) A fast and flexible statistical model for large-scale population genotype data: applications to inferring missing genotypes and haplotypic phase. Am. J. Hum. Genet. 78: 629–644.
- Schmutz, J., S.B. Cannon, J. Schlueter, J. Ma, T. Mitros, W. Nelson, D.L. Hyten, Q. Song, J.J. Thelen, J. Cheng et al. (2010) Genome sequence of the palaeopolyploid soybean. Nature 463: 178–183.
- Singh, R. and T. Hymowitz (1999) Soybean genetic resources and crop improvement. Genome 42: 605–616.
- Sun, Z.Q., P.Z. Tian and J.A. Wang (1990) Preliminary study on the growth period structure of soybean varieties in the northeast of China. Soybean Sci. 9: 198–205.
- Tamura, K., J. Dudley, M. Nei and S. Kumar (2007) MEGA4: Molecular Evolutionary Geneitcs Analysis (MEGA) software version 4.0. Mol. Biol. Evol. 24: 1596–1599.
- Tiwari, S.P., O.P. Joshi and A.N. Sharma (1999) The advent and renaissance of soybean: a landmark in Indian agriculture. NRCS, Indore, pp. 1–58.
- Wall, J.D. and J.K. Pritchard (2003) Haplotype blocks and linkage disequilibrium in the human genome. Nat. Rev. Genet. 4: 587–597.
- Wang, G.X. (1981) Ecological classification of the Chinese soybean cultivars. Acta Agron. Sin. 14: 21–26.
- Wang, Y. (2008) Genetic analysis for growth period structure traits and QTL mapping of relative genes in soybean. Chinese Academy of Agricultural Sciences Ph.D. Dissertation.
- Wang, Y., L. Cheng, J. Leng, C. Wu, G. Shao, W. Hou and T. Han (2015) Genetic analysis and quantitative trait locus identification of the reproductive to vegetative growth period ration in soyban (Glycine max (L.) Merr.). Euphytica 201: 275–284.
- Wen, Z., Y. Ding, T. Zhao and J. Gai (2009) Genetic diveristy and peculiarity of annual wild soyeban (G. soja Sieb. et Zucc.) from various eco-regions in China. Theor. Appl. Genet. 119: 371–381.
- Wu, C.X., J.C. Li, A.H. Sha, H.Y. Zeng, S. Sun, G.M. Yang, X.A. Zhou, R.Z. Chang, H. Nian and T. Han (2012) Maturity group classification of check varieties in national soybean uniform trials of China. Acta Agron. Sin. 38: 1977–1987.
- Yi, X., Y. Liang, E. Huerta-Sanchez, X. Jin, Z.X. Cuo, J.E. Pool, X. Xu, H. Jiang, N. Vinckenbosch, T.S. Korneliussen et al. (2010) Sequencing of 50 human exomes reveals adaptation to high altitude. Science 329: 75–78.
- Zhang, L.X., S. Kyei-Boahen, J. Zhang, M.H. Zhang, T.B. Freeland, C.E. Watson and X.M. Liu (2007) Modifications of optimum adaptation zones for soybean maturity groups in the USA. Crop Management 6. 10.1094/CM-2007-0927-01-RS.
- Zhao, T. and J. Gai (2004) The origin and evolution of cultivated soybeans [Glycine max (L.) Merr.]. Scientia Agricultura Sinica 37: 954–962.

