Original Research Papers
Effects of Powder Vibration and Time Consolidation on Soft and Hard Wheat Flour Properties
2021 年 38 巻 p. 226-234

詳細
2021 年 38 巻 p. 226-234
Consistency and reliable flow are of great concern during the handling and processing of flour. In this study, wheat flour was consolidated by normal stress and vibration, and rheological factors including bulk solid compressibility, Warren-Spring cohesion strength, permeability, and wall friction were evaluated. Soft red winter (SRW) and hard red spring (HRS) wheat flours were vibrated for 5 and 10 minutes and compressed under 10 and 20 kPa for 12 and 24 h. After vibration, wall friction increased from 10.87° to 14.13° for SRW flour and decreased from 11.00° to 7.10° for HRS flour, and the permeability decreased for both the flours. Consolidation time and stress had a significant effect (P < 0.05) on wall friction and compressibility. The HRS Carr index increased from 25.77 to 38.48 when consolidated under 20 kPa for 24 hours, but the SRW Carr index decreased slightly from 46.60 to 44.24. The SRW flour permeability decreased significantly (P < 0.05) when compression pressure was increased from 10 to 20 kPa. while HRS permeability was less affected by consolidation. The consolidation and vibration effects on bulk flour properties differed likely due to inherent differences in the composition and hardness of HRS and SRW.
Wheat flour is one of the most important food products in the world. The bulk powder properties of wheat flour, including cohesiveness, flowability, wall friction, and permeability, are important for processing and handling, such as silo unloading and pneumatic transportation. These properties are highly dependent on particle size, shape, surface roughness, and composition (Molerus and Nywlt, 1984). The U.S. has differentiated wheat into 6 classes based on its composition and hardness. The flours from different wheat classes differ in particle size, surface fat and protein contents (Bian et al., 2015). Soft wheat flour has less protein and more fat content, and smaller particle size. Therefore, soft wheat flour is always cohesive than hard wheat flour (Bian et al., 2015). Studies also have found that the soft wheat flour shows higher cohesiveness than hard wheat flour due to the particle’s rough surface characteristics (Kuakpetoon et al., 2001). Due to flour particle size and compositional differences, soft and hard wheat flours could behave differently under similar consolidation or vibration conditions. During storage and transportation, minor changes in particle property contribute to significant changes in bulk powder properties. Besides environmental conditions such as humidity and/ or temperature changes causing consolidation, stress applied to the particle will affect bulk flour properties. Consolidation caused by the powder’s own weight has been found to reduce flowability (Teunou and Fitzpatrick, 2000). During consolidation, with the variable of time and deformation rate, particle surface contact and deformation can be distinguished as reversible elastic, irreversible plastic deformation, and viscoelastic deformation (Tomas, 2000). Many studies have reported that these bulk powder property changes are mainly due to interparticle force changes (Domian and Poszytek, 2005; Teunou and Fitzpatrick, 2000).
Discrete taps, or vibration, always exists during transportation or handling, which could lead to the segregation of granular materials (Jain et al., 2013). Studies have shown that in particulate systems which are made of coarse and fine fractions, the coarse powder fraction shifts upwards and fine powder fraction shifts downwards during vibration. The particle size distribution affects the segregation tendency in particulate systems (Kawakita and Lüdde, 1971; Parsons, 1976). A decrease in bulk volume is also found after vibration (Podczeck and Sharma, 1996). But, there are lack of studies that quantify this effect of segregation in wheat flour on their bulk characteristics. Furthermore, the vibration of cohesive powder could result in self-agglomeration (Kahrizsangi et al., 2016). Both particle segregation or self-agglomeration are undesirable for flour processing and handling. However, the effects of vibration on flour properties are unexplored. In addition, hard wheat flour and soft wheat flour differ in cohesiveness and particle size distribution.
In this study, we have used different techniques to determine the important wheat flour handling and processing properties. Tests like compressibility (including Hausner ratio, compressibility index, Carr index), permeability and Warren-Spring cohesion were used to assess flowability of the flour samples.
Goal of this manuscript was to study the vibration and time consolidation effects on soft and hard wheat flours bulk properties. Flour compressibility, Warren-Spring cohesion, permeability, and wall friction after consolidation and vibration treatments were tested, in order to provide a reference for bulk flour property changes after storage and transportation.
Soft red winter (SRW) and hard red spring (HRS) flours were obtained from The Mennel Milling Company (Fostoria, OH, USA). The moisture content was determined using AOAC method 925.10 (AOAC, 2006), by drying 2–3 g of flour at 130 °C for 2 h. The moisture contents of SRW and HRS were 12.71 ± 0.07 and 12.45 ± 0.02 % w.b., respectively. SRW contains 7.6 % protein (14 % m.b.) content and HRS contains 12.8 % protein (14 % m.b.) (Miller and Hoseney, 1997; Bian, et al., 2015). Flour particle size and shape factors were measured in two replicates using the Morphologi G3-ID instrument (Malvern Panalytical, Inc., Westborough, MA, USA). SRW had a mean particle circularity equivalent (CE) diameter of 11.97 ± 0.11 μm and a circularity mean of 0.83 ± 0.03, while HRS had a particle CE diameter of 16.91 ± 0.76 μm and a circularity mean of 0.78 ± 0.02 (Figs. 1, 2).
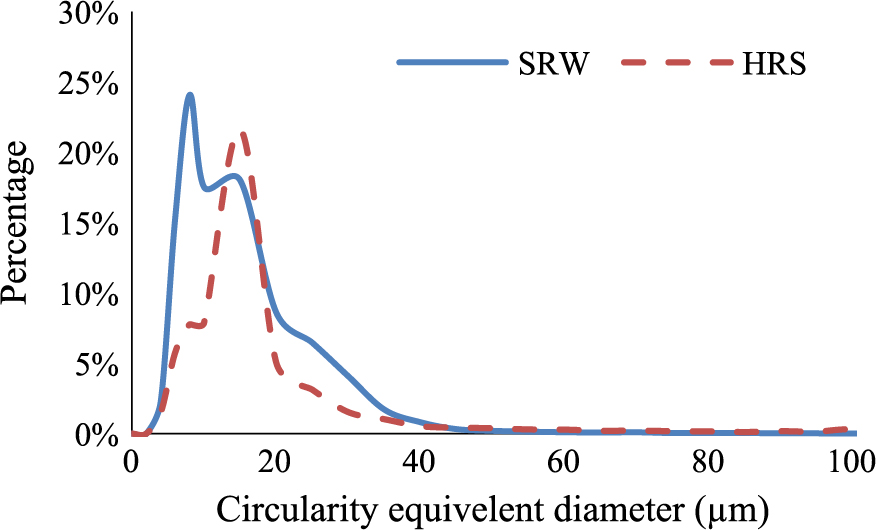
Particle size number distribution of SRW and HRS flours.

Images of HRS (left) and SRW (right) flour particles.
For consolidation, 50 g of flour was compressed using a vented piston on an Anton Paar rheometer (MCR 502 series, Anton Paar, Graz, Austria) under 10 and 20 kPa for 12 and 24 h before testing. These compression pressures were chosen to approximate stresses encountered during flour storage (Domian and Poszytek, 2005). To mimic handling, 50 g of flour was vibrated for 5 and 10 min using a tapped density tester (Agilent Technologies, Santa Clara, CA, USA) before property measurements. All the experiments were performed in triplicate to gauge for statistical significance. The complete design of experiment is presented in Table 1.
| Sl. No | Sample | Treatment | Parameters measured | ||
|---|---|---|---|---|---|
| Vibration (min) | Time-consolidation | ||||
| Consolidation time (h) | Pressure (kPa) | ||||
| 1 | SRW | 5, 10 | 12, 24 | 10, 20 | Carr index, WS cohesion strength, Permeability, Wall friction |
| 2 | HRS | 5, 10 | 12, 24 | 120, 20 | Carr index, WS cohesion strength, Permeability, Wall friction |
Bulk flour properties including compressibility, Warren-Spring cohesion strength, permeability, and wall friction were determined before and after consolidation and vibration treatments using built-in test methods on the Anton Paar MCR-502 rheometer.
Compressibility: Compressibility is a measure of the relative volume change when a pressure (normal stress) is applied and represents the density change under the applied normal stress. Carr index was used as an indicator to describe the compaction mechanism in this study. Low Carr index indicates low compressibility and a free-flowing powder. The Carr index is a characteristic of a powder’s compressibility and is often used as an indication of a powder’s flowability and is defined by the powder density before compression (ρ0) and after compression (ρt):
| (1) |
Flour was compressed to 50 N. A Carr Index of 1 indicates an incompressible bulk solid (ρt = ρ0). This is interpreted as the best possible flowability a granular material can have. The larger the value of Carr Index, the poorer the flowability of the material (Abdullah and Geldart 1999). In this study, the Carr index was obtained at 50 N (25 kPa) load in order to mimic the normal load in a flour storage silo.
Warren-Spring (WS) cohesion strength: This measurement is used to determine the cohesion of powders as a function of applied normal stress. A homogenous powder bed is created by consolidation at different normal stresses of 3, 6 and 9 kPa using a vented piston and then the Warren-Spring geometry was used to measure the torque at a very small rotational speed of 0.1 rpm. The cohesion strength can be derived from the torque (M) via a simple moment balance by correlating the shear resistance to the torque measured (Mohammed et al., 2011):
| (2) |
where Ri and R0 are the radius of Warren-Spring geometry shown in Fig. 3. The maximum cohesion strength obtained during the rotation of probe is known as Warren-Spring cohesion strength.

Schematic diagram of a Warren-Spring geometry.
Permeability: Permeability is defined as the resistance of fluid (air) through a compacted bed of powder. The permeability was determined by measuring the pressure gradient of air across a packed bed of length (L) at an airflow velocity (U) using the powder cell accessory attached to the rheometer (Mishra et al., 2020) and is given by Darcy’s law (Whitaker, 1986):
| (3) |
where Δp is the pressure drop in the compacted powder bed, and η is the air dynamic viscosity. Consolidation of flour reduces the porosity; thus, permeability is an important factor when developing unloading strategies for wheat flour. Flour permeability was tested under 3, 6, and 9 kPa pressure by measuring the resistance to airflow at 0.15 L/min.
Wall friction: This property measures the resistance between powder and the container wall material. In this study, the wall friction of flour on stainless-steel was measured. A stainless-steel probe was used to measure the wall friction at a rotational speed of 0.05 rpm under 3, 6, and 9 kPa pressure. Normal stress (σ) and shear stress (τ) were used to calculate the wall friction angle (Bian et al., 2015):
| (4) |
Each test used fresh samples and all the measurements were conducted in triplicate. One-way ANOVA was used to determine the effect of vibration on powder properties and two-way ANOVA was used for determining the effect of consolidation on powder properties as influenced by consolidation pressure and time. Statistical analysis was performed by Statistical Analytical System software (SAS Institute, Cary, NC, USA). P-values less than 0.05 were considered significant difference.
During wheat flour transportation, bulk flours undergo vibration inside the moving truck. The normal force applied to the flour particle during vibration is not as high as inside a storage bin, but particles rearrange depending on their differences in size and shape.
The Carr index (Table 2) reflects the percentage of volume change during compression, which is a good indicator of compressibility and powder flowability (Prescott and Barnum, 2000). HRS flours did not exhibit a significant difference in the Carr index values when vibration time was increased from 5 to 10 min. Both HRS and SRW flours were not significantly affected by vibration. But, the Carr index of HRS flours was much lower than SRW in similar to the observation by Bian et al. (2015). This indicated that vibration history did not affect the compressibility of the wheat flours. Though this study was limited to tapping of 10-min in a lab-scale, the results indicate that the flour compressibility is mainly affected by its own particle properties and moisture content. Furthermore, this study was limited to the lab-scale tapping for 10 min in maximum with 50 g of flour, it was not possible to fully monitor the real transportation scenario where the wheat flour could be subjected to several hours of vibration.
| Vibration time | Carr index | |
|---|---|---|
| HRS | Control | 36.95 (2.01) a |
| 5 min | 37.76 (1.24) a | |
| 10 min | 36.99 (0.19) a | |
| SRW | Control | 46.60 (0.39) a |
| 5 min | 45.26 (1.07) a | |
| 10 min | 46.79 (0.95) a |
Values in parentheses are the standard deviations. Values followed by the same letters are not significantly different when compared within HRS and SRW.
The wall friction angle decreased after vibration of HRS flours but increased with vibration for SRW flours (Table 3). The differences in results could likely be due to the differences in flour particle hardness. During the measurement of wall friction angle, the probe only touched the top surface of the bulk flour. During vibration, HRS particles might have been rearranged with large particles moving to the surface (Knight et al., 1993), without formation of agglomerates. Thus, the wall friction decreased with increase in particle size at the surface of bulk flour (Iqbal and Fitzpatrick, 2006). This mechanically induced effect due to vibration is also called granular convection, or more commonly, the Brazil nut effect, in which mechanical agitation of a granular medium segregates the particles, such that the largest particles end up on top (Ehrichs et al., 1995). For SRW, on the other hand, some agglomerates were observed during vibration. Self-agglomeration of cohesive powder may occur during vibration (Kahrizsangi et al., 2016). The agglomerates formed with the highly cohesive SRW flour particles, during vibration, resulted in cohesive particles accumulating on the bulk flour surface. During the wall friction test measurement, the SRW flour agglomerates on the top of the surface were deformed when in contact with the wall friction probe. This potentially could have crumbled the loose agglomerates formed on the surface which in turn would have exposed the cohesive powder fraction to the probe which led to an increase in wall friction angle.
| Vibration time | Wall Friction (°) | |
|---|---|---|
| HRS | Control | 11.00 (0.40) a |
| 5 min | 7.03 (0.19) b | |
| 10 min | 7.10 (0.63) b | |
| SRW | Control | 10.87 (0.83) a |
| 5 min | 11.43 (0.71) a | |
| 10 min | 14.13 (1.04) b |
Values in parentheses are the standard deviations. Values followed by the same letters are not significantly different when compared within HRS and SRW.
Significant differences in permeability were not observed for both HRS and SRW flours, except for the SRW flour tested at 6 and 9 kPa load (Table 4) where a statistical change was observed. Overall the result corresponded well to the Carr indices, that compressibility is not affected by vibration. Though the results did not reveal significant changes, permeability decreased with vibration, which indicated that rearrangement has some effect, but not a major effect, on permeability.
| Vibration time | Permeability (10−12 m2) | |||
|---|---|---|---|---|
| 3 kPa | 6 kPa | 9 kPa | ||
| HRS | Control | 16.75 (0.70) a | 13.03 (0.48) a | 11.82 (0.38) a |
| 5 min | 15.92 (0.86) a | 12.81 (0.55) a | 11.59 (0.39) a | |
| 10 min | 15.78 (1.13) a | 12.93 (0.64) a | 11.62 (0.45) a | |
| SRW | Control | 9.56 (0.43) a | 5.64 (0.13) a | 4.54 (0.29) a |
| 5 min | 8.63 (0.53) a | 4.79 (0.32) b | 3.69 (0.16) b | |
| 10 min | 8.68 (0.46) a | 4.90 (0.28) b | 3.78 (0.08) b | |
Values in parentheses are the standard deviations. Values followed by the same letters are not significantly different when compared within HRS and SRW.
Both HRS and SRW flours exhibited changes in WS cohesion strength after vibration (Table 5) with an increased effect on SRW cohesiveness than the HRS flour. Even at 5 min of vibration, the WS cohesion strength increased for both HRS and SRW flours but was not statistically different than the control samples. The WS measurement probe penetrated 10 mm into the top of the compressed powder bed before applying a torque to induce failure in the powder bed. This was approximately about one third the volume of the powder bed. Vibration which would have caused; granular convection of larger particles to the top could potentially explain the drop in Warren-Springs cohesion due to presence of higher sized particle fractions at the top. The limited number of agglomerates formed in SRW did not affect the cohesion strength measurement unlike the wall friction angle. High standard deviation of WS cohesion strength is found for SRW control sample at 9 kPa consolidation which could be due to the high cohesiveness of the SRW powder.
| Vibration time | WS Cohesion strength | |||
|---|---|---|---|---|
| 3 kPa | 6 kPa | 9 kPa | ||
| HRS | Control | 0.70 (0.26) a | 0.91 (0.09) ab | 1.08 (0.10) a |
| 5 min | 0.81 (0.05) a | 1.02 (0.06) a | 0.97 (0.05) a | |
| 10 min | 0.63 (0.22) a | 0.87 (0.01) b | 1.00 (0.10) a | |
| SRW | Control | 0.70 (0.13) a | 2.26 (0.09) a | 3.41 (0.57) a |
| 5 min | 0.94 (0.08) a | 2.49 (0.05) a | 3.63 (0.32) a | |
| 10 min | 0.66 (0.18) a | 1.50 (0.24) b | 2.95 (0.26) a | |
Values in parentheses are the standard deviations. Values followed by the same letters are not significantly different when compared within HRS and SRW.
During storage, the flour gets consolidated in the bin and the bulk properties change, influenced by both consolidation time and stress. During consolidation, flour may become gradually more compact when submitted to compression stress over storage time (Teunou and Fitzpatrick, 2000). Large compression stress may result in more compacted powder, which increases the particle contact surface and further affects the bulk powder properties.
SRW flour contains less protein than HRS, thus the SRW particles are expected to be softer than HRS and the particle deformation scenarios will be different. During consolidation, the effects of time and stress had a positive effect on the Carr index as shown in Table 6.
| Time (h) | Pressure (kPa) | Carr index | |
|---|---|---|---|
| HRS | Control | 35.77 (0.85) a | |
| 12 | 10 | 35.45 (0.44) a | |
| 12 | 20 | 35.83 (0.58) a | |
| 24 | 10 | 37.68 (0.88) ab | |
| 24 | 20 | 38.48 (0.72) bc | |
| SRW | Control | 46.60 (0.39) ab | |
| 12 | 10 | 46.28 (0.67) ab | |
| 12 | 20 | 45.38 (2.14) ab | |
| 24 | 10 | 47.95 (0.22) b | |
| 24 | 20 | 44.24 (0.67) a |
Values in parentheses are the standard deviations. Values followed by the same letters are not significantly different when compared within HRS and SRW.
For HRS flour, the Carr index was mainly affected by consolidation time, and the values increased with time of consolidation. This could be due to the irreversible plastic deformation of HRS particles due to time consolidation and the smaller particles filled into the voids when conducting the Carr index measurements. However, for SRW flour, the Carr index did not change significantly except at compression duration of 24 h at 10 kPa load. The SRW flour particle is soft and could elastically deform (reversible) during time-consolidation, therefore, the particle reverted to the original shape when the load was removed, and the compressibility value did not change. The inconsistency in Carr index values at 10 kPa load when consolidated for 24 h could potentially be because of transient effects in that the particle did not return to its original shape.
For both HRS and SRW flours, when comparing 10 and 20 kPa pressure for the same consolidation time, the wall friction angle significantly increased with increased pressure (Table 7). However, with increased consolidation time, the wall friction angle decreased significantly for SRW, from 12.93° to 11.40° under 20 kPa, while increased from 9.45° to 11.07° for HRS flour.
| Time (h) | Pressure (kPa) | Wall Friction (°) | |
|---|---|---|---|
| HRS | Control | 11.00 (0.40) a | |
| 12 | 10 | 8.11 (1.16) c | |
| 12 | 20 | 9.45 (0.39) ab | |
| 24 | 10 | 7.26 (0.31) c | |
| 24 | 20 | 11.07 (0.29) ab | |
| SRW | Control | 10.87 (0.83) a | |
| 12 | 10 | 10.27 (0.46) ab | |
| 12 | 20 | 12.93 (0.59) c | |
| 24 | 10 | 9.31 (0.09) b | |
| 24 | 20 | 11.40 (0.62) ab |
Values in parentheses are the standard deviations. Values followed by the same letters are not significantly different when compared within HRS and SRW.
Flour particles compressed under high consolidation stress could cause particle shape deformation and the increased surface contact area between the probe and bulk flour could result in increased interparticle force between particles and the wall. Therefore, the wall friction increased with the increase in pressure from 10 to 20 kPa for both HRS and SRW flours.
The consolidation time, on the other hand, showed inconsistent results for both HRS and SRW flours. Domian and Poszytek (2005) and Tomas (2000) found that the angle of internal friction decreased with increasing consolidation time. The same trends were found for SRW and HRS flours under 10 kPa. HRS’s wall friction at 24 h and 20 kPa, in particular, increased from 12 h, which could be because that the HRS was more affected by compression.
As expected, consolidation affected flour permeability (Table 8). With increased consolidation time and pressure, permeability decreased significantly for SRW flours. For HRS, on the other hand, the lowest permeability was observed under 20 kPa pressure compressed for 12 h and then increased with consolidation time. This could be due to the differences in cohesiveness and particle size distribution of the flours. SRW is softer and more cohesive than HRS, thus under consolidation, the bulk density increased, and bonding occurred between particles (Bian et al., 2015). With increasing bulk density and fewer voids between particles, the permeability decreased. HRS particles are harder than SRW particles, thus the voids during consolidation remained, and the effect of pressure was not significant.
| Time (h) | Pressure (kPa) | Permeability (10−12 m2) | |||
|---|---|---|---|---|---|
| 3 kPa | 6 kPa | 9 kPa | |||
| HRS | Control | 16.75 (0.70) a | 13.03 (0.48) a | 11.82 (0.38) a | |
| 12 | 10 | 13.23 (1.00) bc | 12.35 (1.08) ab | 11.60 (0.97) ab | |
| 12 | 20 | 11.92 (1.03) c | 10.41 (0.69) b | 9.81 (0.86) ab | |
| 24 | 10 | 12.89 (2.02) bc | 11.67 (1.33) ab | 11.02 (1.24) ab | |
| 24 | 20 | 15.89 (0.78) ab | 13.13 (0.47) a | 11.86 (0.46) a | |
| SRW | Control | 9.56 (0.43) a | 5.64 (0.13) a | 4.54 (0.29) a | |
| 12 | 10 | 8.73 (0.23) ab | 5.17 (0.20) ab | 3.90 (0.07) ab | |
| 12 | 20 | 3.19 (0.54) c | 2.94 (0.53) c | 2.66 (0.60) c | |
| 24 | 10 | 7.79 (0.74) b | 4.86 (0.18) ab | 3.80 (0.04) b | |
| 24 | 20 | 2.95 (0.27) c | 2.52 (0.34) c | 2.16 (0.19) c | |
Values in parentheses are the standard deviations. Values followed by the same letters are not significantly different when compared within HRS and SRW.
Table 9 shows the WS cohesion strength values after consolidation. Only SRW flour, after 24 h of consolidation at 10 kPa pressure, exhibited a significant difference. This indicated that consolidation has a limited effect on WS cohesion strength. Similar to permeability, the SRW bulk properties are more affected by consolidation because of the flour particle’s own properties, and after 12 h and 10 kPa consolidation, cohesiveness increased significantly. This result agrees with Iqbal and Fitzpatrick (2006), that the time consolidation does not have an effect on flour’s effective angle of internal friction, which represented the cohesiveness of the powder.
| Time (h) | Pressure (kPa) | WS Cohesion Strength | |||
|---|---|---|---|---|---|
| 3 kPa | 6 kPa | 9 kPa | |||
| HRS | Control | 0.70 (0.26) a | 0.91 (0.09) a | 1.08 (0.10) a | |
| 12 | 10 | 0.98 (0.42) a | 1.14 (0.04) a | 1.18 (0.14) a | |
| 12 | 20 | 1.17 (0.30) a | 1.18 (0.17) a | 1.18 (0.10) a | |
| 24 | 10 | 1.08 (0.40) a | 1.11 (0.19) a | 1.04 (0.15) a | |
| 24 | 20 | 0.78 (0.04) a | 1.04 (0.10) a | 1.08 (0.06) a | |
| SRW | Control | 0.70 (0.13) a | 2.26 (0.09) a | 3.41 (0.57) ab | |
| 12 | 10 | 0.91 (0.05) a | 2.58 (0.16) a | 4.66 (0.18) a | |
| 12 | 20 | 0.86 (0.36) a | 2.33 (0.36) a | 4.10 (0.37) ab | |
| 24 | 10 | 0.55 (0.07) a | 1.96 (0.66) a | 3.25 (0.79) b | |
| 24 | 20 | 0.72 (0.26) a | 1.98 (0.40) a | 3.66 (0.23) ab | |
Values in parentheses are the standard deviations. Values followed by the same letters are not significantly different when compared within HRS and SRW.
HRS and SRW have different compositions, therefore consolidation and vibration effects on the bulk flour properties differed. Vibration rearranges the particles inside the container and helps cohesive flour powder form agglomerates, thus the compressibility, cohesiveness, permeability, and wall friction changed. After vibration, smaller particles filled the interparticle voids and formed a denser bulk with decreased permeability. Wall friction demonstrated significant changes before and after vibration. Thus, rearrangement and uniformity of the flour after transportation are attention-worthy. The rearrangement possibly changed the particle size at the location where WS cohesion strength was measured, which resulted in a decreased WS cohesion strength for SRW flours. With vibration, segregation of flour can cause inconsistency of flour quality for downstream processing. But the effect of vibration time on flour segregation is still an unexplored area of research.
Time consolidation increases interparticle interactions. Due to the differences in flour hardness, the effect of time and pressure were not the same for SRW and HRS flours. SRW flour was affected by pressure change while HRS flour was affected by storage time. Because SRW flour is softer and more cohesive than HRS, the flour particles tended to deform, and SRW flour was more compacted under high pressure.
Particle size and shape, as well as surface chemical composition, could also have changed after consolidation, thus further studies on single-particle changes are needed in order to better understand the bulk property changes under time consolidation.
Circular equivalent
HRSHard red spring flour
LPacked bed of length
MTorque by Warren-Spring geometry
QAirflow rate
RiInner radii of WS geometry (Fig. 3)
R0Outer radii of WS geometry (Fig. 3)
SRWSoft red winter flour
WSWarren-Spring
σNormal stress
τShear stress
ΔpPressure drop in the compacted powder bed
ηAir dynamic viscosity
ρ0Powder density before compression
ρtPowder density after compression
Yumeng Zhao
;%0A%09%09%09newWindow.document.open();%0A%09%09%09newWindow.document.write('<img src=%22./Graphics/38_2021007_04.jpg%22>');%0A%09%09%09newWindow.document.close();%0A%09%09)
Graduate research assistant in Agricultural and biological engineering at Purdue University, USA, with research area including particle and particulate system characterization, aerosol modeling, dust explosion prevention.
Poonam Phalswal
;%0A%09%09%09newWindow.document.open();%0A%09%09%09newWindow.document.write('<img src=%22./Graphics/38_2021007_05.jpg%22>');%0A%09%09%09newWindow.document.close();%0A%09%09)
Undergraduate student in Dairy Technology at National Dairy Research Institute, India and a visiting undergraduate student at Purdue University, USA.
Abhishek Shetty
;%0A%09%09%09newWindow.document.open();%0A%09%09%09newWindow.document.write('<img src=%22./Graphics/38_2021007_06.jpg%22>');%0A%09%09%09newWindow.document.close();%0A%09%09)
Lead Scientist for the Rheology division at Anton Paar USA. Dr. Shetty has over 10 years of working experience in the CPG and Advanced instrumentation space. His expertise lies in the following areas-Complex fluid rheology, Structure-property relationships, Polymer science and dynamics, Microfluidics, Surfactant science and technology, Solids processing and handling, Powder rheology and characterization, Agglomeration, Wet Granulation, Foam Granulation, Binders and Additives, and Colloidal suspensions.
Kingsly Ambrose
;%0A%09%09%09newWindow.document.open();%0A%09%09%09newWindow.document.write('<img src=%22./Graphics/38_2021007_07.jpg%22>');%0A%09%09%09newWindow.document.close();%0A%09%09)
Associate Professor of Agricultural and Biological Engineering at Purdue University, USA with research focus on studying and quantifying characteristics of compositionally complex solids of biological origin and relating single particle characteristics to bulk dynamics. Application areas include particle and powder characterization, particle modeling, particle design, and dust explosion prevention. For additional details, please visit the following websites: https://engineering.purdue.edu/FFP and https://engineering.purdue.edu/CP3