Abstract
The end groups in radically polymerized poly(methyl methacrylate) samples with tert-butyl peroxy-2-ethylhexanoate as an aliphatic peroxide initiator and 1-octanethiol as a chain transfer reagent were complementarily characterized by high-resolution matrix assisted laser desorption/ionization (MALDI) spiral time-of-flight mass spectrometry (MS) and pyrolysis-gas chromatography-mass spectrometry (Py-GC-MS). The end groups comprised of three types of the initiator fragments and octylthio group originating from the chain transfer agent were confirmed by MALDI-MS measurements. In addition, their quantitative information was obtained by Py-GC-MS. Furthermore, combined with size exclusion chromatographic fractionation, the molar mass dependence of the end groups in the PMMA samples was also examined. It was suggested that the relative content of the octylthio end groups might increase with increase in the molar mass of the fractions. The observed results were interpreted in terms of the polymerization reactions of the PMMA samples.
INTRODUCTION
Recently, matrix-assisted laser desorption/ionization mass spectrometry (MALDI-MS) has been widely utilized for the structural characterization of various synthetic polymers, because of its soft ionization nature with less fragmentation.1–3) On the other hand, analytical pyrolysis techniques such as pyrolysis-gas chromatography-mass spectrometry (Py-GC-MS) and evolved gas analysis (EGA)-MS have provided practical approaches for the polymer characterization for a long time.4–6) Both the methods possess the complementary features for the molecular characterization of polymers. MALDI-MS gives us directly precise information not only for molar mass but also chemical structures such as copolymer composition and end groups based on the observed m/z of the individual components. Because of the mass discrimination effect, however, observed information in the MALDI mass spectra is generally limited only for the relatively lower molar mass components especially for polydisperse polymer samples. On the other hand, by using modern Py-GC-MS technique the structural characterization of the sample polymer can be achieved with high sensitivity. Not only the copolymer composition but also the microstructures of polymers such as end groups, branching, tacticity, and copolymer sequences can be often analyzed quantitatively although the observed information should be inherently correlated to the averaged and/or partial structures in the sample polymer molecules.
In this work, end groups in radically polymerized poly(methyl methacrylate) (PMMA) samples were characterized in detail by using both MALDI-MS and Py-GC-MS. So far a number of papers have been reported for the end group characterization in PMMA samples by MALDI-MS(/MS).7,8) In addition, Py-GC-MS (or Py-GC with other detection methods) was also applied for the highly sensitive analysis of end groups in various PMMA samples, including the quantitative determination.9–14) To the best of our knowledge, this work is the first report on the complementary use of both MALDI-MS and Py-GC-MS to characterize end groups in polymer sample. In particular, a high-resolution spiral time-of-flight (TOF) analyzer was used for MALDI-MS to confirm m/z for the key components precisely in this work. Furthermore, size exclusion chromatographic (SEC) fractionation was also combined with MALDI- and Py-GC-MS to examine the molar mass dependence of the end groups in the samples. The observed results were discussed in terms of the polymerization reactions for the PMMA samples.
EXPERIMENTAL
PMMA samplesPMMA samples were synthesized by bulk radical polymerization at 155°C for 3 min using tert-butylperoxy-2-ethylhexanoate as an aliphatic peroxide initiator and 1-octanethiol as a chain transfer reagent. The raw polymers thus synthesized were subjected to reprecipitation in hexane to remove the residual monomer and the reagents. The PMMA samples in powdered form were obtained and listed in Table 1 along with the feed compositions of the polymerization reagents and the molar mass data determined by size exclusion chromatography. Sample A was produced in the presence of extremely high content (18.0%) of the initiator without any chain transfer reagent. Samples B and C were prepared with the same amount of the chain transfer agent (0.73%) but different concentration of the initiator (1.1 and 4.5%, respectively). Depending on the total content of the polymerization reagents, the observed number average molar mass (Mn) were in the order of sample B>C>A.
Table 1. PMMA samples.
| Sample | Initiator*concentration in feed (%) | Chain transfer agent** concentration in feed (%) | Mn*** |
|---|
| A | 18.0 | — | 3200 |
| B | 1.1 | 0.73 | 11000 |
| C | 4.5 | 0.73 | 4500 |
* tert-Butylperoxy-2-ethylhexanoate 
** 1-Octanethiol 
*** Number average molecular weight determined by size exclusion chromatography.
MALDI-MS measurements were performed using a high-resolution TOFMS with a spiral ion trajectory of ca. 17 m flight path (JMS-S3000, JEOL, Tokyo, Japan).15–17) The ionization was carried out with Nd:YLF laser (349 nm) in 0.5 ns pulse width and mainly 250 Hz frequency. Ions generated by the laser desorption were introduced into the flight tube with an accelerating voltage of 20 kV and separated in a positive spiral mode. The mass spectra were acquired with the delay time set at 1500 ns. Mass calibration was accomplished by using poly(ethylene glycol) (peak top molar mass ca. 1540) as an external standard.
As for the PMMA samples without fractionation, the sample was dissolved in tetrahydrofuran (THF) with any concentration of 6 (sample A), 8 (sample C) or 20 mg mL−1 (sample B), considering the average molar mass. As the matrix reagent for sample ionization, trans-2-[3-(4-tert-butylphenyl)-2-methyl-2-propenylidene]malononitrile (DCTB; Tokyo Chemical Industry, Tokyo, Japan) was employed. Sodium iodide (NaI) was used as a cationization agent. THF solutions of both DCTB and NaI were also prepared at the concentrations of 10 and 1.5 mg mL−1, respectively. The same volume (10 μL each) of the sample, DCTB and NaI solutions were then mixed in a microtube. An aliquot (0.5 μL) of the mixed solution dropped on the sample plate was subjected to MALDI-MS measurement. Under these conditions the ions observed in the MALDI mass spectra were predominantly sodium-cationized molecules.
As for the SEC fractions, 0.5 μL of NaI solution (10 mg mL−1 in THF) was first spotted on the sample plate and dried. The SEC fraction of the sample (collected as mentioned below) was dissolved in 10 μL THF and mixed with 10 μL of DCTB solution (25 mg mL−1 in THF). An aliquot (0.5 μL) of the sample fraction / matrix mixture was then dropped on the precoated NaI to observe the MALDI mass spectrum.
Py-GC-MSA vertical microfurnace pyrolyzer (PY-2020iD, Frontier Lab) was attached to the injection port of a GC-MS system (GCMS-QP2010 Plus, Shimadzu). About 0.1 mg of a polymer sample without fractionation weighed (or the SEC fractions) in a deactivated stainless steel sample cup was pyrolyzed at 540°C under the flow of helium carrier gas. The flow rate of 75 mL min−1 of carrier gas at the pyrolyzer was reduced to 1.46 mL min−1 at a metal capillary separation column (Ultra-Alloy+5, 30 m×0.25 mm i.d., coated with 1.0 μm of 5% diphenyl-95% dimethyl-polysiloxane, Frontier Lab) by means of a splitter. The temperature of both the Py/GC interface and the GC injection port was set at 320°C. The column oven temperature was first held at 40°C for 10 min, then programmed to 300°C at a rate of 5°C min−1 and finally held at 300°C for 20 min. The separated components were introduced into the ionization source of a quadrupole MS through a GC/MS interface held at 250°C. The ionization was achieved with electron ionization at 70 eV. The mass scan range was m/z 33–600.
SEC fractionationSEC measurement and fractionation were performed using an SEC system equipped with an HPLC pump (LC-20AD, Shimadzu), a degasser (DGU-20A3, Shimadzu), a column oven (CTO-20AC, Shimadzu), an RI detector (RID-10A, Shimadzu) and a fraction collector (FRC-10A, Shimadzu). SEC separation was carried out using Showdex K-803, K-806 M and K-G11 columns connected in series. All SEC experiments were operated at 40°C using chloroform as the mobile phase (1.0 mL min−1). The injection volume was 100 μL using the sample solution with the polymer concentration at either 10 or 20 mg mL−1 for the fractionation for MALDI-MS or Py-GC-MS, respectively. Fractionation was performed by collecting the eluent for 3 s at the retention time of 18.58–18.63, 19.64–19.69, 20.74–20.79, and 22.09–22.14 min corresponding to the equivalent Mn around 20000, 10000, 5000, and 2000, respectively, for polystyrene standards into the collection vial (for MALDI-MS) or the sample cup (for Py-GC-MS). The fractionation and collection were repeated 5 or 3 times for MALDI or Py-GC, respectively, to accumulate sufficient amount of the sample. After the collected fractions were dried, those in the collection vials were redissolved in 10 μL THF for MALDI-MS measurements while those in the sample cup were directly subjected to Py-GC-MS measurements.
RESULTS AND DISCUSSION
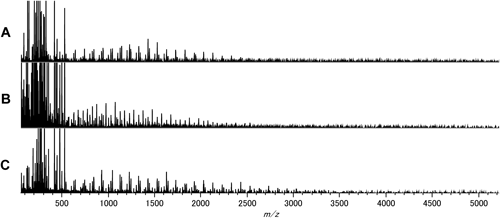
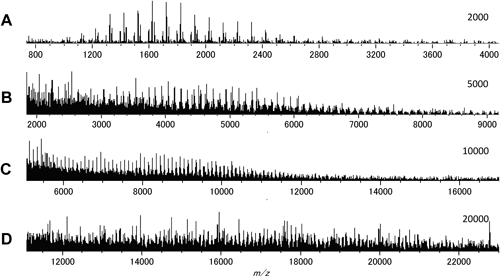
MALDI-MS measurementsFigure 1 shows the observed mass spectra of (A) sample A, (B) sample B, and (C) sample C without fractionation. In every mass spectrum several series of peaks were observed with the m/z interval of 100 (corresponding to the molecular weight of MMA monomer) in almost the same m/z region (mainly 500–3000) despite the considerable difference in the estimated molar mass values of the samples, which were much larger than m/z of the main peaks in the MALDI mass spectra. These observations should be attributed to the mass discrimination effect characteristic of MALDI-MS measurements.
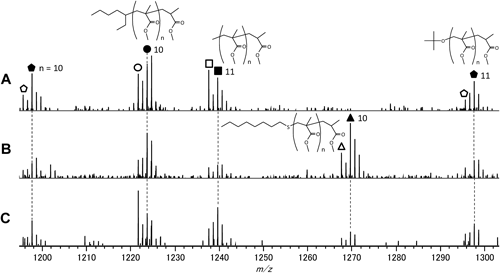
Figure 2 presents the expanded views of the mass spectra between m/z 1200 and 1300, corresponding to MMA decamers (n=10) and undecacamers (n=11) region to assign the individual components in the PMMA samples. As shown in Scheme 1, various types of molecules can be formed during the radical polymerization of MMA. In addition, at least three types of the initiator fragments (1-ethylpentyl, methyl and tert-butoxy) presented in Scheme 2 should be incorporated into the PMMA chains as the end groups. In the MALDI mass spectrum of sample A synthesized without any chain transfer agent, the main components observed were identified as the molecules which contained any of the three types of the initiator fragments at one end together with either saturated (closed symbols; chemical structures are presented) or unsaturated terminal (open symbols) formed through disproportionation terminations. As for the samples B and C, the components containing the fragment of the chain transfer agent (octylthio group) instead of the initiator fragments were additionally observed (denoted with a triangle; chemical structure is shown for the closed symbol). These assignments were confirmed by the good agreements in the precise m/z values between the observed and the calculated ones in the whole range of mass spectra. Table 2 summarizes the typical example for the molecules with the saturated terminal in the dodecamer and tridecamer region observed for sample B. Moreover, the relative intensities of the components with an octylthio end group were clearly higher for sample B than those for sample C, corresponding to the feed ratio between the initiator and the chain transfer reagent. On the other hand, the components produced by the recombination termination preferentially decomposed at the labile head-to-head linkage during the MALDI process and did not observed in the MALDI mass spectra although they should be formed in the polymerization processes of the PMMA samples.18)

Scheme 1. Typical pathways of radical polymerization of methyl methacrylate.
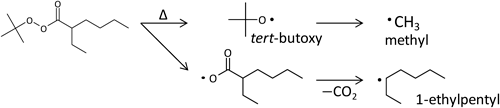
Scheme 2. Possible formations of initiating radicals from the initiator.
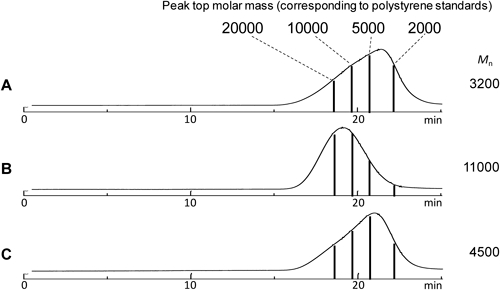
Next the fractionated samples were subjected to MALDI-MS in order to observe the higher molar mass region with eliminating the mass discrimination effect. Figure 3 presents the observed SEC chromatograms along with the fractionated points for the PMMA samples. It was suggested that the representative fractions were obtained especially for samples A and C. Figure 4 shows the MALDI mass spectra of the fractions from sample A synthesized without the chain transfer reagent. Even in the higher molar mass region more than 20000, which could not be detected without fractionation, the peaks of the sample components were observed.
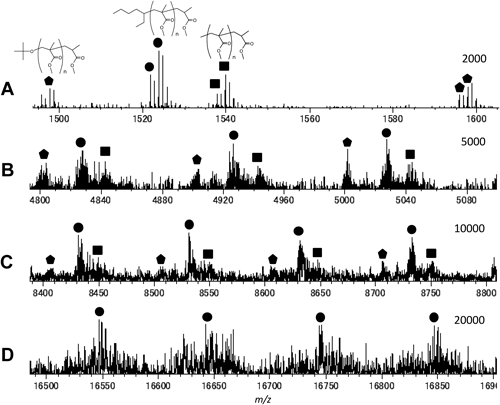
Figure 5 shows the expanded views of the representative regions for the MALDI mass spectra of the individual fractions from sample A. Relative intensities among the components with the three types of the initiator fragments were basically similar for any molar mass regions, although the resolution and the sensitivity of the observed ions became worse for the higher molar mass fractions. This observation suggests that the contributions of the three types of initiator radicals were fairly constant in any stage of polymerization.
Figure 6 shows the representative regions of the MALDI mass spectra of the individual fractions from sample C. In this case the components with an octylthio terminal originating from the chain transfer agent were additionally observed. These additional components were also observed with higher intensities in the mass spectra for the fractions of sample B. The relative intensities of the components observed in Fig. 6 tended to increase gradually with increase in the molar mass. This fact suggests that the relative amounts among the PMMA components might have some molar mass dependence for sample C. Unfortunately further discussion in more detail was difficult mainly because of the insufficient S/N ratio in the MALDI mass spectra in particular for the higher molar mass fractions.
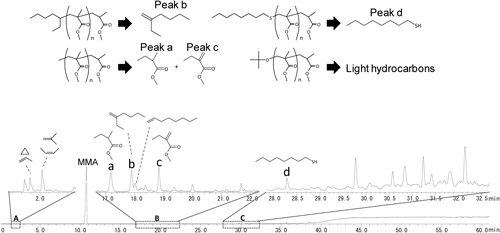
Py-GC-MS measurementsIn order to obtain complementary information for the end group structures, especially from the quantitative point of view, the PMMA samples and their SEC fractions were then subjected to Py-GC-MS measurements. Figure 7 shows the pyrogram of sample C. Due to the highly depolymerized nature of PMMA, the sample mainly decomposed into the monomer at elevated temperature. In the pyrogram of PMMA, therefore, MMA monomer is predominantly observed as shown in Fig. 7. However, various minor peaks additionally appeared in the enlarged pyrograms. Among these the pyrolysis products originated from the end groups were assigned also as presented in Fig. 7 (representing for the PMMA components with the saturated end group). For example some of the light hydrocarbons eluted in the initial part of the pyrogram (region A) should be the fragment of the linear and the branched alkyl groups at the chain end. Meanwhile, peaks a and c, and b in the region B were attributed to methyl and 1-ethylpentyl terminals, respectively. Peak d in the region C should be formed from the octylthio end group.
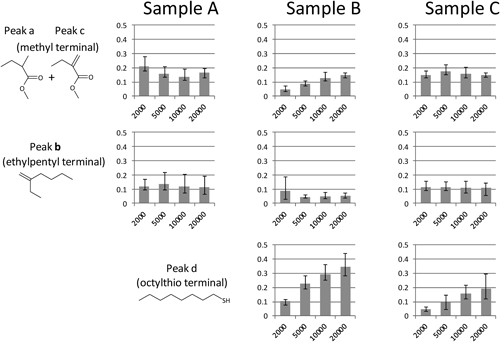
The pyrograms of the SEC fractions of the samples were then interpreted in terms of the relative content of the individual end groups. Here peaks a+c, b, and d were selected as the key products reflecting the methyl, 1-ethylpentyl and octylthio end groups, respectively. Because the polymer main chains were mostly decomposed into MMA monomer, the relative peak intensities of the key products to that of MMA should be correlated to the relative content of the corresponding end groups. The relative contents thus estimated, however, should vary depending on the molar mass, which decrease with increase in the molar mass. Therefore, to compensate this variation with the molar mass, the relative contents of the end groups were then multiplied by the degrees of polymerization estimated from the corresponding Mn of the fractions. The values calculated in this manner could make it possible to compare directly the fractions with different molar mass, and should represent the relative amount of each end group per a PMMA molecule.
Figure 8 summarizes the values reflecting the contents of the end groups per a molecule obtained for the individual SEC fractions. Although some fluctuations were observed, the estimated contents of the end groups composed of the initiator radicals did not give specific molar mass dependence (peaks a–c). On the contrary, the contents of the end groups originated from the chain transfer agent showed some molar mass dependence, which increased with increase in the molar mass of the fraction.
The observed results might be attributed to the polymerization processes as follows. At the initial stage of polymerization, the concentration of the initiation radicals from the initiator should be high and the formed propagating radicals readily terminated to produce relatively small PMMA molecules with the end group consisting of the initiator fragments. In the later stage of polymerization, in which the chain transfer reactions were also contributed, the content of propagating radicals gradually decreased, and the molar mass of the formed PMMA molecules might increase. As a result, it was suggested that relative amounts of the PMMA components formed through the chain transfer reactions also increased with increase in the molar mass, as shown in Fig. 8.
CONCLUSION
Focusing on the end group analyses for the radically polymerized PMMA samples, it was demonstrated that complementary use of MALDI-MS and Py-GC-MS was a quite useful approach for the structural characterization of the polymer sample molecules in detail. MALDI-MS, in particular a high-resolution system, usually gives us the precise structural information of the individual sample components. Meanwhile the quantitative determination of the specific chemical structures in the polymer sample was often achieved by Py-GC-MS. In addition, SEC fractionation of the polymer samples was generally quite effective to eliminate the undesirable mass discrimination effect in MALDI-MS measurements, and made it possible to detect the components with larger molar mass. Furthermore, molar mass dependence of various chemical structures could be clarified with detailed analyses of the fractionated samples.
Acknowledgements
This work was supported in part by the research foundation of Frontier Laboratory Inc., and by JSPS KAKENHI Grant Number 233350032.
REFERENCES
- 1) H. Pasch, W. Schrepp. MALDI-TOF Mass Spectrometry of Synthetic Polymers. Springer-Verlag, Berlin Heidelberg, 2003.
- 2) L. Li, ed. MALDI Mass Spectrometry for Synthetic Polymer Analysis, John Wiley & Sons, Hoboken, 2010.
- 3) C. Barner-Kowollik, T. Gruendling, J. Falkenhagen, S. Weidner, eds. Mass Spectrometry in Polymer Chemistry, Wiley-VCH, Weinheim, 2012.
- 4) S. C. Moldoveanu. Analytical Pyrolysis of Synthetic Organic Polymers, Elsevier, Amsterdam, 2005.
- 5) T. P. Wampler, ed. Applied Pyrolysis Handbook, 2nd Ed., CRC Press, Boca Raton, 2007.
- 6) S. Tsuge, H. Ohtani, C. Watanabe. Pyrolysis-GC/MS Data Book of Synthetic Polymers—Pyrograms, Thermograms and MS of Pyrolyzates—, Elsevier, Amsterdam, 2011.
- 7) H. Pasch, F. Gores. Matrix-assisted laser desorption/ionization mass spectrometry of synthetic polymers: 2. Analysis of poly(methyl methacrylate). Polymer 36: 1999–2005, 1995.
- 8) A. T. Jackson, A. Bunn, M. S. Chisholm. Utilising matrix-assisted laser desorption/ionization techniques for the generation of structural information from different end-group functionalized poly(methyl methacrylate)s. Polymer 49: 5254–5261, 2008.
- 9) H. Ohtani, S. Ishiguro, M. Tanaka, S. Tsuge. Characterization of polymerization reagents incorporated into poly(methyl methacrylate) chains by pyrolysis-gas chromatography. Polym. J. 21: 41–48, 1989.
- 10) H. Ohtani, M. Tanaka, S. Tsuge. Pyrolysis-gas chromatographic study of end groups in poly(methyl methacrylate) radically polymerized in toluene solution with benzoyl peroxide as initiator. J. Anal. Appl. Pyrolysis 15: 167–174, 1989.
- 11) H. Ohtani, M. Tanaka, S. Tsuge. End group of poly(methyl methacrylate) as a function of molecular weight determined by pyrolysis-gas chromatography. Bull. Chem. Soc. Jpn. 63: 1196–1200, 1990.
- 12) H. Ohtani, Y. F. Luo, Y. Nakashima, Y. Tsukahara, S. Tsuge. Determination of end group functionality in poly(methyl methacrylate) macromonomers by pyrolysis simultaneous multidetection gas chromatography. Anal. Chem. 66: 1438–1443, 1994.
- 13) Y. Ito, S. Tsuge, H. Ohtani, S. Wakabayashi, J. Atarashi, T. Kawamura. Characterization of branched alkyl end group of poly(methyl methacrylate) by pyrolysis-gas chromatography. Macromolecules 29: 4516–4519, 1996.
- 14) H. Ohtani, Y. Takehana, S. Tsuge. Quantification of end groups in anionically polymerized poly(methyl methacrylate)s by pyrolysis-gas chromatography. Macromolecules 30: 2542–2545, 1997.
- 15) T. Satoh, T. Sato, J. Tamura. Development of a high-performance MALDI-TOF mass spectrometer utilizing a spiral ion trajectory. J. Am. Soc. Mass Spectrom. 18: 1318–1323, 2007.
- 16) H. Sato, Y. Ishii, H. Momose, T. Sato, K. Teramoto. Application of high-resolution MALDI-TOFMS with a spiral ion trajectory for the structural characterization of free radical polymerized methacrylate ester copolymer. Mass Spectrom 2: A0014, 2013.
- 17) H. Sato, S. Nakamura, K. Teramoto, T. Sato. Structural characterization of polymers by MALDI spiral-TOF mass spectrometry combined with Kendrick mass defect analysis. J. Am. Soc. Mass Spectrom. 25: 1346–1355, 2014.
- 18) T. Iura, H. Ohtani. Fragmentation behavior of poly(methyl methacrylate) during matrix-assisted laser desorption/ionization. Rapid Commun. Mass Spectrom., in press.