Review
MALDI Matrix Research for Biopolymers
2015 年 4 巻 1 号 p. A0037
詳細
2015 年 4 巻 1 号 p. A0037
Matrices are necessary materials for ionizing analytes in matrix-assisted laser desorption/ionization-mass spectrometry (MALDI-MS). The choice of a matrix appropriate for each analyte controls the analyses. Thus, in some cases, development or improvement of matrices can become a tool for solving problems. This paper reviews MALDI matrix research that the author has conducted in the recent decade. It describes glycopeptide, carbohydrate, or phosphopeptide analyses using 2,5-dihydroxybenzoic acid (2,5-DHB), 1,1,3,3-tetramethylguanidinium (TMG) salts of p-coumaric acid (CA) (G3CA), 3-aminoquinoline (3-AQ)/α-cyano-4-hydroxycinnamic acid (CHCA) (3-AQ/CHCA) or 3-AQ/CA and gengeral peptide, peptide containing disulfide bonds or hydrophobic peptide analyses using butylamine salt of CHCA (CHCAB), 1,5-diaminonaphthalene (1,5-DAN), octyl 2,5-dihydroxybenzoate (alkylated dihydroxybenzoate, ADHB), or 1-(2,4,6-trihydroxyphenyl)octan-1-one (alkylated trihydroxyacetophenone, ATHAP).
Matrix-assisted laser desorption/ionization (MALDI)-mass spectrometry1,2) and electrospray ionization (ESI)-mass spectrometry3) are indispensable analytical tools for biopolymers. In MALDI, target analytes are mixed with matrices and then ionized by irradiating with ultraviolet (UV) or infrared lasers. The choice of an appropriate matrix for each analyte thus controls the analyses.
Generally, biopolymers are decomposed by UV laser irradiation. However, the analytes are ionized without decomposition by mixing with a large excess of MALDI matrices absorbing UV light and desorbing by themselves on a MALDI sample plate.
In 1988, Tanaka et al. reported glycerin with ultrafine metal powder for ionizing proteins up to 10,000 Da with a UV laser.1) Around the same time, M. Karas and F. Hillenkamp reported nicotinic acid as a UV-MALDI matrix to ionize proteins exceeding 10,000 Da.2,4) Subsequently, sinapinic acid (SA),5,6) 2,5-dihydroxybenzoic acid (2,5-DHB),7,8) and α-cyano-4-hydroxycinnamic acid (CHCA),9) which have been used as conventional matrices to date, were reported.
CHCA, SA, and 2,5-DHB have been particularly used for peptides, proteins, and carbohydrates, respectively. Generally, matrices absorb UV light and ionize analytes. The chemical structure of the common matrices thus consists of a benzene ring absorbing UV light, hydroxyl groups that facilitate mixing with hydrophilic biomolecules, and a carboxy group working as a proton donor. Based on these properties, several matrices have been developed. However, the development has depended on the trial-and-error method, usually by comparing novel matrices with conventional ones for each analytical purpose.
Liquid matrices that maintain their liquid states in vacuum, introduced by Armstrong et al.,10) have been reported to both make a homogeneous spot and improve sensitivity and reproducibility compared with conventional solid matrices that maintain their solid states in vacuum.10–28) Generally, liquid matrices consist of a basic amine like butylamine and an acidic compound like a conventional matrix such as CHCA, SA, or 2,5-DHB.11)
This paper reviews MALDI matrix research the author has conducted in the last decade. The matrices or matrix additives reported in this review are listed in Table 1. The paper describes glycopeptide, carbohydrate, or phosphopeptide analyses using 2,5-DHB,29) 1,1,3,3-tetramethylguanidinium (TMG) salts of p-coumaric acid (CA) (G3CA),12) 3-aminoquinoline (3-AQ)/CHCA (3-AQ/CHCA),13) 3-AQ/CA,14) and gengeral peptide, peptide containing disulfide bonds or hydrophobic peptide analyses using butylamine salt of CHCA (CHCAB),15) 1,5-diaminonaphthalene (1,5-DAN),30) octyl 2,5-dihydroxybenzoate (alkylated dihydroxybenzoate, ADHB),31,32) and 1-(2,4,6-trihydroxyphenyl)octan-1-one (alkylated trihydroxyacetophenone, ATHAP).33)
| Name (abbreviation) | Structure | Matrix/Matrix additive (novel/reported) | Analytes (in the ref.) | Characteristics/Applications | Ref. |
|---|---|---|---|---|---|
| For glycopeptides, carbohydrates, phosphopeptides | |||||
| 2,5-DHB |  | Solid matrix (reported) | Glycopeptides | Rapid analyses of glycopeptides by MSn of the [M+Na]+ and [M+H]+. | 29 |
| G3CA |  | Liquid matrix (novel) | Glycopeptides, carbohydrates | High sensitive analyses and suppression of dissociation for labile regions such as sulfate groups and sialic acids of carbohydrates from a homogeneous matrix-analyte spot. | 12 |
| 3-AQ/CHCA |  | Liquid matrix (reported) | Phosphopeptides | High sensitive analyses of phosphopeptides by optimized preparation methods on a MALDI focusing plate using the matrix. | 13 |
| 3-AQ/CA |  | Liquid matrix (novel) | Glycopeptides, carbohydrates, phosphopeptides | High sensitive analyses and suppression of dissociation for labile regions such as phosphate groups and sialic acids on a MALDI focusing plate. | 14 |
| For general peptides, peptides containing disulfide bonds, hydrophobic peptides | |||||
| CHCAB |  | Ionic liquid matrix (reported) | Peptides | High sensitive and reproducible (spot-to-spot and shot-to-shot) analyses from homogeneous matrix-analyte spot by adding methanol on a MALDI focusing plate. | 15 |
| 1,5-DAN |  | Solid matrix (reported) | Peptides containing disulfide bonds | Rapid sequencing by reduction reaction of disulfide bonds. | 30 |
| ADHB |  | Solid matrix additive (novel) | Hydrophobic peptides | High sensitive analyses by enrichment of hydrophobic peptides in the rim of a matrix-analyte spot. | 31, 32 |
| ATHAP |  | Solid matrix (novel) | Hydrophobic peptides | High sensitive analyses and preferential ionization of hydrophobic peptides from a homogeneous matrix-analyte spot. | 33 |
Glycoproteins are known to account for many proteins and to play important roles in biological processes. Their analysis has been difficult because so much information, such as peptide sequence, carbohydrate sequence, glycosylation sites, isomeric form, and heterogeneity, is needed. Each piece of information has been separately obtained. For example, glycopeptides have been divided into peptides and carbohydrates by peptide-N-glycosidase F followed by analysis with MALDI-MS or ESI-MS.
To solve this problem, a study of glycopeptides analyses was carried out to obtain information regarding (i) peptide sequence, (ii) carbohydrate sequence, and (iii) glycosylation site using the MSn function of a MALDI-quadruple ion trap-time-of-flight mass spectrometer (MALDI-QIT-TOFMS) and a matrix 2,5-DHB. The 2,5-DHB matrix is especially useful for carbohydrates and peptides. Carbohydrates have greater affinity for metal ions than do protons, and peptides have greater affinity for protons than do metal ions. Thus, glycopeptides have the potential to be detected as both protonated molecules and sodium adducts using 2,5-DHB. MSn of the protonated molecules was expected to provide information regarding peptides, and MSn of the sodium adducts was expected to provide information regarding carbohydrates.
Ribonuclease B (RNase B) Lys-C digest was evaluated by MALDI-QIT-TOFMS using 2,5-DHB. In MS, eight peptide ion species were detected as protonated molecules, and five ion species were detected at an interval of 162 Da (Fig. 1a). Each ion species was accompanied by a 22 Da higher mass ion species (Fig. 1b). The former were estimated to be protonated molecules; the latter were sodium adducts. MS/MS of the former (protonated molecules) yielded product ions by cleavage of glycosyl bonds at m/z 1000 or above and by cleavage of peptide bonds at m/z 1000 or lower. For example, MS/MS of the former (protonated molecules) at m/z 1934.8 yielded five product ion peak species at an interval of 162 Da (hexose), and species at intervals of 203 Da (HexNAc) at m/z 921.5 and 120 Da (0,2X ring cleavage of HexNAc) at m/z 801.5 (Fig. 1c). MS3 of the ions at m/z 921.5 or m/z 801.5 gave b5, b4, b3, b2, and [b3-203]+ ([b3-HexNAc]+) (Fig. 1e). These indicate that the glycosylation site is an asparagine (Asn: N) of the peptide. The peptide sequence and glycosylation site of the glycopeptides were thus obtained by MSn of the protonated molecules. In contrast, MS/MS of the latter (sodium adduct) at m/z 1957.8 yielded product ions at m/z 943.5 and 823.4 corresponding to HexNAc-attached peptide ions as sodium adducts (Fig. 1d). In addition, it yielded a product ion peak at the interval of peptide molecules and then at the intervals of 83 Da at m/z 1156.4 and 120 Da at m/z 1036.5 (0,2A ring cleavage of HexNAc) (Fig. 1d). MS3 and MS4 of the ions at m/z 1156.4 yielded Y/B-ions from the reductive terminal of the glycans (Fig. 1f). MS4 of the ions at m/z 1036.5 yielded Y/B-ions from their nonreducing terminals (Fig. 1f). These indicate that carbohydrate sequence information of the sodium adducts was obtained by MSn.

Asterisks in the (a) indicate the ion species detected at interval of 162 Da. [Reproduced from ref. 29 with Copyright permission of The Mass Spectrometry Society of Japan.]
For glycopeptides, the peptide sequence and glycosylation site were analyzed by MSn of the protonated molecules, and the carbohydrate sequence was obtained by MSn of the sodium adduct using 2,5-DHB. The effect is based on 2,5-DHB’s ability to ionize both peptides or protonated molecules and oligosaccharides or sodium adducts. The advantage of this method is that information regarding both the peptide and the oligosaccharides are obtained from a matrix-analyte dried spot by a mass spectrometer without a separation process. This simplifies pretreatment, thus achieving rapid glycosylation analyses.
G3CA for carbohydrates12)In MALDI-MS, sulfated and sialylated oligosaccharide analyses were problematic because labile sulfate groups and/or sialic acids were frequently dissociated during MS or MSn measurement. Thus, few intact molecular ions were detected. 2,5-DHB is a conventional “cool” matrix that has been most widely used for carbohydrates and glycopeptides. A weak point of 2,5-DHB is the formation of inhomogeneous needle-shaped crystals with the result that the analytes are ionized in a few small areas of a matrix-analyte dried spot called “sweet spots” or “hot spots.” This has made analyses using 2,5-DHB difficult because of the long measurement time required to find the sweet spot and poor reproducibility.
Ionic liquid matrices (ILMs) introduced by Armstrong et al.10) were reported to have the ability to make a homogeneous matrix-analyte spot and to ionize analytes. The essential point is that an ILM consists of a conventional solid MALDI matrix (e.g., CHCA, 2,5-DHB, or SA) and an organic base (e.g., tributylamine, pyridine, or 1-methylimidazole) which enables a relative state of “liquidity” under vacuum conditions.11) The homogeneity of ILMs leads to high throughput and reproducible analyses. Several ILMs have been reported for biopolymers and synthetic polymers, but there are only a few ILMs for carbohydrates. In particular, the sensitivity of carbohydrates using ILMs has been restricted to the picomole (pmol) level, while the sensitivity of peptide analyses had been reported as low as the femtomole (fmol) or attomole (amol) level. Higher sensitivity is thus required when considering further improvements of ILMs as alternatives to conventional solid matrices. Laremore et al. reported 1,1,3,3-tetramethylguanidinium (TMG) salts of CHCA (G2CHCA) as the most useful ILM for sulfated oligosaccharides.26,27) It effectively suppressed dissociation of sulfate groups. However, its sensitivity was limited to 10 pmol or more.
We demonstrated highly sensitive detection of sulfated, sialylated, or neutral oligosaccharides by optimizing a newly synthesized TMG salt of p-coumaric acid (CA) (G3CA) and the existing G2CHCA. G3CA was synthesized by exchanging CHCA for CA of G2CHCA.26,27) CA has little ionizing ability and is hydrophilic. Thus, it was expected to improve the sensitivity of carbohydrates and suppress dissociation as with a homogeneous matrix-analyte spot.
G3CA was prepared by mixing CA with TMG in methanol at 1 : 3 (mol/mol) at 10 mg/mL. G2CHCA was synthesized by mixing CHCA with TMG at 1 : 2. The oligosaccharides listed in Table 2 were dissolved in water. The analyte solution and the matrix solution were mixed on a mirror-polished stainless-steel MALDI plate to be analyzed by MALDI-QIT-TOFMS.
| Analytes | Sensitivity improvement rate (fold) | |||||||
|---|---|---|---|---|---|---|---|---|
| No. | Name | FW | [M+Na]+ | [M−Na]− | ||||
| 2,5-DHB | G2CHCA | G3CA | 2,5-DHB | G2CHCA | G3CA | |||
| 1 | Neocarratetraose-41,3-di-O-sulfate (2Na+) | 834.6 | 1000 | 100 | 1 | 100 | 10 | 1 |
| 2 | Neocarrahexaose-41,3,5-tri-O-sulfate (3Na+) | 1242.9 | 1000 | 10 | 5 | 100 | 1 | 1 |
| 3 | Neocarrahexaose-24,41,3,5-tetra-sulfate (4Na+) | 1345.0 | ND | 100 | 10 | 1000 | 10 | 1 |
| 4 | Neocarradodecaose-41,3,5,7,9,11-hexa-sulfate (6Na+) | 2467.9 | ND | 10 | 1 | ND | 1 | 1 |
a) The highest sensitivity is shown for each analysis when 1–1000 fmol/well of analytes were analyzed. ND indicates that analyte molecular ions were not detected.
The ion intensity distributions of [M−Na]− for analytes-1 in Table 2 on a matrix-analyte spot using G3CA, G2CHCA, or 2,5-DHB were compared to confirm homogeneity (Fig. 2). The ions were uniformly detected across the spot using G3CA or G2CHCA compared with 2,5-DHB, whereas they were detected in only a few small sweet spots using 2,5-DHB. Suppression of the dissociation of labile regions was investigated by assessing the extent of dissociation of sulfate groups or sialic acids. All dissociation was suppressed using G3CA or G2CHCA compared with 2,5-DHB. G3CA was more effective than G2CHCA (Fig. 3). Sensitivity was evaluated by comparing the detection limits of [M+Na]+ or [M−Na]− for 1 to 1000 fmol/well of sulfated, sialylated, or neutral oligosaccharides. For sulfated oligosaccharides, molecular ions were detected with higher sensitivity using G3CA or G2CHCA, especially G3CA, compared with 2,5-DHB (Table 2). Sensitivity was improved 10-fold or more using G3CA or G2CHCA compared with 2,5-DHB and 1000-fold or more using G3CA. Sialylated and neutral oligosaccharides were detected with the same or higher sensitivity using G3CA or G2CHCA compared with 2,5-DHB. All of the oligosaccharides were analyzed at the fmol level using G3CA or G2CHCA.


The novel liquid matrix G3CA suppressed dissociation of labile regions and improved sensitivity for sulfated, sialylated, and neutral oligosaccharides. It also improved the homogeneity of the matrix-analyte spot. These results demonstrate that MALDI-MS for carbohydrates was enhanced to almost the same high sensitivity level as peptide analyses.
Optimized sample preparation using 3-AQ/CHCA for phosphopeptides13)Kolli et al. introduced a liquid matrix 3-aminoquinoline (3-AQ)/α-cyano-4-hydroxycinnamic acid (CHCA) in 1996.18) It has been validated for peptides and proteins,19,20,25) oligosaccharides,21–23) and glycopeptides,24) but it has not been validated for phosphopeptides. Thus, we optimized our sample preparation method using 3-AQ/CHCA for phosphopeptides.
The optimized preparation is as follows. 3-AQ/CHCA was prepared by dissolving 3-AQ (20 mg) in 150 μL of CHCA solution in which CHCA (10 mg) was dissolved in 600 μL of acetonitrile (ACN)/water (50 : 50, v/v) with 200 mM ammonium dihydrogen phosphate (ADP). The obtained 3-AQ/CHCA was diluted ten times with ACN/water (50 : 50, v/v). Phosphopeptides were dissolved in ACN/water/TFA (50 : 50 : 0.1, v/v/v). The matrix solution and the analyte solution were mixed at 1 : 1 (v/v), and the obtained mixture was deposited on a focus MALDI plate. The sensitivity of the phosphorylated peptides was evaluated by using MALDI-QIT-TOFMS.
The result is summarized in Table 3. The sensitivity of mono- and tetraphosphopeptides was improved 10- to 10000-fold with the optimized preparation method using 3-AQ/CHCA compared with conventional methods using 2,5-DHB. The improvement due to 3-AQ/CHCA itself was 10-fold. The factors affecting sensitivity improvement using 3-AQ/CHCA were (i) ACN in the analyte solution, (ii) the focus MALDI plate, and (iii) ADP in the matrix solution. The sensitivity of mono- and tetraphosphopeptides were improved 10-fold by (i), 100-fold for tetraphosphopeptides by (ii), and 10-fold for tetraphosphopeptides by (iii). The sensitivity improvement was 10-fold higher for isolated peptides than in digests, probably due to the suppression of ionization by contaminating compounds. It was also greater for peptides with more phosphorylation residues. The improvement by ADP was due to suppression of chemical noise by scavenging metal ions such as salts.
| Phosphopeptides | Detection limit (fmol/well) | |||||||||
|---|---|---|---|---|---|---|---|---|---|---|
| [M+H]+ | ||||||||||
| 3-AQ/CHCA | 2,5-DHB | Improvement by 3-AQ/CHCA to 2,5-DHB-(3) (fold) | ||||||||
| No.b) | BB Indexc) | Phospho-sites | [M+H]+ m/z | Focus plate (NH4)3PO4 | (1) SUS plate no additive | (2) Focus plate no additive | (3) Focus plate (NH4)3PO4 | |||
| 1 | β-Casein 33–48 | Isolated | +6200 | 1 | 2061.8 | 0.1 | 1 | 1 | 1 | 10 |
| 2 | β-Casein 1–25 | Isolated | −120 | 4 | 3122.3 | 0.1 | 1000 | 10 | 1 | 10 |
| 1* | β-Casein 33–48 | Digests | +6200 | 1 | 2061.8 | 1 | 1 | 1 | 1 | 1 |
| 2* | β-Casein 1–25 | Digests | −120 | 4 | 3122.3 | 1 | 100 | 10 | 1 | 1 |
| 3 | Ovalbumin 341–360 | Digests | +4230 | 1 | 2088.9 | 0.1 | 10 | 1 | 1 | 10 |
| 4 | Ovalbumin 60–85 | Digests | +1430 | 1 | 2901.3 | 0.1 | 10 | 10 | 1 | 10 |
| 5 | IRK-3 | Isolated | −1590 | 1 | 1702.8 | 1 | 1 | 1 | 1 | 1 |
| 6 | IRK-1 | Isolated | −1590 | 3 | 1862.8 | 1 | 10 | 10 | 1 | 1 |
a) The detection limit of phosphopeptides was evaluated as described in Experiment section in ref. 13. Sensitivity improvement is determined by dividing the detection limit using the conventional method-(1), -(2), or -(3) with 2,5-DHB by that using the optimized method with 3-AQ/CHCA. b) Peptide-1* and -2* denote peptide-1 and -2 in digests, respectively. c) The BB Index of phosphopeptides is calculated by changing the phosphoserine residues to glutamic acid.34,35)
The improvement due to 3-AQ/CHCA was determined based on an MS image in which hydrophilic unphosphorylated peptides and phosphopeptides were detected in a small area of a matrix-analyte droplet spot. The small area is a sweet spot of hydrophilic peptides with or without phosphorylation. In contrast, hydrophobic unphosphorylated peptides were detected in another larger area of the spot. These results suggest that 3-AQ/CHCA separates the hydrophilic peptides into the small area and the hydrophobic peptides into another area of a matrix-analyte droplet spot. This property of 3-AQ/CHCA corresponds to the result by Sekiya et al.,24) in which glycopeptides were ionized in a small central area of a matrix-analyte droplet spot, and the report by Kjellström et al.,34) in which the signal of hydrophilic phosphopeptides was enhanced in an aqueous phase area. It was confirmed that using 3-AQ/CHCA, hydrophilic peptides are enriched in a smaller sweet spot of a matrix-analyte droplet spot and thus are detected with higher sensitivity.
3-AQ/CA for glycopeptides, carbohydrates, and phosphopeptides14)Glycosylation and phosphorylation are important post-translational modifications in biological process and biomarker research. The difficulty in analyzing these modifications is mainly their low abundance and dissociation of labile regions such as sialic acids or phosphate groups. One solution in MALDI-MS is to improve the matrices for glycopeptides, carbohydrates, and phosphopeptides by increasing the sensitivity and suppressing dissociation of the labile regions. A liquid matrix 3-AQ/CHCA has been reported to increase sensitivity for carbohydrates21–23) and phosphopeptides,13) but it has not been systematically evaluated for glycopeptides. In addition, 3-AQ/CHCA enhances the dissociation of labile regions. In contrast, a liquid matrix 1,1,3,3-tetramethylguanidinium (TMG, G) salt of p-coumaric acid (CA) G3CA12) was reported to suppress dissociation of sulfate groups or sialic acids of carbohydrates compared with a TMG salt of CHCA (G2CHCA).26,27) The greater suppression using G3CA compared with G2CHCA probably depends on the difference between CA and CHCA. Thus, we introduce a novel matrix 3-AQ/CA consisting of 3-AQ and CA for glycopeptides, carbohydrates, and phosphopeptides to improve sensitivity and suppress the dissociation of labile regions. CA, which is hydrophilic, is expected to have a greater affinity for hydrophilic compounds than CHCA and to suppress dissociation of labile regions like G3CA.
The sensitivity and suppression of dissociation of labile regions were evaluated for the glycopeptides, carbohydrates, and phosphopeptides listed in Table 4 using 3-AQ/CA compared with 3-AQ/CHCA or 2,5-DHB. 3-AQ/CA was prepared as follows. 3-AQ and CA were dissolved separately in ACN/water (50 : 50, v/v) with ADP (2 mM or 20 mM) at 100 nmol/μL. The 3-AQ solution and the CA solution were then mixed at 9 : 1 (v/v) and used as a matrix. Glycopeptides and carbohydrates were dissolved in water and phosphopeptides were dissolved in ACN/water (50 : 50, v/v). The matrix solution and the analyte solution or the mixture solution of matrices and analytes were deposited on a focus MALDI plate. Measurements were performed using MALDI-QIT-TOFMS.
| No. | Name | [M+H]+ (m/z, Ave.) | Structure |
|---|---|---|---|
| Glycopeptides | |||
| Sialoglycopeptides | |||
| 1 | Transferrin GP1 | 3683.7 |  |
| 2 | Transferrin GP2 | 4723.8 |  |
| 3 | Fetuin GP1 | 4605.6 | 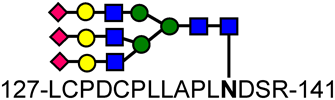 |
| 4 | Fetuin GP2 | 3949.0 |  |
| 5 | Fetuin GP3 | 6537.7 |  |
| Asialoglycopeptides | |||
| 6 | Asialotransferrin GP1 | 3102.7 |  |
| 7 | Asialotransferrin GP2 | 4142.8 |  |
| 8 | Asialofetuin GP1 | 3733.6 |  |
| 9 | Asialofetuin GP2 | 3367.0 |  |
| 10 | Asialofetuin GP3 | 5664.7 |  |
| Carbohydrates | |||
| Sialoglycans | |||
| 11 | A1 glycan | 2010.7 |  |
| 12 | A2 glycan | 2301.8 |  |
| Neutral glycans | |||
| 13 | NA2 glycan | 1719.6 |  |
| 14 | NA4 glycan | 2449.8 |  |
| Phosphopeptides | |||
| 15 | β-Casein 33–48 | 2061.8 | FQ-pS-EEQQQTEDELQDK |
| 16 | β-Casein 1–25 | 3122.3 | RELEELNVPGEIVE-pS-L-pS-pS-pS-EESITR |
 , N-acetylglucosamine: GlcNAc;
  , galactose;
  , mannose;
  , N-acetyl-neuraminic acid: NANA; PA, aminopyridine.
Comparison of the dissociation of labile regions such as sialic acids, phosphorylated groups, and fragmentation of neutral carbohydrates using 3-AQ/CA, 3-AQ/CHCA, and 2,5-DHB revealed that dissociation and fragmentation were suppressed more using 3-AQ/CA than with 3-AQ/CHCA or 2,5-DHB (Fig. 4). In addition, the sensitivity for glycopeptides, carbohydrates, and phosphopeptides was higher using 3-AQ/CA compared with 3-AQ/CHCA or 2,5-DHB (Table 5). The sensitivity using 3-AQ/CA was especially improved for sialoglycopeptides and sialylated glycans.

[Reproduced from ref. 14 with Copyright permission of American Chemical Society.]
| No. | Name | Detection limit (fmol/well) | |||||
|---|---|---|---|---|---|---|---|
| [M+H]+ | [M−H]− | ||||||
| 3-AQ/CA | 3-AQ/CHCA | 2,5-DHB | 3-AQ/CA | 3-AQ/CHCA | 2,5-DHB | ||
| Glycopeptides | |||||||
| Sialoglycopeptides | |||||||
| 1 | Transferrin GP1 | 10 | 10 | 100 | 1 | 1 | 10 |
| 2 | Transferrin GP2 | 10 | 100 | 100 | 10 | 10 | 100 |
| 3 | Fetuin GP1 | 10 | 100 | 100 | 10 | 10 | 100 |
| 4 | Fetuin GP2 | 100 | 100 | 1000 | 10 | 100 | 100 |
| 5 | Fetuin GP3 | 1000 | — | — | 100 | 1000 | — |
| Asialoglycopeptides | |||||||
| 6 | Asialotransferrin GP1 | 1 | 1 | 1 | 1 | 1 | 1 |
| 7 | Asialotransferrin GP2 | 1 | 1 | 1 | 1 | 1 | 10 |
| 8 | Asialofetuin GP1 | 0.1 | 0.1 | 0.1 | 0.1 | 0.1 | 1 |
| 9 | Asialofetuin GP2 | 0.01 | 0.1 | 0.1 | 0.1 | 0.1 | 1 |
| 10 | Asialofetuin GP3 | 0.1 | 1 | 10 | 0.1 | 1 | 10 |
| Carbohydrates | |||||||
| Sialoglycans | |||||||
| 11 | A1 glycan | 1 | 1 | 100 | 0.1 | 0.1 | 100 |
| 12 | A2 glycan | 1 | 1 | 100 | 1 | 1 | 100 |
| Neutral glycans | |||||||
| 13 | NA2 glycan | 0.1 | 1 | 1 | 1 | 1 | 10 |
| 14 | NA4 glycan | 1 | 1 | 10 | 1 | 1 | 10 |
| Phosphopeptides | |||||||
| 15 | β-Casein 33–48 | 1 | 1 | 1 | 1 | 1 | 1 |
| 16 | β-Casein 1–25 | 1 | 1 | 10 | 1 | 1 | 10 |
a) The detection limit for glycopeptides, carbohydrates, and phosphopeptides using 3-AQ/CA, 3-AQ/CHCA, and 2,5-DHB in positive- and negative-ion modes. The detection limit was defined as the lowest quantity of analyte detected as [M+H]+ or [M−H]− with S/N>2 within an error ratio of 25% at different concentrations made by 10-fold serial dilutions. “—” indicates that no ions were detected for that analyte at ≤1000 fmol.
The sensitivity improvement with 3-AQ/CA can be explained by its difference from 3-AQ/CHCA, that is, the difference between CHCA and CA as a counter ion. CHCA is known to be a high-ionization, versatile matrix and to be hydrophobic, unlike CA. However, CA has difficulty ionizing analytes and is hydrophilic. Hydrophilic compounds such as glycopeptides, carbohydrates, and phosphopeptides have higher affinity for 3-AQ/CA than 3-AQ/CHCA. Thus, the analytes are concentrated in a small area of the matrix-analyte droplet spot using 3-AQ/CA, as much or more as reported for 3-AQ/CHCA. The suppression of dissociation of labile regions with 3-AQ/CA is probably explained by the fact that 3-AQ/CHCA consists of CHCA, a “hot” matrix that facilitates fragmentation and dissociation, and 3-AQ/CA consists of CA, which hardly ionizes and has an affinity for hydrophilic compounds, thus forming a cool liquid matrix like G3CA. In conclusion, 3-AQ/CA is one of the most effective MALDI matrices for glycosylation and phosphorylation analyses.
Matrices or matrix additives for gengeral peptides, peptides containing disulfide bonds, and hydrophobic peptidesOptimized sample preparation using CHCAB for highly sensitive and reproducible analyses15)Biomarker analyses with MS are expected to be highly sensitive, quantitative, reproducible, and rapid. The difficulty in achieving quantitative and reproducible analyses in MALDI-MS is largely because of inhomogeneous matrix-analyte crystallization and short-term durability of ionization using conventional solid matrices.11) Several advantages of liquid matrices including homogeneity, reproducibility, durability of ionization, sensitivity, and suppression of dissociation in labile regions have been reported.10–28) α-Cyano-4-hydroxycinnamic acid butylamine salt (CHCAB) was introduced by Mank et al. in 2004.16) It had higher shot-to-shot and spot-to-spot reproducibility than CHCA. However, the sensitivity using CHCAB was significantly (1000-fold) lower than that using CHCA. Mank et al. proposed using a focus MALDI plate to improve the sensitivity but have not demonstrated this. Thus, we proposed preparing CHCAB using a focus MALDI plate to achieve highly sensitive and reproducible analyses. Conditions for forming a homogeneous matrix-analyte spot in a small hydrophilic area on a focus MALDI plate were optimized.
CHCAB was purchased from Sigma-Aldrich. Standard peptides were dissolved in ACN/water/TFA (27 : 73 : 0.05, v/v/v). CHCAB was dissolved in ACN/water/TFA (50 : 50 : 0.05, v/v/v) that we had optimized at 1 mg/mL. CHCA was dissolved in ACN/water/TFA (50 : 50 : 0.05, v/v/v) at 3 mg/mL as the manufacturer suggested. The analyte solution and the matrix solution were mixed on a commercial focus MALDI plate (Hudson Surface Technology, Inc., USA). MeOH (1 μL) was added to the matrix-analyte spot after volatilization of extra solvent. The obtained matrix-analyte spots were analyzed by MALDI-TOFMS.
MS images of the matrix-analyte spot using CHCAB before and after adding MeOH on the focus MALDI plate were compared. Numerous small liquid particles were scattered across the focusing area on the plate using CHCAB, in which the analyte ions were partially detected. However, the small liquid particles were brought into the focusing area by adding MeOH, after which ions were detected throughout the entire spot. The focusing area was paved with numerous small liquid particles using CHCAB+MeOH, which differs from using CHCA+MeOH or CHCA. The particles were 20 μm in diameter, which is smaller than the laser irradiating area (ca. 100 μm). Thus, the MS images depicted a macroscopically homogeneous matrix-analyte spot. In addition, the sensitivity using CHCAB+MeOH was comparable to that using CHCA+MeOH or CHCA, which was at the fmol level, suggesting that the issue of sensitivity using CHCAB had been solved.
Figure 5 indicates the durability of ionization using CHCAB+MeOH or CHCA+MeOH. The data were obtained from a single spot near the center of the matrix-analyte spot using CHCAB+MeOH or CHCA+MeOH. Using CHCAB+MeOH, peptide ions were continuously detected for 500 laser shots. In contrast, the ions were detected for 20 shots using CHCA+MeOH. Longer-term ionization was thus achieved using CHCAB+MeOH than using CHCA+MeOH. The effect of CHCAB was observed at 1 to 100 fmol over the entire matrix-analyte spot for all three peptides. Consequently, CHCAB+MeOH enabled the detection of peptides throughout the entire matrix-analyte spot with long-term ionization.

Ion signal intensity (a.u.) averaged over five laser shots for [M+H]+ of ACTH 18–39 was accumulated. The data were obtained from a single spot near the center of each matrix-analyte spot. [Reproduced from ref. 15 with Copyright permission of John Wiley and Sons.]
CHCAB was demonstrated to achieve sensitivity comparable to that of CHCA using a focus MALDI plate by adding MeOH. Long-term ionization was also demonstrated, while maintaining shot-to-shot and spot-to-spot reproducibility as previously reported. The optimized preparation with CHCAB is expected to be used for quantitative MALDI analyses requiring highly sensitive and reproducible measurements.
Sequencing of peptides containing disulfide bonds using 1,5-DAN as a reductive matrix30)MS/MS is an indispensable analytical tool for amino acid sequencing of peptides. However, it is limited by the presence of disulfide bonds. Pretreatment such as digestion, chemical reduction, modification, or fractionation had been required to cleave disulfide bonds.36) In a mass spectrum of insulin consisting of A- and B-chains bridged by two disulfide bonds using 1,5-diaminonaphthalene (1,5-DAN) as a matrix (presented in the Fall workshop of the American Society of Mass Spectrometry in 1993), A-chain and B-chain ions were mainly detected.37) We focused on the potential of 1,5-DAN to reduce disulfide bonds for sequencing of peptides containing disulfide bonds.
To evaluate the reductivity of the matrices, insulin was analyzed using 1,5-DAN, 1,8-DAN, 2,3-DAN, and 2,5-DHB in MALDI-TOFMS. Insulin was mainly detected as intact molecular ions using 2,5-DHB, whereas A- and B-chain ions were detected using the DANs. All of the disulfide bonds were reduced using the DANs. Among the three isomers of DANs, A- and B-chain ions were detected with the highest intensity using 1,5-DAN. For the mixture of 1,5-DAN and insulin, no reduction, that is, only intact insulin was observed by high-performance liquid chromatography (in solution condition), but reduced A- and B-chains were observed in solvent-free sample preparation conditions (in vacuum condition). Thus, the reduction was considered to be caused by 1,5-DAN in vacuo in the mass spectrometer. In addition, 1,5-DAN matrix ions were detected at m/z 158.0 and 159.1 in positive-ion mode and at m/z 156.0 and 157.0 in negative-ion mode [the theoretical monoisotopic mass value of [M+H]+ ([M−H]−) for 1,5-DAN is 159.1 (157.1) Da]. The 2 Da loss from 1,5-DAN in negative-ion mode may be a product of the reductive reaction in Fig. 6. It likely also involves the increase of the oxidized ion peak of 1,5-DAN with insulin compared with that of 1,5-DAN alone.

[Reproduced from ref. 30 with Copyright permission of John Wiley and Sons.]
We applied the reductive property of 1,5-DAN to sequencing peptides containing disulfide bonds using MALDI-QIT-TOFMS. Human guanylin containing two disulfide bonds (M.W. 1458.7; C4–C12, C7–C15) was detected as [M+H]+ using 2,5-DHB but as [M+4+H]+ using 1,5-DAN. The MS/MS spectrum of the [M+H]+ was complex because of significant product ions possessing a different sulfur terminus on the cysteine residues (Fig. 7a). Three out of the fifteen residues were determined. In MS/MS of [M+4+H]+, product ions were detected as b-ions (Fig. 7b). For all of the product ions, disulfide bonds were reduced and the sequencing analysis was facilitated. Eleven out of fifteen residues were analyzed. It was confirmed that reductive property of 1,5-DAN is useful for rapid amino-acid sequencing of peptides containing disulfide bonds.

MS/MS was carried out with MALDI-QIT-TOFMS using (a) [M+H]+ and (b) [M+4+H]+ as precursor ions. * Ion peaks derived from dehydrated ion species. # Ion peaks derived from multiple internal cleavages. Superscript symbols on b-ions appear as follows: ', b-ions in which all disulfide bonds are retained; ", b-ions in which one disulfide bond is retained and the terminus of the cysteine residue is ‘SH’ i.e. thiol group; '", b-ions in which one disulfide bond is retained and the terminus of the cysteine residues is ‘S•’; "", b-ions in which a disulfide bond is cleaved and the terminus of the cysteine residues are ‘S•’; other b-ions indicate that all disulfide bonds are cleaved and the terminus of the cysteine residues are ‘SH’ i.e. thiol group. Symbols of amino acids in parentheses mean that they are usually impossible to obtain by de novo sequencing because disulfide bonds are retained, or the disulfide bonds are cleaved with the terminal of the cysteine residues as ‘S•’ or ‘SH.’ [Reproduced from ref. 30 with Copyright permission of John Wiley and Sons.]
Hydrophobic peptides are generally difficult to detect using MALDI-MS because the majority of matrices are hydrophilic and have a low affinity for hydrophobic peptides. To solve this problem, we have developed a novel matrix additive having affinity for hydrophobic peptides. Octyl 2,5-dihydroxybenzoate (alkylated dihydroxybenzoate, ADHB), which is a 2,5-DHB derivative incorporating a hydrophobic alkyl chain on the carboxy group, was introduced to achieve affinity for hydrophobic peptides.
ADHB was synthesized by Prof. Izumi et al. at Hiroshima University. A comparative evaluation of different alkyl chain lengths (C1, C4, C6, C8, C10, and C16) in the ADHB structure indicated that the octyl (C8) chain was the most effective for improving sensitivity for hydrophobic peptides. Hence, ADHB incorporating the octyl chain was used in the experiments described below. The ADHB solution was prepared in ACN/water/TFA (50 : 50 : 0.1, v/v/v) at 5 mg/mL. The CHCA solution was prepared in ACN/water/TFA (50 : 50 : 0.1, v/v/v) at 10 mg/mL. The ADHB solution and the CHCA solution were mixed at 1 : 10 (v/v). The analyte solution and the matrix mixture solution containing ADHB were mixed on a stainless-steel plate. Measurement was performed using MALDI-TOFMS.
In a comparison of the mass spectra of an equimolar mixture of hydrophobic and hydrophilic peptides (humanin with SSRCalc Hydrophobicity 50.0 and β-amyloid 1–11 with SSRCalc Hydrophobicity 13.5) using CHCA+ADHB, CHCA or ADHB, the hydrophobic peptide was detected with higher intensity than the hydrophilic peptide using CHCA+ADHB, whereas the hydrophilic peptide was detected with higher intensity using CHCA. Neither hydrophobic nor hydrophilic peptides were detected using ADHB. These results indicate that ADHB contributes to an intensity increase of the hydrophobic peptides as a matrix additive.
Figure 8 presents MS images of the hydrophobic and hydrophilic peptides, CHCA and ADHB using CHCA+ADHB or CHCA. Using CHCA+ADHB, the hydrophobic peptide was detected mainly on the rim of the matrix-analyte dried spot, and the hydrophilic peptide was detected throughout the entire spot, with the exception of the rim. In contrast, using CHCA, both the hydrophobic and hydrophilic peptides were detected throughout the entire spot. Additionally, ADHB itself was detected mainly in the rim of the spot, and CHCA itself was detected throughout the entire spot. These results imply that the hydrophobic peptides were enriched using ADHB as a matrix additive.

[Reproduced from refs. 31, 32 with Copyright permission of American Chemical Society.]
Table 6 indicates the sensitivity improvement rate for fourteen peptides with different hydrophobicity (SSRCalc Hydrophobicity 5.2 to 54.8) along with MS images using CHCA+ADHB compared with CHCA. The result indicates that the sensitivity of hydrophobic peptides (SSRCalc Hydrophobicity 45.2 to 54.8) was improved by ADHB. In addition, hydrophobic peptides were detected in the rim of the matrix-analyte dried spot. The same results were observed for phosphorylase b tryptic digestion.
| Peptides | Sensitivity improvement rate (fold)b) | MS imagingc) | ||||
|---|---|---|---|---|---|---|
| No. | Name | SSRCalc Hydrophobicity | m/z (Av.) | CHCA+ADHB | CHCA | |
| 1 | NF-κB inhibitor | 54.8 | 2782.5 | 100 |  |  |
| 2 | Melittin, honey bee | 53.8 | 2847.5 | 10 |  |  |
| 3 | β-Amyloid 1–42 | 51.1 | 4515.1 | 100 |  |  |
| 4 | OVA-BIP hybrid peptide | 50.2 | 2291.5 | 100 |  |  |
| 5 | Humanin | 50.0 | 2688.2 | 100 |  |  |
| 6 | [Gly14]-Humanin | 49.5 | 2658.2 | 10 |  |  |
| 7 | Temporin A, amide | 45.6 | 1397.8 | 10 |  |  |
| 8 | MPGΔNLS | 45.2 | 2767.2 | 10 |  |  |
| 9 | β-Amyloid 22–42 | 42.4 | 2000.3 | 1 |  |  |
| 10 | ACTH 18–39 | 37.9 | 2466.7 | 1 |  |  |
| 11 | β-Amyloid 1–28 | 36.3 | 3263.5 | 1 |  |  |
| 12 | β-Amyloid 1–11 | 13.5 | 1326.3 | 1 |  |  |
| 13 | GPHRSTPESRAAV | 10.6 | 1365.5 | 1 |  |  |
| 14 | β-Conglycinin 165–178 | 5.2 | 1848.8 | 1 |  |  |
a) Sensitivity improvement of fourteen peptides using CHCA+ADHB in positive-ion mode. b) The sensitivity improvement was calculated by dividing the detection limit using CHCA by that using CHCA+ADHB for differentially-analyzed peptides. c) MS images were created for each peptide in the fourteen 100 fmol peptide mixture analyses.
Sensitivity improvement using ADHB was considered as follows. In the MS images, ADHB itself was detected in the rim of the matrix-analyte dried spot and CHCA was detected throughout the entire spot (Fig. 8). ADHB does not dissolve in water but does dissolve in ACN. In a small matrix-analyte droplet of ACN/water (50 : 50, v/v) on a sample plate, ACN evaporates more rapidly than water and the water is left behind. In the process, ADHB is carried in ACN to the surface rim (the “coffee-ring effect”)38) with hydrophobic peptides having affinity with ADHB. The enriched hydrophobic peptides are detected with higher sensitivity than hydrophilic peptides using CHCA+ADHB.
ATHAP as a matrix for hydrophobic peptides33)In the previous section, ADHB was reported as a matrix additive31,32) for hydrophobic peptides. However, the following three issues remain with ADHB: (i) Hydrophobic peptides are detected on the rim of the matrix-analyte dried spot, so finding the sweet spot is difficult. (ii) ADHB is an additive, that is, it is unavailable without conventional matrices. (iii) Hydrophilic peptides ions are detected, so the detection of some hydrophobic peptides ions may be limited. To resolve these issues, we introduced the novel matrix 1-(2,4,6-trihydroxyphenyl)octan-1-one (alkylated trihydroxyacetophenone, ATHAP) for hydrophobic peptides. ATHAP is a 2,4,6-trihydroxyacetophenone derivative incorporating a hydrophobic alkyl chain on the acetyl group and thus was expected to have an affinity for hydrophobic peptides.
ATHAP was synthesized by Prof. Izumi et al. in Hiroshima University. A comparison of different acyl group chain lengths (C6, C8, C10, and C12 acyl groups) in the ATHAP structure indicated that the octanoyl (C8) or decanoyl (C10) group was the most effective for sensitivity improvement for hydrophobic peptides. Thus, C8-ATHAP was used below. The ATHAP solution was prepared in ACN/water/TFA (75 : 25 : 0.1, v/v/v) at 5 mg/mL. The CHCA or THAP solution was prepared in ACN/water/TFA (50 : 50 : 0.1, v/v/v) at 10 mg/mL. Peptides or protein digests were dissolved in ACN/water/TFA (50 : 50 : 0.1, v/v/v). The analyte solution and the matrix solution were mixed on a stainless-steel MALDI plate. Measurements were performed using MALDI-TOFMS.
An equimolar mixture of hydrophobic and hydrophilic peptides (humanin with SSRCalc Hydrophobicity 50.0, and β-amyloid 1–11 with SSRCalc Hydrophobicity 13.5) was analyzed using ATHAP, THAP, or CHCA. Only humanin was detected using ATHAP (Fig. 9), β-amyloid 1–11 and humanin were detected with comparable intensity using THAP, and β-amyloid 1–11 was detected with higher intensity than humanin using CHCA. These results indicate that ATHAP improves the detection of hydrophobic peptides and suppresses the detection of hydrophilic peptides. In the MS image of humanin using ATHAP, humanin was detected throughout the entire matrix-analyte spot (Fig. 9).

ND indicates that ions were not detected. [Reproduced from ref. 33 with Copyright permission of American Chemical Society.]
Table 7 compares ATHAP’s sensitivity improvement rate with that of CHCA, which was calculated by dividing the detection limit for peptides using CHCA by that using ATHAP. ATHAP improved the sensitivity of hydrophobic peptides with SSRCalc Hydrophobicity of 42.4 or higher 10-fold but decreased the sensitivity for hydrophilic peptides.
| Analytes | Sensitivity improvement rate (fold) | |||
|---|---|---|---|---|
| No. | Name | SSRCalc Hydrophobicity | m/z (Ave.) | |
| 1 | NF-κB inhibitor | 54.8 | 2782.6 | 10 |
| 2 | OVA-BIP hybrid peptide | 50.2 | 2291.6 | 10 |
| 3 | Humanin | 50.0 | 2688.3 | 10 |
| 4 | β-Amyloid 22–42 | 42.4 | 2000.4 | 10 |
| 5 | Catestatin | 38.1 | 2327.7 | 1 |
| 6 | ACTH 18–39 | 37.9 | 2466.7 | 1 |
| 7 | Nocistatin | 29.8 | 1928.1 | 1 |
| 8 | Neuropeptide S | 22.3 | 2188.5 | 0.1 |
| 9 | β-Amyloid 1–16 | 18.2 | 1956.1 | 0.1 |
| 10 | β-Amyloid 1–11 | 13.5 | 1326.3 | 0.001 |
| 11 | β-Conglycinin 165–178 | 5.2 | 1848.8 | 0.0001 |
a) Sensitivity improvement for peptides with SSRCalc Hydrophobicity from 5.2 to 54.8 using ATHAP, compared with CHCA in positive-ion mode. The sensitivity improvement rate was calculated by dividing the detection limit using CHCA by that using ATHAP.
In Table 8, the ion peaks corresponding to phosphorylase b Lys-C digests using ATHAP or CHCA are listed in order of SSRCalc Hydrophobicity. Ions for digests with SSRCalc Hydrophobicity of 30.4 or higher were detected using ATHAP, but ions for digests with SSRCalc Hydrophobicity of 25.8 or lower were not detected or were detected with a low S/N ratio. Ions for digests with SSRCalc Hydrophobicity of 33.4 or lower were detected using CHCA, but ions for digests with SSRCalc Hydrophobicity of 38.9 or higher were not detected or were detected with a low S/N ratio. These results demonstrate that hydrophobic digests were detected with higher intensity using ATHAP than using CHCA. In addition, hydrophobic peptides ions that could not be detected using CHCA were detected using ATHAP. Several hydrophilic digests were not detected using ATHAP.
| Phosphorylase b Lys-C digests | Detection (+/−) | |||
|---|---|---|---|---|
| No. | SSRCalc Hydrophobicity | m/z (Ave.) | ATHAP | CHCA |
| 1 | 55.9 | 3602.2 | ++ | − |
| 2 | 53.9 | 3823.5 | ++ | − |
| 3 | 53.1 | 3890.3 | ++ | − |
| 4 | 51.0 | 3823.5 | ++ | − |
| 5 | 50.7 | 2198.6 | ++ | + |
| 6b) | 45.8 | 2155.6 | ++ | + |
| 7b) | 45.1 | 2742.0 | + | + |
| 8b) | 42.8 | 2969.5 | + | − |
| 9 | 38.9 | 3504.9 | ++ | − |
| 10 | 35.1 | 1855.1 | ++ | ++ |
| 11 | 33.9 | 1657.0 | + | + |
| 12 | 33.6 | 2130.5 | ++ | − |
| 13 | 33.4 | 2629.0 | ++ | ++ |
| 14 | 31.4 | 1610.9 | ++ | ++ |
| 15 | 31.4 | 1814.1 | ++ | ++ |
| 16 | 31.2 | 1526.8 | ++ | ++ |
| 17b) | 30.9 | 2043.3 | ++ | ++ |
| 18 | 30.4 | 1942.3 | ++ | ++ |
| 19 | 29.9 | 2449.7 | − | + |
| 20 | 28.4 | 1304.7 | ++ | ++ |
| 21 | 25.8 | 1263.4 | − | ++ |
| 22 | 24.7 | 1178.3 | − | ++ |
| 23 | 24.5 | 1290.5 | + | ++ |
| 24b) | 18.9 | 1254.5 | + | ++ |
| 25c) | 9.3 | 1102.2 | − | ++ |
a) Ion detection for 1 pmol phosphorylase b Lys-C in-gel digests using ATHAP or CHCA in positive-ion mode. “++” indicates that the ions were detected with S/N≥5, “+” indicates that the ions were detected with S/N=2 to 5, and “−” indicates that no ions were detected. b) These peptides are carbamidomethylated and are not reflected in the SSRCalc Hydrophobicity. c) This peptide is acetylated, which is not reflected in the SSRCalc Hydrophobicity.
This study has demonstrated that the novel matrix ATHAP increased the sensitivity of hydrophobic peptides compared with CHCA. Peptide ions were detected throughout the entire matrix-analyte spot using ATHAP, but the detection of hydrophilic peptides was suppressed. ATHAP functioned alone as a matrix, unlike ADHB that functioned as an additive. Thus, all three issues of ADHB were solved using ATHAP. ATHAP is expected to expand the range of target analytes in MALDI-MS.
MALDI matrix research on a variety of biomolecules such as glycopeptides, carbohydrates, phosphopeptides, peptides containing disulfide bonds, and hydrophobic peptides has been described. All of the matrices and the analytical techniques using the matrices were developed as tools to solve specific issues in MALDI-MS. The growth of analytical techniques must keep up with the times, that is, must advance together with the growth of biology, medical science, engineering, and industry. Matrix research studies are expected to solve analytical problems as a tool and to timely provide appropriate techniques to the application field or field users.
This article is a review of “Development and improvement of MALDI matrices for biopolymer analyses,” awarded a Mass Spectrometry Society of Japan Research Award (May 15, 2014). The author thanks everyone involved at the Mass Spectrometry Society of Japan, Prof. Hiroshi Nonami at Ehime University, Prof. Rosa Erra-Balsells at the University of Buenos Aires, Prof. Yoshinao Wada at Osaka Medical Center and Research Institute for Maternal and Child Health, Prof. Shunsuke Izumi at Hiroshima University; Mr. Hidenobu Yamaoka, Dr. Noriyuki Ojima, Dr. Yuzo Yamazaki, Dr. Masaki Yamada, and Mr. Shuichi Nakaya at Shimadzu Corporation; and Mr. Koichi Tanaka, Mr. Shinichi Iwamoto, Mr. Shin-ichirou Kawabata, Dr. Sadanori Sekiya, Dr. Makoto Watanabe, Mr. Yusaku Hioki, Mr. Kenichi Taniguchi, Ms. Kaoru Kaneshiro, Dr. Takashi Nishikaze, Ms. Natsumi Funakoshi, Ms. Chihiro Nakajima, Mr. Kohei Takeyama, and Ms. Ritsuko Tanimura at the Koichi Tanaka Mass Spectrometry Research Laboratory and the Koichi Tanaka Laboratory of Advanced Science and Technology, Shimadzu Corporation. Some research was funded by the Japan Society for the Promotion of Science (JSPS) through the “Funding Program for World-Leading Innovative R&D on Science and Technology (FIRST Program),” initiated by the Council for Science and Technology Policy (CSTP).