Abstract
This study examined the delaying effect of fatigue crack growth induced by high-density electric current on A6061-T6 aluminum alloy. To investigate the effect, fatigue tests were conducted using specimens with and without electric current treatment. The fatigue life of the treated specimens increased significantly compared with untreated specimens. After the tests, the fracture surfaces were examined using scanning electron microscope. In the specimens in which electric current was applied, local melting on the crack surface was observed via fractography. To clarify the effects of electric current treatment on fatigue crack propagation, early crack growth was investigated using the plastic replication method. A delaying effect was particularly noticeable in the small-crack region. Results show that this delaying effect can be attributed to crack shielding caused by local melting on the crack surface, which signifies that the fatigue life is improved by the application of high-density electric current.
1. Introduction
Fatigue is an extremely important phenomenon in metal structures. Since most mechanical components experience cyclic load, almost all fractures in mechanical components are attributed to fatigue.1) Therefore, countermeasures are required against fatigue fracture in structures. In addition, improving the long-term durability and reliability of mechanical components would lead to conservation of resources and energy, which may help preserve the global environment. Several techniques such as carburizing, nitriding, and shot peening have been used for improving fatigue strength. However, although crack initiation may be suppressed via surface treatments based on these methods,2–5) they are ineffective for materials with pre-existing cracks. Therefore, a method that can heal the damage in materials is necessary to improve the reliability and durability of mechanical components.
Several researchers have recently examined healing techniques for damaged materials. Chen et al.6) reported a crack healing method using a thermoplastic polymer material. White et al.7) developed a microencapsulation method for polymer materials. For ceramics, a technique to heal surface cracks by oxidation was also investigated.8) It is known that electric current influences the mechanical properties of metals. Okazaki et al.,9) Sprecher et al.,10) Conrad et al.,11,12) and Cao13) conducted detailed investigations of the effects of high-density current pulsing to titanium and copper alloys. Their research indicated that high-density current pulsing enhanced the movement of dislocations. Consequently, mechanical properties were improved via plastic recovery and the promotion of recrystallization based on the activated dislocation motion. Karpenko et al.14) demonstrated that the low-cycle fatigue life of carbon steel was increased by electric current pulsing. Zhou et al.15,16) reported that pre-cracks in carbon steel were partially healed by high-density electric pulsing. They concluded that the crack healing resulted from transient thermal compressive stress during electric pulsing. Hosoi et al.17) and Tang et al.18) reported that controlled electric current pulsing delayed crack propagation. Moreover, Roh et al.19) reported that electric current pulsing increased aluminum alloy elongation. Salandro et al.20) also showed that current pulsing increased aluminum alloy formability. Zhang et al.21) investigated the nanostructured transformation caused by high-density electropulsing. However, although results demonstrated that electric current pulsing improves the material properties of aluminum alloys, the effects of pulsed electric current on the fatigue life of aluminum alloys have not been thoroughly investigated.
Aluminum alloys are widely used in automotive, chemical, and oil industries. The main applications of aluminum alloys are related to their high specific strength ratio, which makes them suitable as the structural and mechanical components of machines.22,23) This study clarified the effects of pulsed electric current on the fatigue damage to the A6061-T6 aluminum alloy. This study was conducted to elucidate healing of fatigue damage in an aluminum alloy by application of high-density electric current. The healing effect on the damage was evaluated using the relationship between the stress amplitude and the number of cycles to failure. The fatigue crack growth behavior in the small-crack region was investigated specifically. Also, the fracture surface was observed using scanning electron microscope (SEM).
2. Experimental Methods
2.1 Material and specimen configuration
An aluminum alloy, A6061-T6, was used as the experimental material. Its chemical composition is summarized in Table 1. The 0.2% proof stress, tensile strength and elongation were, respectively, 292 MPa, 325 MPa and 17%. A dumbbell-shaped pate specimen was used, and a shallow notch (R = 45 mm) was introduced at its center, as shown in Fig. 1. The cross-sectional dimensions at the center of the specimen were 4.5 mm × 8 mm. The surface of the specimen was polished using #180 to #2000 emery paper and was buff-finished using alumina powder with 0.05 µm particle diameter.
Table 1
Chemical composition of A6061-T6 aluminum (mass%).
| |
Si |
Fe |
Cu |
Mn |
Mg |
Cr |
Zn |
Ti |
Al |
| A6061-T6 |
0.66 |
0.30 |
0.30 |
0.06 |
1.00 |
0.17 |
0.02 |
0.02 |
Bal. |
Fatigue tests were conducted under a controlled load condition using an electro-hydraulic fatigue testing machine at room temperature. The test conditions are shown in Table 2. All of tests were carried out at a stress ratio of R = −1 and a frequency of f = 15 Hz.
Table 2
Test conditions for specimens A, B and C.
| |
Specimen A |
Specimen B |
Specimen C |
| Stress ratio |
−1 |
−1 |
−1 |
| Frequency (Hz) |
15 |
15 |
15 |
Cycle ratio at the
applied current point |
None |
70% |
Each 10% after
70% until failure |
| Current density (A·mm−2) |
90 |
90 |
| Pulse duration (ms) |
0.5 |
0.5 |
High-density electric currents were applied at a cycle ratio of 70% (Specimen B) and then at 10% cycle ratios after the 70% (Specimen C) until failure. Electric current with a density of 90 A·mm−2 and pulse duration of 0.5 ms was applied to the specimens using a transistor power source. The current density was chosen with the expectation of inducing significant effects of pulsed electric current on the aluminum alloy.20)
2.3 Crack growth test and fracture surface observation
Fatigue crack growth tests were conducted to evaluate the effects of high-density electric current on crack growth. The tests were conducted under an applied load of 160 MPa using the plastic replication method. After the tests, crack initiation sites were observed on the fracture surface of all specimens using an SEM.
3. Experimental Results
3.1 Fatigue test
The S-N diagram obtained from the fatigue tests is shown in Fig. 2. The fatigue life data of each specimen treated with electric current pulsing are plotted at four stress levels. Figure 2 shows the fatigue life increases with application of the electric pulsing current. Furthermore, the fatigue life of Specimen C is longer than that of Specimen B, which suggests that multiple applications of electric pulsing current are more effective. Figure 3 shows the relationship between the increased cycle ratio and stress amplitude, where the increased cycle ratio is defined as:
| \[
\begin{split}
& {\rm Increased\ cycle\ ratio\ (\%)} \\
& \quad = \frac{N_{\rm f}({\rm Specimen\ B,\ C}) - N_{\rm f}({\rm Specimen\ A})}{N_{\rm f}({\rm Specimen\ A})} \times 100
\end{split}
\] | (1) |
where,
Nf is number of cycles to failure. The effect of electric pulsing current tends to decrease concomitantly with increasing stress amplitude, i.e., the application of electric pulsing current is more effective at lower stress levels. In addition, the decline in the increased cycle ratio in Specimen C is more significant than in Specimen B. However, the periodic application of electric pulsing current in Specimen C is more effective at increasing the fatigue life.
3.2 Fractography
The fracture surfaces after fatigue tests were examined in detail via an SEM. Figures 4 and 5 show the scanning electron micrographs of the fracture surfaces obtained at stress levels of 180 and 120 MPa, respectively. Both figures show the enlarged crack initiation sites of Specimens A, B, and C. In Specimen A (Fig. 4(a)), the fatigue crack was initiated at the specimen surface because of a cyclic slip deformation. Conversely, in the current-applied specimens B and C (Figs. 4(b) and 4(c)), local melting sites occurred because of the electrical stimulation. Figure 5 shows the scanning electron micrographs at a stress level of 120 MPa. As shown for 120 MPa stress level, local melting was found in Specimens B and C. Especially, in Specimen C, at both stress levels (Figs. 4(c) and 5(c)), the characteristic feature of local melting induced by the application of electric current was confirmed.
3.3 Fatigue crack growth
As described in Section 2.3, fatigue crack growth was monitored using the plastic replication method. The stress amplitude for the crack growth test was determined as the stress value corresponding to a fatigue life of about 1 × 10⁵ cycles, i.e., 160 MPa. Figure 6 shows the relationships between the surface crack length (2C) and the number of cycles (N). The arrows indicate the number of cycles in which electric pulsing current was applied. In Specimen A, the crack grew rapidly after crack initiation, and then the specimen fractured. This means that the crack growth life was relatively short. Conversely, in the current-applied specimens, (B and C), fatigue crack growth was delayed immediately after the application of current, but it returned from the delayed state to the former one after 2 × 10⁵ or 3 × 10⁵ cycles. Such behavior was particularly evident in Specimen C, i.e., the healing effect was induced after every application of current. Figure 7 shows the number of cycles of the delayed period at different points of application of electric pulsing current. The number of cycles of the delayed period decreased concomitantly with increasing number of cycles at the point of current application. This delaying effect decreased significantly when the surface crack length reached 2C = 0.045 mm. Consequently, the delaying effect decreased concomitantly with the increase of crack length.


To evaluate the delaying effect on the crack growth rate, the relationship between crack growth rate (da/dN) and maximum stress intensity factor (Kmax) was taken into account, as shown in Fig. 8. The stress intensity factor was calculated using an analytical solution developed by Newman and Raju,24,25) assuming an aspect ratio of a/C = 1 (a: crack depth, 2C: crack length). When the crack growth rates of Specimens B and C were compared with that of Specimen A in the small Kmax region, the rates of Specimens B and C were lower than that of Specimen A, which indicates a delaying effect because of the application of current. Moreover, the crack growth rate of Specimen C is also lower than that of Specimen B in the small Kmax region, because of the multiple applications of electric current. However, the fatigue crack growth rates for the three specimens converged to similar values with an increase in Kmax, i.e., an increase in crack length.
4. Discussion
4.1 Effect of electric stimulation on fatigue strength
The fatigue strengths of the specimens treated with electric current increased more than those of the untreated specimens. The maximum increased cycle ratios of Specimens B and C were, respectively 21% and 55%, this difference resulted from the number of times electric current was applied. As shown in the test conditions (Table 2), Specimen B was treated only once with electric current at a cycle ratio of 70% of fatigue life, whereas Specimen C was treated eight times after a cycle ratio of 70% of fatigue life. According to these results, the increased cycle ratio of fatigue strength is possibly related to the number of times electric current is applied. However, the number of electric current applications is not proportional to the increased fatigue life cycle ratio. Compared with Specimens B and C, the fatigue life of Specimen C does not increase eight times despite the application of electric current eight times. Figures 6 and 8 show that the delay period in crack growth is significantly influenced in the small-size region by the applied electric current. Figures 9(a) and 9(b) respectively show low-magnification images of Figs. 5(a) and 5(c). The scanning electron micrograph of a treated specimen (Fig. 9(b)) reveals that noticeable local melting occured near the surface, i.e., in the small-crack region. Subsequently, with increasing crack growth, the fracture surfaces become similar to those of the specimen without the application of electric current (Fig. 9(a)). These observations correspond to the results of the crack growth test (Figs. 6 and 8).

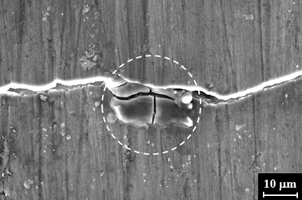
Figure 6 shows that the fatigue crack growth was delayed by the application of electric current. It is believed that the local melting caused by the electric current applied on the crack surface influences the fatigue crack growth. In particular, scanning electron micrographs of Specimen C (Figs. 4(c) and 5(c)) show evidence of this phenomenon. When an electric current is applied to the specimen, an electric field is formed around the crack. The crack area is heated rapidly by Joule heating. Then, crack shielding26) takes place because of local melting, i.e., crack closure occurs. Figure 10 shows a scanning electron micrograph of the surface of Specimen C during the fatigue test at σa = 160 MPa, indicating that the surface of the specimen at a part of crack initiation site was melted by the applied current. The white dotted line indicates the area most affected by the applied current. The length of the white dotted line on the surface, shown in Fig. 10, is 30 μm. Results show that the electric current had a significant effect on the small-crack region. However, the delaying effect on crack growth decreased concomitantly with increasing crack length because the maximum stress intensity factor (Kmax) increased with increasing crack length. Figure 11 shows the relationship between the fatigue crack length and decreased ratio of crack growth rate (DRCGR) upon the application of electric current, where DRCGR is defined as:
| \[
\begin{split}
& {\rm DRCGR\ (\%)} \\
&\quad = \frac{{\rm d}a/{\rm d}N({\rm Specimen\ C}) - {\rm d}a/{\rm d}N({\rm Specimen\ A})}{{\rm d}a/{\rm d}N({\rm Specimen\ A})} \times 100
\end{split}
\] | (2) |
When electric current was applied, the crack growth rate (da/dN) decreased significantly. The maximum DRCGR was 94%. Results show that the applied electric current can enhance crack shielding. However, when the crack length increased, the delaying effect of the applied electric current on crack growth became smaller. Therefore, the delaying effect of the applied electric current was found to be useful for prolonging the fatigue life of small-crack components.
5. Conclusion
In this study, the effect of applied electric current on the fatigue properties of an aluminum alloy, A6061-T6, were examined. Pulsed electric current was applied to the specimens, i.e., one group of specimens was treated only once at a cycle ratio of 70% and the other specimens were treated at 10% cycle ratios after 70%. The obtained results are summarized as presented below:
-
(1)
The fatigue lives of the specimens with applied electric current increased more than those with the untreated one. The maximum increased fatigue life cycle ratios for specimens treated once and multiple times were, respectively, 21% and 55%.
-
(2)
For specimens that were treated multiple times, significant local melting induced by electrical stimulation was observed on the fracture surfaces near the crack initiation sites.
-
(3)
Fatigue crack growth was delayed after the application of pulsed electric current. This delaying effect diminished with increasing crack length. It is considered that this behavior is induced because of the electric current being poorly concentrated in large crack surfaces and that the maximum stress intensity factor (Kmax) increases with increasing crack length.
Acknowledgments
This work was supported by the Japan Society for the Promotion of Science with Grants-in-Aid for Scientific Research (A) 26249001.
REFERENCES
- 1) R. I. Stephens, A. Fatemi, R. R. Stephens and H. O. Fuchs: Metal fatigue in engineering, (John Wiley & Son, 2000).
- 2) L. Wagner: Mater. Sci. Eng. A 263 (1999) 210–216. 10.1016/S0921-5093(98)01168-X
- 3) M.P. Nascimento, R.C. Souza, W.L. Pigatin and H.J.C. Voorwald: Int. J. Fatigue 23 (2001) 607–618. 10.1016/S0142-1123(01)00015-9
- 4) C.S. Montross, T. Wei, L. Ye, G. Clark and Y.W. Mai: Int. J. Fatigue 24 (2002) 1021–1036. 10.1016/S0142-1123(02)00022-1
- 5) G.H. Farrahi and H. Ghadbeig: J. Mater. Process. Technol. 174 (2006) 318–324. 10.1016/j.jmatprotec.2006.01.014
- 6) X. Chen, M.A. Dam, K. Ono, A. Mal, H. Shen, S.R. Nutt, K. Sheran and F. Wudl: Science 295 (2002) 1698–1702. 10.1126/science.1065879
- 7) S.R. White, N.R. Sottos, P.H. Geubelle, J.S. Moore, M.R. Kessler, S.R. Sriram, E.N. Brown and S. Viswanathan: Nature 409 (2001) 794–797. 10.1038/35057232
- 8) K. Ando, Y. Shirai, M. Nakatani, Y. Kobayashi and S. Sato: J. Eur. Cera. Soc. 22 (2002) 121–128. 10.1016/S0955-2219(01)00236-9
- 9) K. Okazaki, Y. Aono, T. Kaneyuki and H. Conrad: Mater. Sci. Eng. 33 (1978) 253–266. 10.1016/0025-5416(78)90179-9
- 10) A.F. Sprecher, S.L. Mannan and H. Conrad: Acta Metall. 34 (1986) 1145–1162. 10.1016/0001-6160(86)90001-5
- 11) H. Conrad, J. White, W.D. Cao, X.P. Lu and A.F. Sprecher: Mater. Sci. Eng. A 145 (1991) 1–12. 10.1016/0921-5093(91)90290-4
- 12) H. Conrad: Mater. Sci. Eng. A 287 (2000) 276–287. 10.1016/S0921-5093(00)00786-3
- 13) W.D. Cao and H. Conrad: Fatigue Fract. Eng. Mater. Struct. 15 (1992) 573–583. 10.1111/j.1460-2695.1992.tb01296.x
- 14) G.V. Karpenko, O.A. Kuzin, V.I. Tkachev and V.P. Rudenko: Sov. Phys. Dokl. 21 (1976) 159–160.
- 15) Y. Zhou, Y. Zeng, G. He and B. Zhou: J. Mater. Res. 16 (2001) 17–19. 10.1557/JMR.2001.0005
- 16) Y. Zhou, J. Guo, M. Gao and G. He: Mater. Lett. 58 (2004) 1732–1736. 10.1016/j.matlet.2003.10.049
- 17) A. Hosoi, T. Nagahama and Y. Ju: Mater. Sci. Eng. A 533 (2012) 38–42. 10.1016/j.msea.2011.11.024
- 18) Y. Tang, A. Hosoi, Y. Morita and Y. Ju: Int. J. Fatigue 56 (2013) 69–74. 10.1016/j.ijfatigue.2013.08.012
- 19) J. Roh, J. Seo, S. Hong, M. Kim, H. Han and J. Roth: Int. J. Plast. 58 (2014) 84–99. 10.1016/j.ijplas.2014.02.002
- 20) W.A. Salandro, J.J. Jones, T.A. McNeal, J.T. Roth, S.T. Hong and M.T. Smith: J. Manf. Sci. Eng. 132 (2010) 051016. 10.1115/1.4002185
- 21) W. Zhang, Y. Zhou, M. Sui, G. He, J. Guo and D. Li: J. Mater. Sci. Lett. 21 (2002) 1923–1925. 10.1023/A:1021652429025
- 22) T. Gladman: Mater. Sci. Technol. 15 (1999) 30–36. 10.1179/026708399773002782
- 23) A. Gupta, D. Lloyd and S. Court: Mater. Sci. Eng. A 316 (2001) 11–17. 10.1016/S0921-5093(01)01247-3
- 24) I.S. Raju and J.C. Newman: Eng. Fract. Mech. 11 (1979) 817–829. 10.1016/0013-7944(79)90139-5
- 25) J.C. Newman and I.S. Raju: Eng. Fract. Mech. 15 (1981) 185–192. 10.1016/0013-7944(81)90116-8
- 26) R. Ritchie, W. Yu and R. Bucci: Eng. Fract. Mech. 32 (1989) 361–377. 10.1016/0013-7944(89)90309-3