Abstract
Oxygen removal from Ti–Si melts (Si: 9.1–30 mass%) during arc melting was investigated. High-purity Si was added to either Ti with a high oxygen content (High O Ti, O: 1.6 mass%) or commercially pure Ti (CP Ti, O: 0.104 mass%) melted under Ar or He gas flow conditions at atmospheric pressure. At Si additions of 23 mass% and 30 mass%, the oxygen content of the Ti–Si ingots decreased. After melting, Si and amorphous SiO2 powders were observed in the chamber, which suggested that the oxygen in the melts was removed in the form of SiO gas. The oxygen content of the Ti–Si ingots after melting varied as a function of position within the ingot; the residual oxygen content was lowest in the top section of the ingots and highest in the bottom section. Under the Ar gas flow, the oxygen content of the High O Ti–30Si ingot decreased to 0.136 mass% and 0.609 mass% in the top and center sections of the ingot, respectively; similarly, the oxygen content of the CP Ti–30Si ingot decreased to 0.030 mass% and 0.051 mass% in the top and center sections, respectively. After melting under He gas flow, the oxygen contents of the CP Ti–30Si ingot in the top, center, and bottom sections were 0.020 mass%, 0.021 mass%, and 0.029 mass%, respectively. Better uniformity of oxygen distribution in the ingots was achieved under the He gas flow than under the Ar gas flow because the melted region is extended in the depth direction by using He gas. During melting, no significant evaporation of Ti and Si occurred, which is an advantage of arc melting that operates at atmospheric pressure over electron beam melting that occurs in vacuum.
1. Introduction
Ti and its alloys have been widely used for aerospace, shipbuilding, automotive, and biomedical-device applications because of their high specific strength, excellent corrosion resistance, and good biocompatibility.1–4) Ti is the fourth most abundant structural metal in the Earth's crust. However, in 2014, the annual global production of Ti sponge was limited to 160 kt.5) The production process for Ti is as follows: Initially, Ti oxide is chlorinated to TiCl4 and reduced to Ti sponge (Kroll method). The Ti sponge is subsequently melted and cast into ingots. Although Kroll method is a flexible production technique, it has matters related to high energy consumption and low production efficiency.6)
Oxygen is a main impurity element in Ti sponge because oxygen is highly soluble in Ti and the two elements have a strong chemical affinity for each other.7) The oxygen removal from Ti melts will enable the production of high grade (low oxygen content) Ti ingots even while using off-grade Ti sponge and Ti scrap as raw materials; moreover, it is expected to reduce the production costs of Ti. During the past 30 years, new processes to produce metallic Ti directly from TiO2 have been studied.8–12) In these processes, the oxygen content of the products is expected to be > 2000–3000 mass ppm.8,12) Therefore, the behavior of oxygen must be clarified for Ti produced by both the Kroll method and also the direct-reduction methods.
Yahata et al.13) reported on the removal of oxygen from Ti–Si melts during electron beam melting (EBM); the reaction is given by eq. (1).
| \[\underline{\rm O} ({\rm mass\%},\ {\rm in}\ {\rm Ti}(l)) + {\rm Si}(l) = {\rm SiO}(g)\] | (1) |
They reported that the oxygen content of Ti melts with an Si content of 30 mass% decreased from 1.7 mass% to 0.05 mass%. However, a loss of Ti and Si was observed during EBM because it was conducted at high temperatures under high vacuum conditions.
14,15)
In the present work, the removal of oxygen from Ti–Si melts by arc-melting, which operates at atmospheric pressure and is able to suppress the evaporation of metallic elements from the melts, was conducted as part of a fundamental study on oxygen removal from Ti melts situated on a water-cooled Cu hearth used in processes such as plasma arc melting and EBM. Melting was conducted under gas flow conditions that simulated plasma arc melting, which is an important industrial process.
2. Experimental
2.1 Materials used in melting
Ti ingots with a high oxygen content (O: 1.6 mass%) and commercially pure Ti bars (ϕ: 30 mm, ASTM B 348 Gr. 2, O: 0.104 mass%) were used for melting. These will be referred to as High O Ti and CP Ti, respectively. High O Ti was prepared by subjecting the CP Ti and TiO2 powder to arc melting, forming ingots with a size of 40 × 25 × 140 mm. The starting materials weighing 15–28 g were cut from the ingot and bar, and then the surface oxide film was removed and the surface was ultrasonically cleaned in ultrapure water and ethanol just before melting. High-purity Si flakes (11N) were used as the Si source, and their surfaces were ultrasonically cleaned in ultrapure water and ethanol just before melting, using the same procedures that were used with the Ti materials.
2.2 Melting
The Ti–Si alloys were melted using a non-consumable W-electrode-type arc-melting furnace (Fig. 1 (a)). This furnace is equipped with a turning bar made of Al2O3 that makes it possible to turn the ingot upside down. The High O Ti or CP Ti and the Si flakes were placed on the water-cooled Cu hearth as shown in Fig. 1 (b). The chamber was evacuated to 1.0 × 10⁻³ Pa, and then controlled inert atmosphere was subsequently introduced. High-purity Ar gas (>99.9999 vol%, O2 < 0.1 vol. ppm) and high-purity He gas (>99.99995 vol%, O2 < 0.05 vol. ppm) were used for the controlled atmospheres. The melting was conducted under an Ar or He gas flow of 8.3 × 10⁻⁵ m3∙s−1 (5 L∙min−1, standard state) with a total pressure in the chamber of 0.1 MPa. In most cases, the Ar flow condition was employed. To avoid oxygen contamination from the gas phase to the Ti–Si alloy melts, O2 and H2O impurities in the Ar or He gas were removed by passing the gas stream through a Gasclean column (GC-RX, Nikka Seiko, Tokyo, Japan) and a Drycolumn (DC-A4, Nikka Seiko, Tokyo, Japan) before its introduction to the chamber (see Fig. 1(a)). The arc power was set to 20 V and 300 A. The amount of added Si was varied from 9.1 mass% to 30 mass%. The total melting time was 0.6 ks or 1.8 ks. First, the Ti–Si alloy was melted for 0.3 ks or 0.9 ks. Then the ingot was turned upside down (Fig. 1(c)) and melted again for the same duration as the first melting. The total melting time is defined as the sum of the two melting times. After melting, the Ar or He gas flow was stopped and the specimen was cooled on the water-cooled Cu hearth.

After melting, the Ti–Si ingot was cut into top, center, and bottom sections as shown in Fig. 1 (d) and analyses were conducted on each section. The oxygen content of each section was measured by the inert gas fusion-IR absorption method (ONH836, LECO, MI). The surface of each section was polished with SiC emery paper, and then the sections were cut into pieces weighing 0.05 g, followed by removal of the surface oxide film and ultrasonic cleaning in ultrapure water and ethanol. A graphite crucible (No.782-720, LECO, MI) was used as the holding vessel during the oxygen analysis. The metal baths of Ni (No.502-344, LECO, MI) and Sn (>99.999%, Kojundo Chemical Laboratory Co., Ltd., Sakado, Japan) were used. The oxygen analyses were conducted at least three times for each section. The Si content was measured by inductively coupled plasma-mass spectrometry (ICP-MS, Agilent 8800, Agilent Technologies, CA). A specimen weighing 0.01 g was cut off each section for analysis; after surface polishing and cleaning, the specimen was dissolved in an acid solution with a composition of HCl : HNO3 : HF = 1:1:1 for Si analysis by ICP-MS. The dissolution was conducted at around 473 K in a sealed vessel using microwave to prevent loss of Si as fluorides.
2.4 Microstructure of the ingots
Each section was mirror polished using emery paper (maximum grit size 1500), followed by 6- and 1-μm diamond pastes. The microstructure of the section was observed using a scanning electron microscope (SEM, XL30FEG, Philips, Hillsboro, OR) equipped with energy dispersive X-ray spectroscopy (EDX, DX-4CDU NEW XL-30, EDAX, Mahwah, NJ). The phases were identified using X-ray diffraction (XRD, UltimaIV, Rigaku, Tokyo, Japan) with Cu Kα radiation.
3. Results and Discussion
3.1 Relationship between the level of Si addition and the oxygen content of the melts under Ar gas flow conditions with a total melting time of 0.6 ks
Figure 2 shows the change in the oxygen content of the High O Ti ingots as a function of the amount of added Si under the Ar gas flow condition. The dotted line indicates the initial oxygen content of the Ti–Si alloys. The oxygen content of the ingots after melting depended on the section of the ingot. At Si additions of 23 mass% and 30 mass%, the decrease in oxygen was detected in all three sections of the ingots. In particular, at an Si addition of 30 mass%, the oxygen content of the ingot decreased to 0.136 mass%, 0.609 mass%, and 0.670 mass% in the top, center, and bottom sections, respectively. Figure 3 shows the oxygen content of a CP Ti ingot with an Si content of 30 mass% after melting under the Ar gas flow. The decrease in oxygen was detected in all sections of the ingot, and the oxygen content decreased significantly to 0.030 mass% in the top section. Yahata et al. did not mention the sectional dependence of oxygen content for the melting of Ti–Si alloy using EBM; however, considering that EBM is conducted on a water-cooled Cu hearth just as in the case of arc melting, the oxygen content may have been dependent on position within the ingot. They reported that the oxygen content of Ti melts with an Si content of 30 mass% decreased to 0.05 mass%.13) The oxygen content in the top section of the Ti–Si ingots that was detected after melting in our study was comparable to their value.

After melting, it was observed that brown powders were adhered to the water-cooled Cu and chamber walls. The amount of powder increased as the amount of added Si increased. Figure 4 shows the XRD pattern of the powders adhered to the water-cooled Cu, which were collected after melting of High O Ti with an Si content of 30 mass%. Reflections corresponding to Si were detected. In addition, a broad peak at 2θ = 17–27° was observed, which indicates the presence of amorphous SiO2. It is speculated that SiO gas was formed according to the reaction of eq. (1) during arc melting. Owing to the instability of SiO gas at low temperature, it decomposed into Si and SiO2, in accordance with the reaction in eq. (2)16).
| \[{\rm 2SiO}(g) = {\rm Si}(s) + {\rm SiO}_2(s)\] | (2) |
It seems likely that the SiO gas decomposed into Si and SiO
2 during or after the arc melting. These results confirmed that the oxygen from the Ti–Si melts was removed in the form of SiO gas.
Here, a thermodynamic evaluation of the reaction of eq. (1) is carried out. The standard Gibbs free energy change associated with oxygen dissolution in the Ti melt has been reported as follows.17)
| \[{\rm O}_2(g) = 2 \underline{\rm O} ({\rm mass\%},\ {\rm in}\ {\rm Ti}(l))\] | (3) |
| \[\Delta G_{(3)}^{\rm o}/{\rm J} = -980730 + 147.58T\] | (4) |
The standard Gibbs free energy of formation of SiO gas is described as follows.
18)
| \[{\rm Si}(l) + \frac{1}{2} {\rm O}_2(g) = {\rm SiO}(g)\] | (5) |
| \[\Delta G_{(5)}^{\rm o}/{\rm J} = -161799 - 46.86T\] | (6) |
Using eqs. (3)–(6), the standard Gibbs free energy change of eq. (1) is given by eq. (7).
| \[\Delta G_{(1)}^{\rm o}/{\rm J} = 328566 - 120.65T\] | (7) |
It can be assumed that oxygen in the Ti melt obeys Henry's law; Δ
Go(1) is described by eq. (8).
| \[\Delta G_{(1)}^{\rm o} = -RT \ln \frac{(P_{\rm SiO}/101325)}{a_{\rm Si} \cdot [{\rm mass}\% \underline{\rm O}]}\] | (8) |
where
R is the gas constant,
T is the temperature (K),
PSiO is the partial pressure of SiO gas (Pa),
aSi is the activity of Si in the Ti melt, and [mass%
O] is oxygen content of the Ti melt (mass%). The
PSiO can be expressed as follows by rewriting eq. (8).
| \[
\begin{split}
P_{\rm SiO}/{\rm Pa} & {}= 101325 \cdot a_{\rm Si} \cdot [{\rm mass}\% \underline{\rm O}] \cdot \exp \left( -\frac{\Delta G_{(1)}^{\rm o}}{RT} \right)\\
& {}= 101325 \cdot a_{\rm Si} \cdot [{\rm mass}\% \underline{\rm O}] \cdot \exp \left( -\frac{39519.6}{T} + 14.51 \right)
\end{split}
\] | (9) |
Equation (9) indicates that
PSiO increases as the activity of Si in the Ti melt (
aSi), the oxygen content, and the temperature of the Ti melt (
T) increase.
To the best of our knowledge, there has been no prior study that determined the values for aSi; therefore, it was calculated by using Thermo-Calc software, based on the CALPHAD method (Thermo-Calc, Thermo-Calc Software AB, Stockholm, Sweden) in conjunction with the TTTI3 thermodynamic database. Figure 5 shows the aSi values calculated by Thermo-Calc for a Ti–Si binary system at 2400 K. Although the temperature of Ti–Si melts was not measured in this study, the temperature of the melts would be at least equal to the melting point of Ti5Si3 (2403 K), which is the highest among the titanium silicides. Hence, the temperature of the melts was set to 2400 K. As shown in Fig. 5, aSi exhibits largely negative deviations from the ideal solution indicated by a dotted line. The value of PSiO, calculated using eq. (9) under the conditions of [mass%O] = 1.6 mass% and xSi = 0.26 (17 mass%), was 2.78 × 10² Pa; under these conditions, oxygen removal was not detected. On the other hand, PSiO, calculated using eq. (9) under the conditions of [mass%O] = 1.6 mass% and xSi = 0.42 (30 mass%), was 1.25 × 10³ Pa; under these conditions, the oxygen removal was achieved. These results suggest that a high value of aSi is required in order for the reaction of eq. (1) to proceed via increasing PSiO.

Figure 6 shows the mass of the High O Ti–30Si ingot before and after melting, and the Si content of each section after melting. The mass change of the ingot before and after melting was small, and the mass loss was mainly attributed to the formation of SiO. The decrease in Si content of the ingot after melting was not significant in any of the sections. These results indicate that no significant evaporation of Ti and Si occurred during melting, which is an advantage of arc melting conducted at atmospheric pressure, compared to EBM.

Next, the positional dependence of the oxygen content of the ingot is discussed. As shown in Fig. 2, the oxygen content of the High O Ti–30Si ingot decreased from its initial value in all three sections; however, there were significant differences among the top, center, and bottom sections. Since the specimens were melted on the water-cooled Cu hearth, a solid layer (skull) was formed just above the hearth. Therefore, oxygen removal did not occur in skull, which made a difference in the oxygen contents between the top and bottom sections. The difference of oxygen contents between the top and center sections might be due to the fact that convective flow was insufficient, and thus a non-uniform concentration distribution was produced between the top and center sections. The oxygen in the melts was removed in the form of SiO gas, as shown in eq. (1), and the oxygen removal reaction proceeded at the interface between the liquid and gas phases. It is speculated that, because of the insufficient fluidity of the melts, the homogenization of the melts between the top section with low oxygen content and the center section did not occur.
3.2 Microstructure of Ti–Si ingots
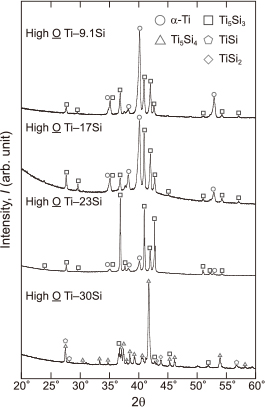
Figure 7 shows the XRD patterns of the High O Ti ingots with Si additions of 9.1–30 mass%; α-Ti and Ti5Si3 phases were detected in the High O Ti–9.1, 17, and 23Si ingots, whereas TiSi2, TiSi, Ti5Si4, and Ti5Si3 phases were detected in the High O Ti–30Si ingot.
SEM and back scattered electron (BSE) analysis were used to observe the sections after melting. Figure 8 shows the BSE images of the High O Ti–9.1Si and High O Ti–30Si ingots. Two colored areas were observed for the High O Ti–9.1Si ingot as shown in Figs. 8 (a, b), which correspond to α-Ti and Ti5Si3. On the other hand, four colored areas were observed in the top section of High O Ti–30Si ingot (Fig. 8 (c)) and two colored areas were observed in the bottom section (Fig. 8 (d)). The XRD patterns (Fig. 7) and EDX analysis revealed that the phases were Ti5Si3, Ti5Si4, TiSi, and TiSi2 as demonstrated in Figs. 8 (c, d). The different phases in the top and bottom sections could have arisen during the solidification of the melt because the solidification rate in the top section was slower than that in the bottom section.
3.3 Effects of melting time and flow-gas on the oxygen content of the melts
Figure 9 shows the change in the oxygen content of the High O Ti–30Si ingots with melting time under the Ar gas flow condition. The oxygen content in the center section was almost identical to that in bottom section after 0.6 ks of melting, whereas the oxygen content decreased to 0.048 mass%, 0.092 mass%, and 0.290 mass% in the top, center, and bottom sections, respectively, after 1.8 ks of melting. Hence, the oxygen content of the ingots decreased in all the sections and the oxygen content in the center section reached almost the same value as that in top section when the melting time was extended.

Figure 10 shows the oxygen content of the High O Ti–30Si and CP Ti–30Si ingots after melting under Ar and He gas flow conditions for 0.6 ks. It is known that the use of He gas as the melting atmosphere leads to an increase in the heat flux density for the specimen because of constriction of the arc; consequently, the melting area is extended in the depth direction.19) The oxygen content of the High O Ti–30Si ingot decreased to 0.150 mass% in both the top and center sections after melting under He gas flow, as shown in Fig. 10 (a). Likewise, the oxygen content of the CP Ti-30Si ingot decreased to 0.020 mass% and 0.021 mass% in the top and center sections, respectively, and also decreased to 0.029 mass% in the bottom section after melting under the He gas flow, as shown in Fig. 10 (b). During the melting under He gas flow, it appears that the expansion of the melting area was caused by an increase in the heat flux density for the melt. Therefore, the Ti–Si melts that melted under He gas flow were more uniform than those under Ar gas flow.

As mentioned above, it was found that the oxygen content of the Ti–Si melts could be lowered to 0.02–0.03 mass% during arc melting. The ingots consisted of α-Ti and titanium silicides such as Ti5Si3, Ti5Si4, TiSi, and TiSi2. Ti5Si3 is expected to be useful as a high-temperature material because of its high melting point (2403 K), excellent oxidation resistance, and good mechanical properties.20,21) The oxygen removal process proposed in this study has an advantage in that inexpensive Ti and Si with relatively high oxygen content can be used as raw materials, which contributes to the low-cost production of high-purity titanium silicide materials.
4. Conclusion
Ti–Si alloys with an initial oxygen content of 1.6 mass% and 0.104 mass% were arc-melted under Ar or He gas flow, in order to quantify the change in oxygen content of the melts as a function of melting conditions. The Si content in the melts varied between 9.1 mass% and 30 mass%. The following results were obtained:
-
(1)
A decrease in oxygen was detected in the Ti–Si melts with Si contents of 23 mass% and 30 mass%, independent of the initial oxygen content. The oxygen was removed in the form of SiO gas.
-
(2)
The oxygen content of Ti–Si ingots after melting depended on the position within the ingot; the residual oxygen content was lowest in the top section of the ingots and highest in the bottom section. The use of a He gas flow decreased the oxygen content in the center and bottom sections because the He gas extended the melting area in the depth direction.
-
(3)
At an Si content of 30 mass%, the oxygen content of the melts significantly decreased to less than 0.03 mass% in the top section of the ingots under Ar gas flow, whereas it decreased to less than 0.03 mass% in both the top and center sections under He gas flow.
-
(4)
No significant evaporation of Si and Ti occurred from the Ti–Si melts, which appears to be a significant advantage of arc melting compared to EBM.
Acknowledgments
The authors would like to thank Ms. Y. Nakano of Tohoku University for the ICP-MS analysis. This study was financially supported by a future-pioneering program commissioned by the New Energy and Industrial Technology Development Organization (NEDO).
REFERENCES
- 1) W. Zhang, Z. Zhu and C.Y. Cheng: Hydrometallurgy 108 (2011) 177–188. 10.1016/j.hydromet.2011.04.005
- 2) C. Cui, B. Hu, L. Zhao and S. Liu: Mater. Des. 32 (2011) 1684–1691. 10.1016/j.matdes.2010.09.011
- 3) X. Lu, T. Hiraki, K. Nakajima, O. Takeda, K. Matsubae, H.-M. Zhu, S. Nakamura and T. Nagasaka: Separ. Purif. Tech. 89 (2012) 135–141. 10.1016/j.seppur.2012.01.008
- 4) M. Niinomi, T. Hanawa and T. Narushima: JOM 57(4) (2005) 18–24. 10.1007/s11837-005-0076-3
- 5) Japan Oil, Gas and Metals National Corporation, Mineral resource material flows, (2015).
- 6) R.O. Suzuki: TITANIUM JAPAN 52 (2004) 281–287 (in Japanese).
- 7) T. Narushima: TITANIUM JAPAN 61 (2013) 126–131 (in Japanese).
- 8) R.O. Suzuki, K. Teranuma and K. Ono: Metall. Mater. Trans. B 34 (2003) 287–295. 10.1007/s11663-003-0074-1
- 9) G.Z. Chen, D.J. Fray and T.W. Farthing: Nature 407 (2000) 361–364. 10.1038/35030069
- 10) F. Cardarelli: World Patent, WO 03/046258 (2003) A2.
- 11) T. Takenaka, H. Matsuo, M. Sugawara and M. Kawakami: Key Eng. Mater. 436 (2010) 85–91. 10.4028/www.scientific.net/KEM.436.85
- 12) T.H. Okabe, T. Oda and Y. Mitsuda: J. Alloy Compd. 364 (2004) 156–163. 10.1016/S0925-8388(03)00610-8
- 13) T. Yahata, T. Ikeda and M. Maeda: Metall. Trans. B 24 (1993) 599–604. 10.1007/BF02673175
- 14) A. Powell, J.V.D. Avyle, B. Damkroger, J. Szekely and U. Pal: Metall. Mater. Trans. B 28 (1997) 1227–1239. 10.1007/s11663-997-0078-3
- 15) T. Ikeda and M. Maeda: ISIJ Int. 32 (1992) 635–642. 10.2355/isijinternational.32.635
- 16) F. Holleman, E. Wiberg and N. Wiberg, Inorganic chemistry, pp 858–859, Academic Press, San Diego (2001).
- 17) K. Fitzner: Thermochim. Acta 52 (1982) 103–111. 10.1016/0040-6031(82)85188-5
- 18) M.W. Chase, Jr., NIST-JANAF Thermochemical Tables, fourth ed. part II, pp 1728, American Institute of Physics, New York (1998).
- 19) M. Tanaka, M. Ushio and J.J. Lowel: JSME Int. J. Ser. B 48 (2005) 397–404. 10.1299/jsmeb.48.397
- 20) S. Kirihara, Y. Tomota and T. Tsujimoto: Mater. Sci. Eng. A 239–240 (1997) 600–604. 10.1016/S0921-5093(97)00636-9
- 21) Z. Chen, Y. Li, Y. Tan and K. Morita: Mater. Trans. 56 (2015) 1919–1922. 10.2320/matertrans.M2015264


