Abstract
In this study, we fabricated E-glass fibers and alkali-resistant (AR)-glass fibers with a 7 mass% zirconia content, and AR-glass fibers with a 7 mass% zirconia and 30–50 mass% refused coal ore content. The obtained fibers were characterized for their tensile strength and alkali-resistant properties after dipping the fibers in an alkaline solution. The alkali test results, based on microscopic images, showed that the AR-glass fibers with 7 mass% zirconia and 40 mass% refused coal ore had better chemical resistance than the E-glass fibers. The average tensile strengths of the E-glass fibers and the AR-glass fibers with 7 mass% zirconia and 40 mass% refused coal ore, after being dipped in an alkaline solution for 48 h, were 240 and 343 MPa, respectively. In addition, after an alkali test for 72 h, the average tensile strength of AR-glass fibers with 7 mass% zirconia was 277 MPa, and the average tensile strength of AR-glass fibers with 7 mass% zirconia and 40 mass% refused coal ore was 296 MPa. The AR-glass fibers with a high tensile strength and low fiberizing temperature, fabricated using refused coal ore, can be widely used as alkali-resistant glass fibers.
1. Introduction
Glass fibers commonly have weak corrosion resistance in alkali or acid environments. For a long time, they have had very limited uses in reinforcing the structure of materials such as cements.1) Alkali resistant (AR)-glass fibers were developed to have a better alkali resistance, so that they could be better used in structural applications or to reinforce cements.2) The corrosion of glass fibers by alkaline solutions is generally caused by the preferential dissolution of SiO2, as the ZrO2 component is much more stable under these conditions. Commercial AR-glass fibers have zirconia (ZrO2) contents of >15% by weight.3) However, because the melting temperature of zirconia is very high (2700℃), its fiberizing temperature is also high, which makes it difficult for AR-glass fibers with a large zirconia content to undergo fiberizing processes.4) Recently, refused coal ore has become an environmental risk factor due to its neglected long-term environmental exposure around collieries.5–7) Therefore, research studies on the applications of refused coal ore have been carried out in the civil and materials engineering fields, and in the raw materials industry.8–10) However, with the exception of some experiments carried out in Korea involving artificial light-weight, ceramic aggregates,11–13) there have not been many studies published that deal with the practical applications of refused coal ore. In this study, we have fabricated E-glass fibers and AR-glass fibers with different zirconia and refused coal ore contents, in order to investigate the effect that the refused coal ore has on the fiber tensile strength and surface corrosion under alkaline test conditions.
2. Experimental Procedure
To fabricate the fibers, we used silica-alumina refused coal ore of relatively low carbon content. The mineral raw materials were crushed to control the particle size (<300 μm). The chemical analysis results of the refused coal ore are given in Table 1. The three different types of glass compositions are listed in Table 2, where it can be observed that the main component of the ARGF_CN samples was the refused coal ore. For these samples, the amount of refused coal ore was varied from 30 to 50 mass%, at 5 mass% batch composition increments. With the exception of the silica, the remainder of the glass fiber content was supplemented with the following materials: CaCO3, MgCO3, BaCO3, ZrSiO2, and Na2CO3, with the Na2CO3 content fixed at 18 mass%. The name of each sample is as follows: for the normal E-glass composition, EGF; for the glass composition with 7 mass% zirconia, ARGF_Z7; and for the AR-glass composition with refused coal ore and 7 mass% zirconia, ARGF_CNX, where X denotes the refused ore content percentage. The recommended AR-glass composition has a zirconia content of 7 mass%.14) Figure 1 illustrates the glass preparation process. After mixing the raw materials, they were placed into a crucible, and melted in a box furnace at 1650℃ for 2 h. Some of the melted glass was then poured into a graphite mold to fabricate the sample. To remove any stresses, the AR-glass and E-glass compositions were annealed in the box furnace at 521 ± 10 and 621 ± 10℃, respectively, for 2 h.15) As shown in Fig. 2, single filaments were fabricated after fiberizing the glass samples. The bulk glass softening points were measured using a softening point apparatus (SP-3A, ORTON, USA). To measure its optical properties, the annealed glass was highly polished to about 3 mm. The transmittance of the visible light region was measured using a UV/Vis/IR spectrometer (V570, JASCO, JAPAN). The haze was also measured using a haze meter (NDH 5000, NIPPON DENSHOKU, JAPAN). The viscosity of the glass was measured using a rotation cylinder viscometer (BROOKFIELD DV-II+Pro, USA) from 1400 to 1200℃ at 50℃ intervals. To test their chemical properties, the glass fibers were immersed in a 12.5 pH solution of 0.88 g/L NaOH, 3.45 g/L KOH, and 0.48 g/L Ca(OH)2. The treating time ranged from 0 to 72 h and the experimental solution was maintained at 80℃ during the process. After treatment, the state of the glass fiber surfaces was observed using an FE-SEM.16) The tensile strength of the glass fibers was determined by following the ASTM D3379-75 standard, using an Instron 5544 universal materials testing machine with a 10 N load cell (2712-013) and a gauge length of 20 mm, at a testing speed of 0.5 mm/min. The tensile strength was measured at least 30 times, and the results are reported as the mean ± standard deviation to improve the reliability of the data.
Table 1
Chemical composition of refused coal ore (mass%).
| |
SiO2 |
Al2O3 |
Na2O |
CaO |
K2O |
MgO |
TiO2 |
Fe2O3 |
SO3 |
Refused
coal ore
(Normal) |
81.1 |
12.0 |
0.18 |
0.06 |
3.36 |
0.28 |
0.51 |
0.51 |
1.96 |
Table 2
Batch composition of glass samples.
| Raw materials |
Exp. CNAR-Glass Batch Composition (mass%) |
| EGF (E-glass fiber) |
ARGF_Z7 (AR-glass fiber) |
ARGF_CN30 |
ARGF_CN35 |
ARGF_CN40 |
ARGF_CN45 |
ARGF_CN50 |
| Refused coal ore (CN) |
|
|
30 |
35 |
40 |
45 |
50 |
| SiO2 |
41.5 |
55.2 |
35 |
27 |
22 |
17 |
12 |
| Al2O3 |
10.6 |
0.7 |
|
|
|
|
|
| K2CO3 |
0.3 |
|
|
|
|
|
|
| CaCO3 |
30.1 |
7.4 |
5 |
5 |
5 |
5 |
5 |
| MgCO3 |
0.9 |
5.4 |
3 |
3 |
3 |
3 |
3 |
| H3BO3 |
15 |
|
|
|
|
|
|
| BaCO3 |
|
2.7 |
3 |
3 |
3 |
3 |
3 |
| ZrSiO4 |
|
8.5 |
9 |
9 |
9 |
9 |
9 |
| (ZrO2) |
(0) |
(7) |
(7) |
(7) |
(7) |
(7) |
(7) |
| Na2CO3 |
1 |
20.1 |
18 |
18 |
18 |
18 |
18 |
| Fe2O3 |
0.2 |
|
|
|
|
|
|
| TiO2 |
0.4 |
|
|
|
|
|
|
| Total |
100 |
100 |
100 |
100 |
100 |
100 |
100 |
3. Results and Discussion
3.1 Chemical composition of the glasses
Table 1 shows the inductively coupled plasma (ICP) elemental analysis results of the refused coal ore. The main refused coal ore components are SiO2 and Al2O3, with the content of the latter being about 10%. Therefore, the Al2O3 content in the glass fibers will increase with increasing refused coal ore content, which is important because Al2O3 can improve the working, mechanical, and alkali-resistant properties of the glass fibers. Changing the ratios of the raw materials allows us to manufacture glass with the target physical and chemical properties. Table 2 shows the different glass batch compositions. After the zirconia content of the ARGF_CN samples was fixed, the amount of refused coal ore was varied within the 30–50 mass% range. The SiO2 content was also varied, while the sum of the CaCO3, MgCO3, BaCO3, ZrSiO2, and Na2CO3 components was fixed for all samples. We decided to use amounts of refused coal ore over 20 mass% because, in a previous paper, at this content it was possible to fiberize the glass fibers. The amount of refused coal ore was limited to <50 mass%, as above this level the total sum of the components would be over 100%. The ARGF_Z7 and EGF samples did not contain refused coal ore. In addition, as Fe2O3 was one of the components of the refused coal ore, some Fe2O3 was added to the EGF sample in order to study the effect it had on the glass fiber when it was made in bulk. These glass samples had a light green color due to the Fe2O3.
3.2 Optical properties of the glasses
Figure 3 shows the bulk glass and glass fibers. The visible transmittance was measured using a spectrophotometer. Table 3 lists the optical properties for the three different glass compositions, where it can be observed that the visible transmittance of all samples was above 85%, which is similar to the visible transmittance levels measured for commercial plate glasses. The transmittance of the ARGF_CN30 and ARGF_CN50 samples slightly decreased from 88.7 to 87%, respectively. The transmittance of the EGF and ARGF_CNX samples were ~1–5% lower than that of ARGF_Z7. This is due to the effect of Fe2O3, as a change in the redox conditions causes a change in the coloring and an increase in the light interruption of the glass.17) However, this does not pose a problem because the difference between the transmittance and haze values of ARGF_CN samples was 1%.

Table 3
Optical properties of glass samples.
| Sample name |
Light Transmittance (%) |
HAZE |
| EGF |
85.3 |
1.25 |
| ARGF_Z7 |
90 |
1.5 |
| ARGF_CN30 |
88.7 |
0.27 |
| ARGF_CN35 |
88.1 |
0.36 |
| ARGF_CN40 |
87.4 |
0.41 |
| ARGF_CN45 |
87.6 |
0.42 |
| ARGF_CN50 |
87.0 |
0.63 |
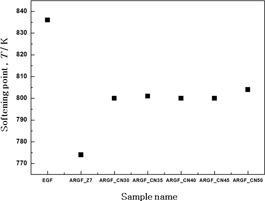
It is important to study the thermal properties of the glass fibers in order to determine their thermal resistance when used in reinforcing materials. In addition, the bulk glass thermal properties are also an important factor to consider when determining the fiberizing conditions. The softening point of normal AR-glass fibers is 774℃, while that of ‘BF(Boron free)’ E-glass fibers is 916℃, and that of S-glass fibers with high strength and thermostability is 1050℃.18) The softening point is the temperature at which the glass viscosity is equal to 107.6 P, and is an important parameter to take into account when deciding the process conditions for the working point of glass.19,20) As seen in Fig. 4, the softening points of the ARGF_CN samples fell within the 800–805℃ temperature range. Because their target composition was the same, we could confirm that the temperature difference of the softening point for these samples was ±5℃. In reference data, the softening point of E-glass is reported to be 836℃; therefore, we obtained data that was similar to the reference data.20–22) When comparing the results of the ARGF_CN samples with those of the E-glass fiber, the ARGF_CN samples have a 31–36℃ lower softening point. On the other hand, the softening point of the ARGF_CN samples was 26–31℃ higher than that of the ARGF_Z7 samples.
The glass viscosity is an important property of glass fiber materials, as it influences the parameters of the processing technique utilized. The temperature dependence of the glass viscosity was calculated by the Arrhenius method using the following equation:21)
| \[
\eta = \eta_{0}\ \exp [{\rm E}_{\eta}/({\rm RT})]
\] |
where η
0 is the viscosity (poise), R is the ideal gas constant, T is the absolute temperature, and E
η is the viscous flow activation energy. The value of the softening point (10
7.6 dPas) was determined accurately through the measurements, but it was difficult to calculate values from 10
13 dPas (low temperature) to 10
4 dPas (high temperature) using the Arrhenius equation. However, it is possible to predict the viscosity of glass using the following equation described by Vogel-Fulcher-Tammann (VFT):
24)
| \[
\log_{\eta} = {\rm A} + {\rm B} ({\rm T} - {\rm T}_{0})
\] |
Using the VFT equation, we obtained the viscosities of the ARGF_CN and EGF samples shown in
Fig. 5. The temperature at which the viscosity of glass is 10
3 P (the log3 forming temperature) is indicated.
23) The fiberizing temperature (T
F) of E-glass is widely known to fall within the 1140–1185℃ range,
24) and in our study the log3 temperatures of ARGF_CN30 and ARGF_CN50 were 1345 and 1334℃, respectively. In a previous study, the fiberizing temperature of AR-glass that contained a zirconia content of about 16 mass%, called “Cemfil glass,” was reported to be 1470℃, which is hardly a condition
25). However, we were able to confirm that the fabricated composition was lower than that of Cemfil glass by about 130℃. Compared with EGF, the viscosity of the ARGF_CN40 sample was high at the log3 temperature (178℃), low at the log5 temperature (79℃) temperature, and similar at the log7.6 temperature (19℃). Therefore, these results prove that the ARGF_CN compositions can be used during low fiberizing temperature process conditions.
3.5 Alkali-resistance of glass fibers
Figure 6 shows the FE-SEM images of the surface morphologies of ARGF_CN and EGF samples after 72 h treatment in alkaline solution. The EGF sample was severely attacked by the alkaline solution after 48 h. There is a flake structure present on the fiber surface. An alkaline solution may penetrate into the net structure of the glass fiber and cause reactions that destroy the original structure26). Figure 7 shows schematically the evolution of different layers, which influence the main degradation process. The element concentrations are not evenly distributed, which leads to evaluations of different depth of the layers along the glass fiber surface. These results show that weak point and defects will grow notably due to chemical attack leading to reduction of strength, without application of any mechanical load27). On the other hand, the ARGF_CN samples ((b)–(f)) did not show any obvious signs of corrosion on the glass fiber after 72 h, though there is visible progression in the surface reactions. Through this, it was shown that the ARGF_CN samples had excellent alkali resistant properties, particularly when the refused coal ore content was 40 mass%. The reinforced fibers can be considered superior to normal E-glass fibers.

Deviations in the tensile strength values of the glass fibers occurred due to the formation of pores on the fibers during the fiberizing process, and the appearance of fine cracks and stresses induced during the cooling process. Therefore, we conducted the tensile strength tests at least 30 times in order to reduce the glass strength error, and we calculated the standard deviation of the tensile strength values. For these studies, we tested glass fibers that had been immersed in the alkaline solution, and we compared the percentage reduction in tensile strength after 48 h and 72 h. The test results are shown in the Table 4. We used fiber diameters from 50 to 150 μm. Thus, it was observed that the strength was different when compared with 15 um E-glass fiber. The remaining strength of the EGF sample was 46% after 48 h, and it continued to decrease until reaching a constant value of 28% in 72 h. The strength of the E-glass sample dropped to 1/3 of its original value in 72 h, after the sample had been dipped in the alkaline solution. The ARGF_CN strengths were reduced to 72% and 62% after 48 h and 72 h, respectively. After 48 h, the ARGF_CN40 sample showed the smallest change in strength and standard deviation, with a strength value maintained at 72% with a standard deviation of 25.2 MPa. On the other hand, the ARGF_CN45 sample showed a strength value of 65%, which was reduced 0.9 times compared with ARGF_CN40, and a standard deviation of 107 MPa, which was 4 times bigger than that of ARGF_CN40. As a result, when refused coal ore was added until 40 mass%, we were able to judge. The strength of the ARGF_Z7 sample was reduced to 84% in 48 h, and 55% in 72 h. The strength of the ARGF_CN40 sample initially decreased over 48 h, but increased by 1.1 times after 72 h. From the results, we can conclude that ARGF_CN glass fibers can be used as long-term reinforcing fibers in alkaline materials.
Table 4
Tensile strength of glass fiber samples after alkali tests.
| Type |
Sample name |
Fiber diameter (um) |
Tensile strength (MPa) |
Rate of tensile |
| range |
Average |
Strength change (%) |
| E-glass |
EGF |
52~99 |
456~588 |
520(±66)** |
100 |
| EGF(48)* |
173~498 |
240(±128)** |
46 |
| EGF(72)* |
124~175 |
146(±18)** |
28 |
| AR-glass |
ARGF_Z7 |
50~95 |
385~783 |
505(±165)** |
100 |
| ARGF_Z7(48)* |
292~713 |
423(±93.1)** |
84 |
| ARGF_Z7(72)* |
212~405 |
277(±30.8)** |
55 |
| AR-glass |
ARGF_CN30 |
51~89 |
336~705 |
539(±137)** |
100 |
| ARGF_CN30(48)* |
269~377 |
314(±39.1)** |
58 |
| ARGF_CN30(72)* |
266~370 |
306(±38.8)** |
56 |
| ARGF_CN35 |
53~95 |
304~641 |
468(±108.6)** |
100 |
| ARGF_CN35(48)* |
246~357 |
302(±39.1)** |
65 |
| ARGF_CN35(72)* |
237~327 |
274(±36.2)** |
59 |
| ARGF_CN40 |
54~97 |
400~604 |
474(±76.1)** |
100 |
| ARGF_CN40(48)* |
307~382 |
343(±25.2)** |
72 |
| ARGF_CN40(72)* |
259~381 |
296(±36.7)** |
62 |
| ARGF_CN45 |
50~99 |
371~620 |
475(±81)** |
100 |
| ARGF_CN45(48)* |
259~619 |
307(±107)** |
65 |
| ARGF_CN45(72)* |
225~292 |
258(±24.4)** |
54 |
| ARGF_CN50 |
53~96 |
276~790 |
442(±144)** |
100 |
| ARGF_CN50(48)* |
264~398 |
316(±71)** |
71 |
| ARGF_CN50(72)* |
224~414 |
297(69)** |
67 |
() *: hours in alkaline solution.
() **: Standard deviation.
4. Conclusions
In order to recycle refused coal ore, we fabricated glass fibers composed of refused coal ore and zirconia. The amount of refused coal ore in the fibers ranged from 30 to 50 mass%, in 5% batch increments. We obtained transparent glasses with high visible light transmittance values of 85–90%, which are similar to those of commercial plate glasses. In addition, our glass also showed favorable optical properties. The measured softening point values fell within the 800–804℃ range, regardless of the amount of refused coal ore used. Compared with the EGF sample, a 31–36℃ lower softening point was observed for the glass fibers containing refused coal ore. Furthermore, the ARGF_CN40 sample, in comparison to the EGF sample, showed a high log3 viscosity temperature value of about 178℃. This value was lower than the log3 viscosity temperature of commercial AR-glass by about 130℃. From FE-SEM observation, the ARGF_CN40 sample, after being dipped in the alkaline solution for 48–72 h, was observed to have the best alkali-resistant properties. In regards to the sample's tensile strength, the tests were conducted after the samples had been dipped in the alkaline solution, in order to measure the changes induced on the sample's tensile strength by the alkali exposure. The strengths of the EGF and ARGF_CN40 samples were reduced to 28% and 62%, respectively, after 72 h of being immersed in the alkaline solution. In conclusion, AR-glass fibers made up of refused coal ore and zirconia can be widely used as alkali resistant glass fibers with a high tensile strength and low fiberizing temperature.
Acknowledgements
The research is financially supported by a research grant (project no. GPI15122-2) from local industry fostering business with public institutions (technology development).
REFERENCES
- 1) K. L. Loewenstein, Manufacturing Technology of Continuous Glass Fibers, (Elsevier, Amsterdam, 1993) p. 31.
- 2) C. Scheffler and S.L. Gao: Compos. Sci. Technol. 69 (2009) 531–538. 10.1016/j.compscitech.2008.11.027
- 3) F. T. Wallenberger: Advanced Inorganic Fibers, (Kluwer Academic, Boston, 1999) p. 102.
- 4) M. B. Volf, Chemical Approach to Glass, (Elsevier, Amsterdam,1984) p. 306.
- 5) Y.W. Ryu and Y.T. Kim: J. Korean Cryst. Growth and Cryst. Techn. 19 (2009) 208–213.
- 6) S.M. Song, J.B. Jang, B.S. Cho, J.H. Kim, Y.R. Kim and M.H. Kim: J. Architect. Inst. of Korea 23 (2003) 202.
- 7) K.D. Kim and S.G. Kang: J. Korean Cryst. Growth and Cryst. Techn. 17 (2007) 277–282.
- 8) U.S. Patent 5, 278, 111 (1994).
- 9) R.R. Menezes, H.S. Ferreira, G.A. Neves and H.C. Ferreira: J. Eur. Cera. Soc. 25 (2005) 1149–1158. 10.1016/j.jeurceramsoc.2004.04.020
- 10) M. Dondi, G. Guarini and I. Venturi: J. Eur. Cera. Soc. 22 (2002) 1737–1747. 10.1016/S0955-2219(01)00494-0
- 11) K.W. Kim, Y.S. Doh and X.F. Li: J. Kor. Soc. Agricul. Eng. 43 (2001) 132–139.
- 12) S.M. Han, D.Y. Shin and S.K. Kang: J. Kor. Cer. Soc. 35 (1998) 575–582.
- 13) KR Patent 101998033799 (1998).
- 14) F. T. Wallenberger: Advanced Inorganic Fibers, (Kluwer Academic, Boston, 1999) p. 147.
- 15) F.T. Wallenberger: Glass Fibers ASM Handbook: Composites 21 (2001) 27–35.
- 16) F. T. Wallenberger: Advanced Inorganic Fibers, (Kluwer Academic, Boston, 1999) p. 146.
- 17) T.Y. Lim, S.S. Jeong, J.H. Hwang and J.H. Kim: J. Korean Cryst. Growth and Cryst. Techn. 20 (2010) 43–52. 10.6111/JKCGCT.2010.20.1.043
- 18) F. T. Wallenberger: Advanced Inorganic Fibers, (Kluwer Academic, Boston, 1999) p. 137.
- 19) H. J. Jung: Fusion Ceramic Materials (Text book for High School) (Ministry of Education Science and Technology, Korea, 2003) pp. 193.
- 20) T. Suzuki: Data book of Glass Composition, (The Glass Manufacturer's Association, Japan 1991) p. 134.
- 21) F. T. Tooley: The Handbook of Glass Manufacture, (Books For the Glass Industry Division, New York, 1984) pp. 893–956.
- 22) H. Rawson: Properties and Applications of Glass: Glass science and Technology, Vol 3., (Elsevier, Amsterdam, 1980) pp. 32–60.
- 23) F. T. Wallenberger: Advanced Inorganic Fibers, (Kluwer Academic, Boston, 1999) p. 132.
- 24) J.S. Lee and T.Y. Lim: J. Korean Cryst. Growth and Cryst. Techn. 23 (2013) 180–188. 10.6111/JKCGCT.2013.23.4.180
- 25) K. L. Loewenstein, Manufacturing technology of continuous glass fibers, (Elsevier, Amsterdam, 1993) p. 32.
- 26) B. Wei, H. Cao and S. Song: Materials and design 31 (2010) 4244–4250. 10.1016/j.matdes.2010.04.009
- 27) J. Orlowsky and M. Raupach: Mater. Struct. 38 (2005) 155–162. 10.1617/14248


