Effect of Compound Layer Thickness Composed of γ'-Fe4N on Rotated-Bending Fatigue Strength in Gas-Nitrided JIS-SCM435 Steel
2017 Volume 58 Issue 7 Pages 993-999
Details
2017 Volume 58 Issue 7 Pages 993-999
The rotating bending fatigue strength of gas nitrided JIS-SCM435 steel was evaluated to find the thickness that gives the highest bending fatigue strength. Four specimens were used that had different compound layer thicknesses composed of γ' (-Fe4N) phase: 0, 2, 10, and 20 μm. The composition of γ' phase was more than 70% of the volume of the compound layer in the specimens. The increment of the fatigue strength at 105–107 cycles was remarkably high when the compound layer thickness was from 0 to 10 μm and gradually increased from 10 to 20 μm. The increment of the fatigue strength was caused by the increment of the γ' phase thickness and the compressive residual stress depth as the compound layer thickness increased. The gradually increasing fatigue strength of more than 10 μm thickness was responsible for the porous layer thickness increasing and the compressive residual stress reducing on the surface as the compound layer thickness increased. These findings show that the fatigue strength of gas-nitrided JIS-SCM435 steel composed of γ' phase depends on not only the compound layer thickness but also the porous layer thickness and the compressive residual stress of the compound layer.
Gas-nitriding is a commonly used method of surface hardening treatment of steel. The treatment is popular because it does not change the size or shape of the steel part that it is applied to. An accompanying surface hardening treatment can also be used to improve the abrasion and fatigue properties. Recently, not only high fatigue strength but also high precision in the size and shape of the part is required after the surface hardening treatment, and gas-nitriding has attracted attention as a way to meet these requirements. After nitriding, the outermost surface of the steel consists of an upper compound layer of iron nitride (e.g., γ' (Fe4N) and ε (Fe2-3N)) and a lower diffusion layer. The diffusion layer is a hardened zone about 0.2 to 1.0 mm in depth from the surface, and it improves the fatigue strength. On the other hand, the compound layer is typically about 10–20 μm thick and is harder than the diffusion layer. It decreases friction loss. Most reports have focused on the hardness profile of the diffusion layer to improve bending fatigue strength in low alloy steels1–5). However, the compound layer also affects the fatigue strength. As nitriding atmosphere control technology has advanced, it has been revealed that the compound layer formation in the low alloy steels increases the rotating bending fatigue strength6–8). On the other hand, Kubota et al. also reported that the rotating bending fatigue strength in gas-nitrocarburized JIS-SCM435 increased as the compound layer thickness increased in the case of ε phase9). Here, we report that in gas-nitrided JIS-SCM435, the compound layer composed of γ' phase has a higher fatigue strength than that composed of ε phase6). This means the design of high-strength mechanical parts should take into consideration the γ' phase and its thickness. However, the fatigue strength of the compound layer thickness composed of γ' phase has not yet been sufficiently studied.
In this study, bending fatigue tests were conducted on gas-nitrided SCM435 with different compound layer (γ'-Fe4N) thickness to find the thickness that gives the highest bending fatigue strength.
Chromium-molybdenum steel JIS-SCM435 was used in this study. The chemical composition of the steel is shown in Table 1. Round bars with φ19 in diameter and 230 mm in length were cut in the rolling direction (RD) from the as-received commercial steel. They were then hardened at 1133 K and tempered at 873 K. After that, the fatigue specimen with the notch shown in Fig. 1 was prepared (stress concentration factor: Kt = 2.4510)).
| C | Si | Mn | Cu | Ni | Cr | Mo |
|---|---|---|---|---|---|---|
| 0.36 | 0.21 | 0.79 | 0.14 | 0.07 | 1.14 | 0.15 |

Geometry of bending fatigue test specimen.
Firstly, the surface of the test materials was cleaned with acetone. Then the gas-nitriding was performed in a pit type furnace (80 kg/gross) with the nitriding potential control system11). The nitriding conditions are shown in Table 2.
| No | Materials | Temperature[K] | Time[ks] | KN[atm−1/2] | Gas compositions |
|---|---|---|---|---|---|
| 1 | Compound layer less | 853 | 10.8 | KN = 0.15 | NH3+AX(H2:N2 = 3:1) |
| 2 | γ’-2 μm | 10.8 | KN = 0.2 | NH3+AX(H2:N2 = 3:1) | |
| 3 | γ’-10 μm | 7.2 | KN = 0.3 | NH3 | |
| 4 | γ’-23 μm | 11.4 | KN = 0.3(3.6 ks) → KN = 1.2(7.2 ks) → KN = 0.3(0.6 ks) | NH3+AX(H2:N2 = 3:1) |
To clarify how the compound layer thickness affects the fatigue strength, four different kinds of nitriding potentials were selected to obtain 0 μm, 2 μm, 10 μm, 20 μm in the compound layer thickness under the nitriding temperature at 853 K. The nitriding time was decided by considering both the compound layer thickness and the total case depth (≒0.5 mm). For specimen No. 4, a three-stage nitriding process was performed. This was done to increase the volume fraction of γ' phase in the compound layer. The first stage was intended to control the carbon concentration that destabilizes γ' phase12) under the nitriding potential (KN = 0.15). In this nitriding atmosphere, no compound layer formed. Therefore, the nitriding atmosphere promoted decarburization from the surface13). The second and the third stages were intended to control both the compound layer thickness and the volume fraction of γ' phase accompanying phase transformation from ε phase to γ' phase11). After nitriding, furnace cooling was performed under the remaining KN from 853 to 723 K, and below 723 K, the cooling continued under N2 gas until room temperature6).
2.3 Bending fatigue testTo obtain an S-N curve, an ono-type rotating-bending fatigue test was performed for the specimens (No.1~No.4 and As QT (quenching and tempering)) at 3000 rpm. The maximum stress amplitude was controlled at the stress ratio (σmax/σmin) R = −1. The test was stopped when the number of cycles arrived at 107 cycles, which was defined as the fatigue limit.
2.4 Analysis of gas-nitrided layerAfter gas-nitriding, test materials were cut in the direction orthogonal to the longitudinal direction (RD) in the parallel portion. Several analyses were performed for the cross section. Hardness profiles were measured by a microindentation machine equipped with a Vickers indenter with a load of 0.98 N. Compound layer thickness analyses by an optical microscope, pore shape analyses by FE-SEM (Field-Emission Scanning Electron Microscopy), phase and orientation analyses by EBSD (Electron Back Scatter Diffraction) were performed on the test materials. Residual stress depth profiles were measured by an X-ray with sin2φ method in the longitudinal direction (RD) for the parallel portion. Stepwise removal of 5-mm-diameter circular surface layers via electropolishing was performed to obtain the depth profiles from the surface to 400 μm depth. The Cr-Kα radiation was used that gave diffraction from α phase (211), ε phase (103), and γ' phase (220). X-ray stress constant of ε phase (103) used −611 MPa/deg14), whereas that of γ' phase (220) has not been obtained yet, so −611 MPa/deg was used to calculate the residual stress of γ' phase as a references value. The fatigue fracture surfaces after the rotating bending tests were analyzed by FE-SEM to analyze the initial crack propagating regime and the crack propagating behavior.
Optical micrographs near the surface of the specimens are shown in Fig. 2. The phase and orientation analysis by EBSD in the form of the inverse pole figure (IPF) in the RD plane for compound layers is shown in Fig. 3.

Optical micrographs near the specimen surface in the cross section after the treatment of gas-nitriding: (a) No.1 (Compound layer less) (b) No.2 (γ'-2 μm) (c) No.3 (γ'-10 μm) (d) No.4 (γ'-20 μm).
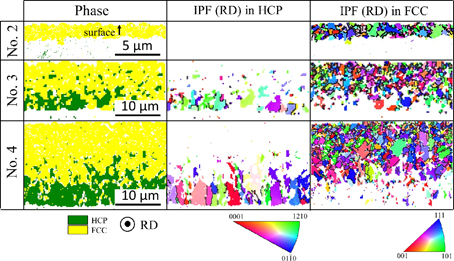
Phase and orientation analyses by EBSD as inverse pole figure (IPF) in the RD plane for compound layers of specimen No.2, No.3 and No.4. High angle grain boundaries (misorientation angle higher than 15 degree) are drawn by black color.
The results were as expected, i.e. no compound layer formed in specimen No. 1. The compound layer thickness was 2 μm, 10 μm, and 20 μm in specimen No. 2, No. 3, and No. 4, respectively. The phase was almost all γ' phase in No. 2, while in No. 3 and No. 4, the same phase was only in the area near the surface. In these core areas close to the diffusion layer, the phases were mostly ε phase. The volume fraction of the γ' phase in the compound layer was about 70% in No. 3 and No. 4. The γ' phase had equiaxed grains, while ε phase had columnar grains. Most of the grain boundaries were high-angle grain boundaries, shown in black in Fig. 3 (IPF). The mean grain size at γ' phase was about 0.5 μm in No. 2, about 1.5 μm in No. 3, and about 1.0 μm in No. 4. The SEM image near the specimen surface are shown in Fig. 4. There was porous area (defined as porous layer) in all the specimens. The porous layer thickness was about 0.5 μm in No.2, about 3.5 μm in No.3, and about 7.0 μm in No.4. This indicates that the porous layer thickness increases as the compound layer thickness increases. The shape of most of the pores was granulated. In No.4, the pore size was the finest and there were the highest number of pores, while the presence of coarser pores at a depth of about 6 μm from the surface was confirmed. Much denitrification occurred because of the phase transformation from the ε phase to the γ' phase during the gas-nitriding in No.4. In addition, the denitrification in the inner area was more difficult than that of the surface area because the denitrification needs long range diffusion toward the surface. Therefore, the pores of the inner area grew bigger than those of the surface area due to generation of N2 gas15). On the other hand, the pore size was the coarsest in No.3, and the number of pores in No.3 was more than that in No.2. The comparative mean pore size was the smallest in No.4 except for that of the coarser pores in the inner area, while the largest comparative mean pore size was in No.3.

Secondary electron images of the compound layers in the cross section: (a) No.2, (b) No.3 and (c) No.4.
Residual stress depth profiles in the compound layer are shown in Fig. 5. They were measured for the compound layer only on the surface in No.2, from the surface to 10 μm depth in No.3, and from the surface to 20 μm depth in No.4. The diffraction from ε (103) was used except for the solid marks in the compound layer. The solid marks indicate the diffraction from γ' (220) was used. The results for No.1 are shown for comparison. The residual stress was only compressive stress in all specimens. The residual stress increased as the depth deepened in the compound layer except for No.4, in which the maximum residual stress was obtained at 10 μm depth in the compound layer. The surface residual stress was −853 MPa in No.2, −678 MPa in No.3, and −527 MPa in No.4. Therefore, the minimum surface residual stress (−853 MPa) was obtain in No.2, which had the thinnest compound layer (2 μm), whereas the maximum one (−527 MPa) was obtained in No.4, which had the thickest compound layer (20 μm). On the other hand, the residual stresses at more than 5 μm depth were smaller in No.4 than in No.3 (No.1 had only the surface as the compound layer), i.e. the residual stress were −566 MPa and −746 MPa in No.3 and No.4 at 5 μm depth and −151 MPa and −751 MPa in No.3 and No4 at 10 μm depth.

Residual stress distribution near the specimen surface. Solid marks indicate the reference values using the diffraction profiles of γ'-Fe4N(220) and the stress constant of ε-Fe3N(103).
Based on these findings, the compound layer thickness and the phase were as expected in the specimens, but the size, the number of the pores, the grain size, and the compressive residual stress in the γ' phase were changed depending on the compound layer thickness. These elements affected the results of the bending fatigue test as well as the compound layer thickness.
3.2 Characteristics of diffusion layerHardness profiles are shown in Fig. 6. The specimens barely differed except for the hardness at 0.05 mm depth in No.1, which was about 50 HV lower than that of other specimens. Total case depth was 0.5 mm in all specimens.

Hardness profiles in the diffusion zone of the specimens.
Residual stress profiles are shown in Fig. 7. The residual stress was only compressive stress in the depth from 50 to 400 μm in the specimens. The smallest was about −270 MPa at 0.1 mm depth in all specimens. The residual stress increased as the depth deepened from 0.1 to 0.4 mm. The residual stress at 0.05 mm depth in No.1 and No.3 was about 70 MPa higher than that in No.2 and No.4. The residual stress from 0.2 to 0.4 mm in No.1 and No.3 was also about 60 MPa higher than that in No.2 and No.4. It is assumed that these slight differences in the residual stresses in the specimens are caused by a difference in the nitrogen concentration at certain depths. This is because the low nitriding potential and the short nitriding time were selected as the gas-nitriding conditions in No.1 and No.3, respectively.

Residual stress distribution in the diffusion zone of the specimens.
The effect of the slight difference in the hardness and the residual stress of the specimens on the results of the fatigue test will be mentioned in section 4.
3.3 Bending fatigue testThe results of the rotating bending fatigue test are shown in Fig. 8. The vertical axis shows maximum stress amplitude (σa) as nominal stress without considering stress concentration calculated by the minimum cross-sectional area. The fatigue limit (fatigue strength of 107 cycles) was 579 MPa in No.4, 549 MPa in No.3, 441 MPa in No.2, 290 MPa in No.1, and 234 MPa in As QT.

S-N data by rotating-bending fatigue test. As quenched and tempered material (As QT) was evaluated as a reference.
The representative fracture surfaces in the specimens are shown in Fig. 9. The initial crack propagated from the surface in No.1 (Fig. 9 (c)). The trace that an initial crack propagated from the compound layer accompanying the peeling was found in No.2 (Fig. 9 (f)). An initial crack propagated from the compound layer in No.3 and No.4, but the surface area in the compound layer was a brittle fracture (Fig. 9 (i), (l)). The difference between the compound layer and the diffusion layer was able to be distinguished visually on the fracture surface. Furthermore, these brittle fractures in the compound layer continued along the entire circumferential direction (Fig. 9 (h), (k)). The final fracture area existed in the inner part of the fracture surface (Fig. 9 (a), (d), (g), (j)). Therefore, an initial crack propagated from the surface in No.1, and from the compound layer in No.2, No.3 and No.4. After that, these cracks propagated toward the core. Finally, the final failure took place in the inner part of the materials. The crack propagation route was clarified in these analyses, but the crack initiation point was not. Therefore, a microcrack near the notch root after 107 cycles was observed by FE-SEM as shown in Fig. 10. A microcrack reaching about 2 μm deep from the surface was found in No.1 whereas the internal microcracks of the γ' phase area in the compound layer were found in No.2, No.3, and No.4. The internal microcrack had a different configuration depending on the specimen. An internal microcrack about 2 μm long was seen below the porous layer in No.2. Internal microcracks about 1 μm long were seen within the porous layer independently in No.3, whereas those in No.4 were seen as discontinuous in line, in total about 7 μm long, and perpendicular to the surface. As mentioned later, it is considered that the internal microcracks in No.3 and No.4 were changed in shape from a pore by the plastic deformation in γ' phase during the bending fatigue test. Therefore, it is assumed that the shape of the internal microcrack in the specimens was affected by conditions after the gas-nitriding, i.e., the porous layer thickness, the pore distribution, and the pore shape.

Fractured surfaces of the tested specimens of (a) No.1, σa = 350 MPa, 7.7 × 10⁵ cycles, (d) No.2, σa = 450 MPa, 4.3 × 10⁶ cycles, (g) No.3, σa = 588 MPa, 1.1 × 10⁶ cycles and (j) No.4, σa = 608 MPa, 4.7 × 10⁵ cycles. Photographs (b), (e), (h) and (k) are magnified images of photographs (a), (d), (g) and (j) in the initial crack propagating regime, respectively. dcl and ddz represent the thickness of compound layer and diffusion zone. Photographs (c), (f), (i) and (l) show crack initiation sites of the specimens.

Microcracks near the notch root of test specimens in the cross section after 107 cycles: (a) No.1, σa = 290 MPa, (b) No.2, σa = 441 MPa, (c) No.3, σa = 549 MPa and (d) No.4, σa = 579 MPa.
Based on these findings, the initiation crack point and the crack propagation route in the specimens were revealed as shown in the results above. The surface internal microcrack was generated from a pore in the γ' phase in specimens No.2, No.3, and No.4. The microcrack had also a different configuration depending on the compound layer thickness with the porous layer. Therefore, not only the γ' phase but also the condition of the porous layer affected the results of the rotating bending fatigue test.
The relationship between the fatigue limit and the compound layer thickness is shown in Fig. 11 using the results in Fig. 8.

The relationship between the compound layer thickness and the fatigue limit of the specimens.
The increment of the fatigue limit was remarkably high until the compound layer thickness was 10 μm; then it increased gradually from 10 μm to 20 μm. These results indicate that the fatigue limit does not increase monotonously as the compound layer thickness increases. It is obvious that this tendency is also similar for the fatigue strength at 105–107 cycles as shown in Fig. 8. This result can be explained as follows.
The internal microcrack was generated from the γ' phase in specimen No.2, No.3, and No.4 after 107 cycles as shown in section 3.4. Therefore, the fatigue limits in these specimens were dominated by the initial crack generation and the growth in the γ' phase.
On the other hand, it has been reported that the effect of the diffusion layer and the ε phase on the fatigue strength at 105–107 cycles is less compared with that on the γ' phase in gas-nitrided SCM4356). In this study, the fatigue strength at 105–107 cycles in No.2 (γ'-2 μm) was about 1.5 times higher than that in No.1 (compound layer less) in spite of only a 2 μm compound layer being added to the surface. Therefore, it is considered that the fatigue strength at 105–107 cycles was similarly dominated by the above-mentioned mechanism, which occurred in the γ' phase.
It is reported that during the bending fatigue test on gas-nitrided SCM435, a pore in γ' phase deformed plastically first, then an internal microcrack was generated from the pore by the deformation, after that the microcrack grew as the fatigue crack, and finally the fatigue crack propagated toward the core6). Therefore, a characteristic of the pore and yield strength, grain size, and residual stress in the γ' phase can be listed as the improvement elements of the fatigue strength at 105–107 cycles in addition to the γ' phase thickness. Besides these elements, the apparent roughnesses after gas-nitrided specimens were measured by a laser scanning microscope for the notch root6). Those were about Rz ≒ 2.0 μm in the specimens, so the roughness barely differed among these nitriding conditions of the specimens. Incidentally, the yield strength of the γ' phase was higher than that of the diffusion layer in gas-nitrided SCM4356). It is presumed that the yield strength of the γ' phase was the same among the specimens because the same nitriding temperature and the same steel as SCM435 were used. Thus, the following explanation is focused on the characteristics of the pore and the grain size, and the residual stress in the γ' phase.
It is considered that a pore in the γ' phase becomes an initial crack site during the fatigue process, so the increment of the number of pores reduces the fatigue strength. On the other hand, the fatigue strength is also considered to be reduced by the increment of the porous layer thickness because of shifting the site of an internal crack generation deeper toward the core. Furthermore, the shape of a pore is considered to affect the fatigue strength, too. The internal microcracks were developed from the granular shape pore in No.3 and No.4. Although it is not confirmed, the deformed configuration of the pore is shown clearly in Fig. 10 (b) in No.2, but it is considered that the microcrack was also developed from a pore because the microcrack grew from the surface around existing pores. It is considered that a small pore developed into a fatigue microcrack more easily than a bigger pore because it did not need much deformation to become a microcrack. Incidentally, the comparative mean size of the pore was smallest in No.4 and biggest in No.3 as shown in Fig. 4. Therefore, it is concluded that the effect of the porous layer on the fatigue strength was the most disadvantageous in No.4 by considering all these effects of the pore, i.e. the density, the layer thickness, and the shape. However, this effect of specimen No.2 was better than that of No.3 except for the effect of the pore shape.
Secondarily, the effect of the grain size of the γ' phase is explained as follows. The fatigue strength generally becomes higher as the grain size becomes finer16). On the other hand, the grain orientation also affects the fatigue strength, but most grain boundaries were high angle grain boundaries with equiaxed grains in the γ' phase in specimens No.2, No.3, and No.4. Therefore, grain size is the most important element in this case. As shown in section 3.1, the mean grain size of the γ' phase was finest in No.2 (≒0.5 μm), next finest in No.4 (≒1.0 μm) and coarsest in No.3 (≒1.5 μm). Therefore, specimen No.2 was the most advantageous, whereas specimen No.3 was the least.
Finally, the effect of the residual stress in the γ' phase is explained as follows. High compressive residual stress has an advantage at suppressing fatigue growth17). The surface compressive residual stresses in Fig. 5 were highest in No.2 and lowest in No.4, whereas the compressive residual stresses below 5 μm depth in No.4 were higher than those in No.3 (No.1 had only the surface as the compound layer).
The above discussions are summarized in Table 3. From these results, it is concluded that the increment of the fatigue strength was caused by the increment of the γ' phase thickness and the compressive residual stress depth as the compound layer thickness increased. The gradual increment of the fatigue strength in the specimen more than 10 μm thick was responsible for the porous layer thickness increasing and the compressive residual stress reducing on the surface.
| No | Compoud layer thickness |
Porous | Mean grain size of γ’ phase | Compressive redidual stress in γ’ phase | ||||||
|---|---|---|---|---|---|---|---|---|---|---|
| type | density | mean size | layer thickness | surface | 5 μm depth | 10 μm depth | ||||
| 2 | data | 2 μm | granular | low | middle | 0.5 μm | 0.5 μm | −853 MPa | ― | ― |
| rank | 3 | 1 | 1 | 2 | 1 | 1 | 1 | ― | ― | |
| 3 | data | 10 μm | granular | middle | coarse | 3.5 μm | 1.5 μm | −678 MPa | −566 MPa | ― |
| rank | 2 | 1 | 2 | 1 | 2 | 3 | 2 | 2 | ― | |
| 4 | data | 20 μm | granular | high | fine | 7.0 μm | 1.0 μm | −527 MPa | −746 MPa | −751 MPa |
| rank | 1 | 1 | 3 | 3 | 3 | 2 | 3 | 1 | 1 | |
The rotating bending fatigue test was conducted by using the notched specimen (stress concentration factor: Kt = 2.45) on gas-nitrided SCM435 with different compound layer thickness, i.e. 0 μm (No.1), 2 μm (No.2), 10 μm (No.3), and 20 μm (No.4) composed of the γ' phase that had more than 70% of the volume of the compound layer to find the thickness that gives the highest bending fatigue strength. The results obtained are summarized as follows:
(1) The fatigue limit was 579 MPa in No.4, 549 MPa in No.3, 441 MPa in No.2, 290 MPa in No.1, and 234 MPa in As QT. The increment of the fatigue limit was remarkably high when the compound layer thickness was from 0 to 10 μm and gradually increased from 10 to 20 μm. This tendency was the same for the fatigue strength at 105–107 cycles.
(2) The increment of the fatigue strength at 105–107 cycles was caused by the increment of the γ' phase thickness and the compressive residual stress depth as the compound layer thickness increased. The gradually increasing fatigue strength of more than 10 μm thickness was responsible for the porous layer thickness increasing and the compressive residual stress reducing on the surface as the compound layer thickness increased.