Abstract
Biomineralization is an environmentally friendly technology for improving soil-engineering properties. One of the most common biomineralization processes is microbially induced calcite precipitation (MICP). In this study, sand solidification tests were conducted using Pararhodobacter sp., which is a local ureolytic bacteria obtained from the sand near beach rock in Okinawa, Japan. The goal of this study was to solidify a specimen having an estimated unconfined compressive strength (UCS) of more than several MPa to improve soil properties and investigate the influence of various factors on the engineering properties of treated soil catalyzed by ureolytic bacteria (curing temperature, injection interval of cementation solution, Ca2+ concentration, curing time, bacterial population, re-injection of bacteria and particle size of sand). Model test specimens were cemented up to an estimated UCS of 10 MPa after 14 days under the following conditions: a curing temperature of 30℃, an injection interval of 1 day, and a Ca2+ concentrations in cementation solution of 0.5 M. Multiple regression analysis showed that the relevant conditions for estimating UCS were test period, D (days), and Ca2+ concentration of the cementation solution, Cca (M). The formula for predicting the estimated UCS (qeu (MPa)) was qeu = 13.99 Cca + 0.37 D − 0.09. Overall, the results of this study will contribute to the application of a new technique to sand improvement and bio-stimulation.
1. Introduction
Biomineralization is a promising and environmentally innocuous technology for improving engineering properties of soil. It occurs naturally and is induced by nonpathogenic organisms that are native to the soil environment.1) One common biomineralization process is microbially induced calcite precipitation (MICP), which can bind sand grains together and improve the engineering properties of sand.
Improvement of soil mechanical properties by MICP is currently of particular interest to engineers and microbiologists, and has been demonstrated by several researchers at varying scales.1–3) The technique involves introducing aerobically cultivated bacteria with highly active urease enzyme into soil, and harnessing the urease enzyme to catalyze the hydrolysis of urea to produce ammonium and carbonate ions. The chemical reaction involved in this process is shown as follows.
| \[
{\rm CO} ({\rm NH}_{2})_{2} + 2{\rm H_{2}O}
\to
{{\rm 2NH}_{4}}^{+} + {{\rm CO}_{3}}^{2-}
\] | (1) |
In the presence of an introduced calcium source, often calcium chloride (CaCl
2), calcium carbonate (CaCO
3, calcite) forms throughout the soil matrix according to the following chemical reaction.
| \[
{\rm Ca}^{2+} + {{\rm CO}_{3}}^{2-}
\to
{\rm CaCO}_{3} {\downarrow}
\] | (2) |
The engineering properties of MICP-treated soil may vary because MICP is a complex biochemical process that can be affected by many factors. The MICP contains two key steps, as shown in eq. (1) and eq. (2). The urea hydrolysis is mainly dependent on the concentration of ureolytic bacteria and the available substrate (e.g., urea), whereas the amount of calcite precipitation is related to the concentration of Ca
2+.
4) In accordance with the growth of nutrient concentration and incubation time, the CaCO
3 content increases.
The size of soil pores should be sufficient to allow the transportation of bacteria with size of 0.5–3.0 μm in length.5) The most favorable soil particle size range for bacterial activity in the pores is reported as 50–400 μm.6) The compatibility between the grain size of soil and bacteria size is an important factor for MICP treatment. The soil pores should be has adequate size to allow the bacteria movement.5) The effectiveness of MICP on a soil can be attributed to the ability of the bacteria to move freely through the pore space and the adequate particle-particle contacts per unit volume.
In this study, solidification tests (small size: syringe test and middle size: model test) were conducted on silica sand using the ureolytic bacteria Pararhodobacter sp. that was isolated from the soil near beachrock in Sumuide, Nago, Okinawa, Japan. The goal of this study was to solidify a specimen having an estimated unconfined compressive strength (UCS) of more than several MPa to improve soil properties and investigate the influence of varies factors on the engineering properties of treated soil catalyzed by ureolytic bacteria.
2. Methodology
2.1 Syringe test for sand solidification
First, 100 mL NH4–YE medium solution ((growth media; ATCC 1376), which contained the de-ionized water consisting of 0.13 M tris buffer (pH = 9.0), 10 g (NH4)2SO4, and 20 g yeast extract) was mixed with 0.1 g of Pararhodobacter sp. (Fig. 1), then incubated at 30℃ with gentle shaking at 160 rpm for 72 h. Next, 45 g of silica sand (e.g., Mikawa sand, 97.77% quartz, Table 1) was dried at 110℃ for 2 days and then placed in a 35 mL syringe (diameter, ϕ = 2.5 cm). Subsequently, 16 mL (more than the estimated 14 mL initial pore volume in the sample) of the bacterial culture and 20 mL of the cementation solution (Table 2) were sequentially added to the syringe, and drained, leaving about 2 mL of solution above the surface of the sand to maintain the wet conditions. After curing, the cementation solution was added and drained at fixed intervals. The Ca2+ concentration and pH of the drainage were also measured to determine temporal variations of these parameters in the samples. Each test condition is described in Section 2.3.

Table 1
Physical properties of sand types.
| Sand Type |
Mizunami Sand |
Mikawa Sand |
Toyoura Sand |
Soil particle density (ρs)
(g/cm3) |
2.67 |
2.66 |
2.64 |
Minimum density (ρmin)
(g/cm3) |
1.348 |
1.256 |
1.335 |
Maximum density (ρmax)
(g/cm3) |
1.491 |
1.476 |
1.645 |
Mean diameter (D50)
(mm) |
1.2 |
0.6 |
0.2 |
Table 2
Chemical compositions for cementation media.
| Chemical |
Chemical Concentration (g/L) −0.5 M Ca |
| Nutrient Broth (g) |
3 |
| NH4Cl (g) |
10 |
| NaHCO3 (g) |
2.12 |
| (NH2)2CO (g) |
30.03 |
| CaCl2 (g) |
55.49 |
After 14 days of curing, the needle penetration inclination (NP) of each syringe sample (ϕ = 2.5 cm, height, h = 7 cm) was measured using a needle penetration device (SH-70, Maruto Testing Machine Company, Tokyo, Japan), and the UCS was estimated from the NP according to following regression equation.
| \[
\log (y) = 0.978\ \log (x) + 2.621
\] | (3) |
Where the correlation coefficient is 0.941,
x is
NP (N/mm), and
y is UCS (MPa).
2.2 Model test for sand solidification
In this study, three test cases were carried out. All test cases were conducted at room temperature (25℃), and cementation media was added daily. A plastic container (length: 20 cm × width: 12.5 cm × height: 14 cm) with a permeable plastic plate at the bottom was used according to Fig. 2, and the methodology was the same as that for the syringe test. Here, 3320 g of Mikawa sand or 3355 g of Mizunami and 1500 mL of cementation media were used. After solidification was achieved, the sample was opened and cylindrical samples with the diameter of 3 cm and a height of 6 cm were cored. The following tests were then conducted on the cored samples: the UCS test, the needle penetration test, X-ray deflection (XRD), scanning electron microscopy (SEM) (Super Scan SS-550, Shimadzu Corporation, Kyoto, Japan), energy dispersive X-ray spectroscopy (EDX) (SEDX-500, Shimadzu Corporation), and X-ray computed tomography (X-CT). CaCO3 content was also determined. In addition, the sample color was measured by colorimeter to identify the effect of color on strength of the sample.

In the syringe test, 15 test cases were conducted, as shown in Table 3. The test cases were summarized according to the investigation purpose. In Case 1 to 3, the effect of a bacterial population was investigated. In Cases 4 and 5, the effect of re-injection of bacteria was identified. In Cases 3, 6, and 7, the effect of curing time was investigated. Cases 3, 8, and 9 were also used to investigate the effect of temperature. Moreover, Cases 10 and 11 were used to identify the effect of the injection interval of the cementation media, and to investigate the effect of cementation media concentration, Cases 10, 12, and 13 were used. Cases 3, 14, and 15 were used to investigate the effect of particle size on the solidification. In the model test study, three test cases were carried out by changing curing time and the particle size of the sand material (Table 4). Case 16 was conducted for aseptic control experiment without adding bacteria.
Table 3
Experimental conditions for syringe solidification test.
| Case No. |
Temp. (℃) |
Population of
Bacteria (g) |
Injection
interval (days) |
Re-injection of
Bacteria
(After 7 days) |
Curing Days |
Concentration of
cementation media |
Sand material
with Particle
Size (mm) |
| 1 |
30 |
0.1 with centrifuge |
1 |
|
14 |
0.5 M |
Mikawa-0.6 |
| 2 |
0.3 with centrifuge |
| 3 |
1.0 with centrifuge |
| 4 |
0.1 with centrifuge |
x |
| 5 |
1.0 with centrifuge |
x |
| 6 |
|
7 |
| 7 |
21 |
| 8 |
25 |
14 |
| 9 |
35 |
| 10 |
30 |
| 11 |
2 |
| 12 |
1 |
0.3 M |
| 13 |
0.7 M |
| 14 |
0.5 M |
Misunami-1.2 |
| 15 |
Toyoura-0.2 |
| 16 |
Without bacteria |
Mikawa-0.6 |
Table 4
Experiment conditions for model test.
Test
Case
No. |
Temperature |
Injection
Interval |
Curing
time |
Population of
bacteria (g) |
Adding bacteria |
Height of
sample
(cm) |
Sand material
(Particle Size mm) |
| (℃) |
1 Day |
(After 7 days) |
| 1 |
25 |
x |
14 |
13 |
|
9 cm |
Mikawa (0.6 mm) |
| 2 |
21 |
x |
|
| 3 |
14 |
|
Mizunami (1.2 mm) |
3. Results
3.1 Syringe test on solidification
1) Bacterial population and re-injection of bacteria
Figure 3(a) shows that the estimated UCS of the sample increases with an increase in bacterial population. This finding indicates that bacteria play a key role in MICP, i.e., (1) producing an enzyme to hydrolyze urea, and (2) acting as nucleation sites for the formation of CaCO3 crystals.7) More bacteria in the solution will increase the concentration of enzymes and provide more nucleation sites for the MICP.
Figure 3 (b) shows that the estimated UCS value is larger when the bacteria solution is re-injected after 7 days than when it is not. The reason was that the pH value could be controlled when bacteria were re-injected. The optimal growth for Pararhadobacter sp. is achieved at 30–40℃ and pH 7.0–8.5.8) Moreover, a low concentration of Ca2+ concentration also was maintained, which means the calcite precipitation was increased when bacteria were re-injected.
2) Curing temperature and curing time
Figure 3(c) shows the effect of temperature on estimated UCS. In this investigation, 3 test cases were used: 25℃, 30℃, and 35℃, and the average estimated UCS values were 2.1 MPa, 5.2 MPa and 3.5 MPa, respectively. Thus, it is clear that the estimated UCS value was higher at 30℃ than at 25℃ or 35℃.
Figure 3(d) shows the results of experiments conducted for the following curing periods: 7 days, 14 days, and 21 days. The average estimated UCS of the sample after a curing period of 7 days (2.3 MPa) was less than average estimated UCS values after 14 and 21 days (average estimated UCS 5.2 MPa and 4.7 MPa, respectively).
3) Injection interval and concentration of cementation media
For the two test cases, cementation media was added to the syringe every day or after every 2 days (Case 10 and Case 11, respectively). In this study, the strength of the sample prepared by the daily addition of cementation media (average estimated UCS 5.2 MPa) was larger than that of the sample prepared by adding cementation media at 2-day intervals (2.6 MPa) for 14 days (Fig. 3(e)). This was because the Ca2+ concentration of the cementation media (CaCl2) was larger in Case 10 than in Case 11. However, with the depth of the syringe sample (top to bottom), the strength reduced.
Figure 3(f) shows the results using different concentrations of cementation media for the solidification of syringe samples. The strength of the sample increased with an increase in the concentration of the cementation media solution. Here, 0.3 M, 0.5 M, and 0.7 M concentrations were used. If the concentration of the cementation media is increased, the rate of CaCO3 precipitation increases, as does the estimated UCS.
4) Particle size
From the results (Fig 3(g)), the average estimated UCS value (4 MPa) was larger in the Mizunami sand with 1.2 mm mean diameter than in the Mikawa sand sample, which has a mean diameter 0.6 mm (3.6 MPa), and the Toyoura sand sample with a mean diameter 0.2 mm (1.4 MPa). The particle size of Toyoura sand is smaller than that of the other two sand samples, which may decrease the bacterial and hydrolysis processes. As a result, CaCO3 precipitation will decrease and the UCS value will be lower in the Toyoura sand sample than in the Mikawa or Mizunami sand samples. Therefore, the particle size of the sample mainly affects the solidification of the sample, and the applicable range of sand particle size is 0.6 mm to 1.2 mm (mean diameter) according to our study.
5) Comparison between control sample (without bacteria) and test sample with bacteria
For the control sample (case 16), pH and Ca2+ were measured during the curing time period and the results are shown in Fig. 4(a) and 4(b). The results show that the pH value of the sample is maintained at around 7, but when we added bacteria pH value is getting decreased with time. Moreover, Ca2+ concentration of the outlet of the sample was maintained around 20000 ppm at the sample without bacteria and the Ca2+ concentration of the sample with bacteria is increased with time.
Figure 5 shows that the sample without bacteria opened after 14 days. The sample was not solidified after 14 days, which means without bacteria when the consolidated added it was not sufficient for the solidification. The main factor is adding bacteria.
3.2 Model test on solidification
For test cases 1 and 2 (Table 4), pH decreased with time. However, after 7 days of curing, the pH of test case 2 increased and maintained a value of 7 due to re-injection of bacteria (Fig. 6(a)). It was very important to maintain the pH at 7 because the optimal pH for Pararhodobacter sp. is 7 to 8. If the pH value is maintained between 7 and 8, the bacterial activity remains high and increases the rate of hydrolysis process, and this gives finally the high CaCO3 precipitation. The results of the Ca2+ concentration of the outlet solution showed the evidence for high precipitation of CaCO3. Ca2+ concentration increased with time when no bacterial solution was added after 7 days in test case 1 (Fig. 6 (b)). However, in test case 2, the concentration of Ca2+ in the outlet solution was small during the curing period.

The solidified samples (Fig. 7) were cored vertically and horizontally. The cored samples were cylindrical shaped with the diameter of 3 cm and the height of 6 cm. The strength decreased with the depth in vertically cored samples, as shown in Figs. 8(a) and 8(b). Moreover, the estimated UCS value of the samples varied from 10 MPa to 3 MPa. In addition, the strength of horizontally cored samples was nearly same as that of the vertically cored samples or the differences in strength were small (Fig. 8(c)).

The SEM images (Fig. 9) show that the CaCO3 crystals were mainly irregular, similar to observations made by Qabany.9) However, the crystal size (approximately 10–100 μm), we observed, was larger than the size indicated by Qabany9); this might be attributed to the different sample preparation method we used. Most of crystal particles were dispersed and uniformly distributed in the gaps between sand particles, and sometimes there were overlapping structures on the crystal surface. The results of EDX analysis demonstrated that the dominant minerals were SiO2 and CaCO3, and Ca, O, and C were the main elements in the mineral precipitations. Studies by van Passen and Qabany confirm that the crystals observed were actually CaCO3 crystals precipitated in the silica sand.9,10)

The XRD observation results (Fig. 10) indicate that the calcite precipitation was larger at the top of the sample than bottom of the sample (SiO2–91.5% and CaCO3–8.5% at the top and SiO2–96.5% and CaCO3–3.5% at the bottom). Nevertheless, calcite precipitation was not so large difference in samples, which were cored horizontally.
The X-CT results show clearly that the sand particles bonded with CaCO3 precipitation were large in the top of the sample than middle and bottom (Fig. 11). Therefore, the strength decreased with the depth of the sample. Further examination of getting a homogeneous sample is need in future.
Using a colorimeter, color measurements were obtained at 4 phases of the sample box, as shown in Fig. 12. The measurements were taken 2 cm each from the top and bottom levels of the sample sand layer. Four measurements were taken at each point, and the average value was obtained. With time, mostly at each point, the color (∆L*) increased (Fig. 13).
In addition, for test case 3 (Mizunami sand sample), color was measured by colorimeter at each point where the NPT were conducted. Figure 14 shows the results of estimated UCS and color of the sample. The color of the sample increased with an increase of estimated UCS. Therefore, there was a close relationship between color and estimated UCS value.
4. Discussion
4.1 Suggested formula for prediction of estimated UCS
Multiple regression analysis was conducted in this study to analyze the relative importance of each test condition to the estimated UCS, and to determine experimentally a formula that can predict estimated UCS as a useful reference for future cementation tests and field tests.
In this study, multiple regression analysis was conducted using the results of the syringe solidification. In this analysis, the syringe test conditions were set as explanatory variables and the measured UCS was the objective variable. The following relational expression (eq. (4)) and Table 5 were generated by this analysis.
Table 5
Results of the multiple regression analysis of data from the syringe solidification test.
| |
Coefficients |
Standard
Error |
t Stat |
P-value |
| Intercept |
2.259 |
1.198 |
1.8857 |
0.0887 |
Bacterial Population
(g) Bp |
3.370 |
2.519 |
1.3381 |
0.2105 |
Concentration of
Cementation media
(M) CCa |
9.749 |
3.164 |
3.0807 |
0.0116 |
| Curing time (Days) D |
0.231 |
0.109 |
2.1251 |
0.0595 |
Injection Interval
(Days) Ii |
1.165 |
1.184 |
0.9839 |
0.3484 |
| Particle size (mm) M |
1.175 |
1.888 |
0.6224 |
0.5476 |
| Temperature (℃) T |
0.061 |
0.056 |
1.0873 |
0.3024 |
Equation for estimated UCS value is as follows:
| \[
\begin{split}
q_{eu} & = 3.37B_{p} + 9.75C_{Ca} + 0.23D + 1.16I_{i}\\
&\quad
+ 1.17M + 0.06T + 2.26
\end{split}
\] | (4) |
Where;qeu = Estimated UCS (MPa)
Bp = Bacterial population (g)
CCa = Concentration of cementation media (M)
D = Curing time (Days)
Ii = Injection interval (Days)
M = Particle size (mm)
T = Temperature (℃)
In Table 5, the partial regression coefficient indicated the coefficient of each multiple regression equations, which is set so that the theoretical value is close to the measured value. Additionally, the standard error was determined as follows: only one set of all intended experiments was conducted, but it was assumed that several sets were conducted. The frequency distributions of the partial regression coefficients and the constant term were then obtained by multiple regression analyses against each set of all intended experiments. The standard deviation of the normally distributed histogram obtained by calculating the frequency distributions is the standard error. The t value was obtained by dividing the partial regression coefficient by the standard error. From the t values, the degree of importance of each explanatory variable to the objective variable can be judged. The P-value was twice as much as the upper probability of the t value on the t distribution. In this study, a P ≤ 0.01 and 0.01 < P ≤ 0.05 was considered to indicate that both explanatory variables are important, because the significance levels were 1% and 5%, respectively, while a P > 0.05 indicated that the explanatory variable was not important.
As shown in Table 5, the concentration of cementation media, curing time, injection interval were significant. Based on each t value, the concentration of cementation media had the highest degree of importance followed by curing time, injection interval, bacterial population, curing temperature and particle size.
To suggest a more reliable formula for prediction of the UCS than eq. (4), the more important explanatory variables against the objective variable were selected. Because the P values of the concentration of cementation media, curing time, injection interval were less than 0.05. These conditions were selected as explanatory variables, and the UCS of specimens generated at a curing temperature of 30℃, 1.0 g of bacterial population, and 0.6 mm particle size diameter (Mikawa sand) were used as objective variables. The results of this multiple regression re-analysis are shown in eq. (5) and Table 6.
| \[
q_{eu} = 13.99C_{Ca} + 0.37D - 0.09
\] | (5) |
Table 6
Results of the multiple regression re-analysis of data from the syringe solidification test.
| |
Coefficients |
Standard
Error |
t Stat |
P-value |
| Intercept |
−0.09 |
1.38 |
−0.0617 |
0.9547 |
Concentration of
Cementation media
(M) CCa |
13.99 |
2.81 |
4.9696 |
0.0157 |
| Curing time (Days) D |
0.37 |
0.10 |
3.9071 |
0.0298 |
The P-values of three explanatory variables (Table 6) were lower than 0.05. Therefore, eq. (5) can be considered a reliable formula for prediction of UCS. However, it should be noted that this formula is only reliable for samples generated using the curing temperature, bacterial population, and particle size of the sand material, described above. In addition, the conditions of the explanatory variables can change within the range of syringe tests. Hence, further cementation tests need to be performed to develop a reliable formula for prediction of UCS under more varied conditions. Nevertheless, eq. (5) will be useful for further cementation tests and field tests.
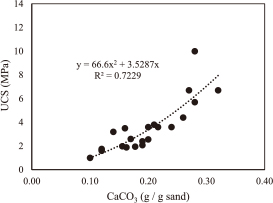
4.2 Comparison of relationship between UCS and CaCO3 content with previous studies
To determine precipitated CaCO3 in the soil specimens, specimens were crushed using a mortar and oven-dried. The dry soil was washed in HCl solution (1.0 M) to dissolve precipitated carbonates, rinsed, drained, and oven-dried. The difference between the two weights is considered the weight of the carbonates that were precipitated in the specimen.6) Figure 15 shows that the strength of the sample increased with an increase in the CaCO3 precipitation.
The results for other bacteria are shown in Fig. 16.3,11–13) Sporosarcinapasteurii has been most widely used in investigations of sand improvement using bacteria, while Bacillus sphaericus was isolated by Al-Thawadi and Cord–Ruwisch.14) Danjo found that the UCS of the specimen prepared using Pararhodobacter sp. was higher than that of the specimen generated using Sporosarcinapasteurii, even though both specimens contained the same amount of total CaCO3 precipitation (Fig. 16).12,13)

According to this study, we found that the UCS of the silica sand specimen prepared using Pararhodobacter sp. (Amarakoon) was less than the UCS of the coral sand specimen prepared using Pararhodobacter sp. (Danjo).12,15) However, because these specimens contained different kinds of sand and were cured under different conditions, it is unclear which bacteria is better for sand cementation. Conversely, the different amounts of total precipitation could explain the different UCS values of the specimens produced using Bacillus sphaericus or the other two bacteria.
4.3 Usefulness and applicability of model test in practical stage
The sand solidification using local ureolytic bacteria (Pararhodobacter sp.) can be mainly used as a construction material for preserving coastal regions and/or healing of coastal concrete structures. Presently breakwater construction is used for prevention of coastal erosion. However, production of cement, which is a major construction material for breakwater construction, is energy consuming and environmentally un-friendly. Therefore, this MICP treated method offers a promising technique that can be used to solve coastal erosion.
In addition, this method can be used for soil improvement in land usage also. However, according to this study, the strength was decreased with the depth. Therefore, there is a limitation for apply in practical stage. Further investigation is needed to identify the efficient injection system for getting the uniform solidified sample before apply for a flat area in practically. However, this study method can be used in a slope area by injecting vertically. From this technique, it can be improved the soil in a slope area.
4.4 Future improvements
This study shows that the optimization of the MICP process is possible in controlled lab-scale experiments. The applicability of the MICP on the field-scale still requires further investigation, as common natural conditions like high pore-water pressure, non-uniform flow field, and soil heterogeneity have not been sufficiently investigated yet.
In this study, the strength decreased with the depth of the sample. Therefore, further studies that achieve a uniformly solidified sample using Pararhodobacter sp. are needed. Furthermore, the cementation media and bacterial solution were added using the injection method, the sample was saturated throughout the testing period, and the cementation media was kept around 2 cm above from the top of sample. Ca2+ and bacteria were present in the sample, as well as the solution that was kept for saturation. Due to the presence of Ca2+ and bacteria, calcite precipitation might have occurred at the top of the sample. Therefore, the top layer might have hardened. Furthermore, the cementation media might have penetrated into the soil pores that were under pressure to some extent. Moreover, the effluent also reduces the number of bacteria and a portion of urease produced by bacteria, and the samples may not be uniform along the flow. However, to clarify this matter, further investigations with a reduced cementation media level at the top of the sample should be conducted in future.
MICP is a sustainable and environmentally friendly technique that must be improved both at laboratory and field scales. This technique must be optimized to find the best conditions (pH, soil, temperature, concentration of cementation media etc.) for bacterial activity, and to achieve a homogeneous distribution in the soil. It is believed that the conditions for bacterial activity were achieved, and, therefore, future research must focus on finding efficient injection systems both bacteria and cementation media. Only after solving these problems will be possible to compare the UCS from this treatment with that of soil–cement mixtures; however, it is expected that UCS of cement may be larger.
5. Conclusions
To cement sand specimens to a UCS of several MPa using local ureolytic bacteria from silica sand, and to consider the influences of various test conditions on the UCS, we conducted silica sand cementation tests. The main findings of our study are as follows:
-
(1)
The model test specimens were cemented up to 10 MPa estimated UCS after 14 days under a curing temperature of 25℃, an injection interval of the cementation solution of 1 day, and in the presence of a cementation solution containing 0.5 M Ca2+.
-
(2)
Multiple regression analysis revealed that the relevant test conditions influencing the estimated UCS of the specimen were test period (D (days)) and Ca2+ concentration of the cementation solution (Cca (M)). The formula for predicting the estimated UCS (qeu (MPa)) was qeu = 13.99 Cca + 0.37 D − 0.09.
The results of this study will contribute to the development of new techniques for bio-stimulation and silica sand improvement. In future, environmental impact assessments, tank cementation tests, and field tests are needed to enable widespread application of this soil improvement technique using bacteria.
Acknowledgements
This work was partly supported by the Kajima Foundation's Research Grant and JSPS KAKENHI Grant Number JP16H04404.
REFERENCES
- 1) J.T. DeJong, M.B. Fritzges and K. Nusslein: J. Geotech. Geoenviron. Eng. 132 (2006) 1381–1392. 10.1061/(ASCE)1090-0241(2006)132:11(1381)
- 2) V.S. Whiffin, L.A. van Paassen and M.P. Harkes: Journal of Geomicrobiology 24 (2007) 417–423. 10.1080/01490450701436505
- 3) L.A. van Paassen, C.M. Daza, M. Staal, D.Y. Sorokin, W. van der Zonb and M.C. van Loosdrecht: Ecol. Eng. 36 (2010) 168–175. 10.1016/j.ecoleng.2009.03.026
- 4) B.M. Mortensen, M.J. Haber, J.T. DeJong, L.F. Caslake and D.C. Nelson: J. Appl. Microbiol. 111 (2011) 338–349. 10.1111/j.1365-2672.2011.05065.x
- 5) J.K. Mitchell and C.J. Santamarina: J. Geotech. Geoenviron. Eng. 131 (2005) 1222–1233. 10.1061/(ASCE)1090-0241(2005)131:10(1222)
- 6) V. Rebata-Landa: Ph.D. Thesis, Georgia Institute of Technology, Atlanta, GA (2007).
- 7) Y. Fujita, E.G. Ferris, R.D. Lawson, F.S. Colwell and R.W. Smith: Journal of Geomicrobiol. 17 (2000) 305–318. 10.1080/782198884
- 8) B.U. Foesel, H.L. Darke and A. Schramm: Journal of Systematic and applied microbiology 34 (2011) 498–502. 10.1016/j.syapm.2011.08.006
- 9) A.Al. Qabany, K. Soga and C. Santamarina: J. Geotech. Geoenviron. Eng. 138 (2012) 992–1001. 10.1061/(ASCE)GT.1943-5606.0000666
- 10) L.A. van Paassen, M.P. Harkes, G.A. van Zwieten, W.H. van der Zon, W.R.L. van der Star and M.C.M.van Loosdrecht: 17th International Conference on Soil Mechanics and Geotechnical Engineering, (2009) pp. 2328–2333.
- 11) L. Cheng, R. Cord-Ruwisch and M.A. Shahin: Can. Geotech. J. 50 (2013) 81–90. 10.1139/cgj-2012-0023
- 12) T. Danjo: Doctoral Thesis, Hokkaido University, Japan (2015).
- 13) T. Danjo and S. Kawasaki: Mater. Trans. 57 (2016) 428–437. 10.2320/matertrans.M-M2015842
- 14) S. Al-Thawadi and R. Cord-Ruwisch: J. Adv. Sci. Eng. Res. 2 (2012) 13–26.
- 15) G.G.N.N. Amarakoon: Doctoral Thesis, Hokkaido University, Japan (2016).