Abstract
Kyushu Research Institute for Cultural Properties Inc. and Kumamoto University have introduced a new method, the Aquo-Siloxane method, to protect stone heritage sites. The application procedure of the method is very simple and it has been applied to several stone heritage sites. Here, one-dimensional diffusion tests using potassium iodide solution were conducted on two types of porous rock samples, Berea sandstone and Kimachi sandstone. The Aquo-Siloxane treatment was applied to the rock samples, and its inhibitory effect on diffusion phenomena was verified. The characteristic point of this study was that the diffusion phenomena was visualized using a µ-focus X-ray computed tomography (CT) scanner, and the density distribution inside the rock sample was quantitatively evaluated. When the Aquo-Siloxane treatment was applied, it was found that density increment resulting from diffusion was suppressed by nearly 1/2 to 1/3 of that without treatment in both the rock samples. The number of applications of Aquo-Siloxane treatment was also verified. It was found that there were no significant differences in the number of treatments, and it was proved that one application was sufficient to suppress the migration of solute into the rock sample.
1. Introduction
Stones and rocks are important construction materials, and various types of buildings, statues, towers, and graves are composed of rocks. Many are recognized as historically and culturally important heritage sites, and they should be passed on to generations in good condition.1–4) Generally, heritage sites are constructed using various types of materials; the targets of this study are heritage sites made of stones and rocks. In many cases, these heritage sites are outdoors, and they have been exposed to sunlight, wind and/or rain every day since their construction. In cold districts, freezing and thawing has strong impacts on rock structures.5,6) However, in warm and humid climates, biodeterioration is also another factor that can result in serious damage to heritage sites.7) However, in most cases, the existence of water and solute dissolved in it is thought to be the main reason for weathering, as it strongly influences subcritical cracking8,9) which leads to macroscopic fracturing of stone heritage sites irrespective of the source of the stress. Therefore, an appropriate assessment of weathering resulting from the water and solute flow is important to preserve stone heritage sites in good condition.10–12)
The Kyushu Research Institute for Cultural Properties Inc. and Kumamoto University have introduced a new method, the Aquo-Siloxane method, to protect stone heritage sites.13–16) Aquo-Siloxane is a smooth and transparent liquid, and the procedure of the method is very simple. The basic procedure is to paint it on the surface and to spray water on the target materials. Sato et al.13) conducted macro-scopical verification of the Aquo-Siloxane method using X-ray computed tomography (CT). First, the water-retention characteristics were analyzed using X-ray CT image data. In the case of porous sandstones, it was found that the Aquo-Siloxane prevents additional water migration and that the permeability decreases via application of the method. A water-repellent effect on the rock surface was also confirmed. As for the inhibitory effect of Aquo-Siloxane on diffusion, Sato et al.14–16) conducted one-dimensional diffusion tests and observed the diffusion phenomena using an industrial X-ray CT scanner and a µ-focus X-ray CT scanner. From the observations made using the industrial X-ray CT scanner,14) it was found that the Aquo-Siloxane method is obviously effective in preventing diffusion phenomena of solutes, and that the coefficient of diffusion is decreased by from 1/10 to 1/2 of that without the Aquo-Siloxane treatment. However, from the observations made using a µ-focus X-ray CT scanner,16) it was also found that the Aquo-Siloxane method is obviously effective in preventing diffusion phenomena, and the effect is assessed by the difference in the gray scale values comprising the CT images. These studies showed the macro-scopical phenomena of water and solute movement in porous rocks; however, a quantitative analysis of the density increment has not yet been discussed.
In this study, a procedure to evaluate density increment resulting from diffusion phenomena is first introduced. Here, one-dimensional diffusion tests using potassium iodide (KI) solution were conducted on rock samples with and without Aquo-Siloxane treatment, and the phenomena was visualized using a µ-focus X-ray CT scanner. When KI solution is used as a tracer and diffusion phenomena is visualized using a µ-focus X-ray CT scanner, so-called gray scale values show different tendencies from other materials, because the KI solution contains a high atomic number ion, i.e., I−. Here, appropriate interpretation from gray scale values to the density of KI solution is introduced, and the inhibitory effect of the Aquo-Siloxane method on diffusion phenomena is verified. Particularly, the state of the solute at the pore and grain scales is visualized, and the distribution of the solution density is evaluated from CT image data. The procedure of applying the Aquo-Siloxane method was experimentally derived, and it remains unknown whether the treatment procedure is appropriate or not. The appropriate application of the Aquo-Siloxane method is also discussed in this study.
2. Aquo-Siloxane Method
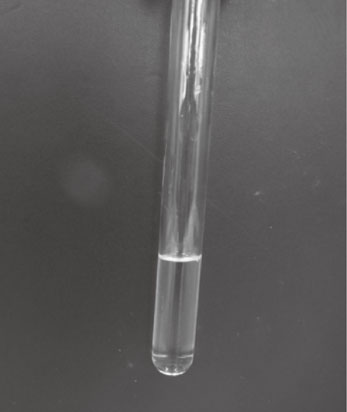
The Kyushu Research Institute for Cultural Properties Inc. has introduced the Aquo-Siloxane method as a new method to preserve historical heritage sites. Aquo-Siloxane is a transparent and colorless liquid as shown in Fig. 1. It was originally developed to protect different types of materials, such as wood, steel, bronze, and rock. In this study, the effect on stone and rock samples were discussed. As preservation methods of historical heritage sites, several methods have been introduced. Generally, it takes a long time and many steps are needed to apply conventional preservation methods. Even after the methods are applied, the atmosphere, such as temperature and moisture, should be controlled to maintain the heritage sites in good condition. In contrast, the process of the Aquo-Siloxane treatment is very simple. First, Aquo-Siloxane is painted on the surface five times. If the material is a permeable material, such as a porous rock, sufficient Aquo-Siloxane is painted to allow permeation into the object. After the object is left for 1 day, some water is sprinkled on the painted surface, and then this process is repeated 5 times every 30 min. Following the treatment, temperature and moisture control are not necessary. As for the details of the Aquo-Siloxane method and other characteristics, please refer to Sato et al.15)
3. µ-Focus X-ray CT Scanner
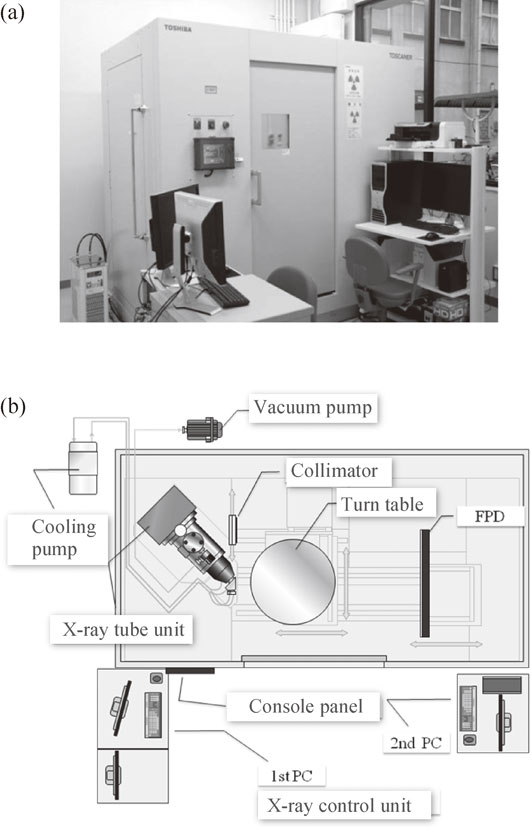
The rock mechanics group of Kumamoto University has been operating two types of X-ray CT scanners. One is the so-called industrial X-ray CT scanner13,14) and another is the µ-focus X-ray CT scanner.15,16) To visualize micro-scale pore and grain structures, the µ-focus X-ray CT scanner was utilized in this study. The outlook of the system and its fundamental components are shown in Fig. 2. The system is equipped with an X-ray tube with a maximum 240-keV tube voltage and 600-mA currency. X-rays are detected at the flat panel detector (FPD) which consists of 2000 × 2000 X-ray-detecting elements. As for the number of voxels which comprise a slice image, a maximum 2048 × 2048 voxels are available. The magnification rate is set by arranging the distance between the target and the FPD, termed the Focus to scanning Center Distance (FCD). In the case of the scanner at Kumamoto University, the minimum focus distance, which corresponds to the size of voxels, is 4 µm.
As is well known, an X-ray CT scanner is the system to visualize density distribution inside of materials. In the case of our CT scanner, density distribution is expressed by so-called gray scale value. The gray scale value is fundamentally proportional to the density; however, the absolute value of the gray scale value is strongly influenced by many factors. For example, the size of the sample strongly influences the quality of the CT images. As the size differs, the amount of attenuated X-ray when the X-ray penetrates through the object also differs. As a result, gray scale values in an image differ even if the objects are composed of the same materials. The shape of an object also influences the gray scale value. Not only are problems related to objects, but parameters related to the setting of the CT scanner, such as tube voltage, tube current, FCD, FPD, and others, influence the quality of CT images. To obtain the same quality of CT images, tomography is conducted under uniform conditions. That is, the size of the experimental tools and parameters of the CT scanner should be fixed every time. The representative parameters used in this study are shown in Table 1.
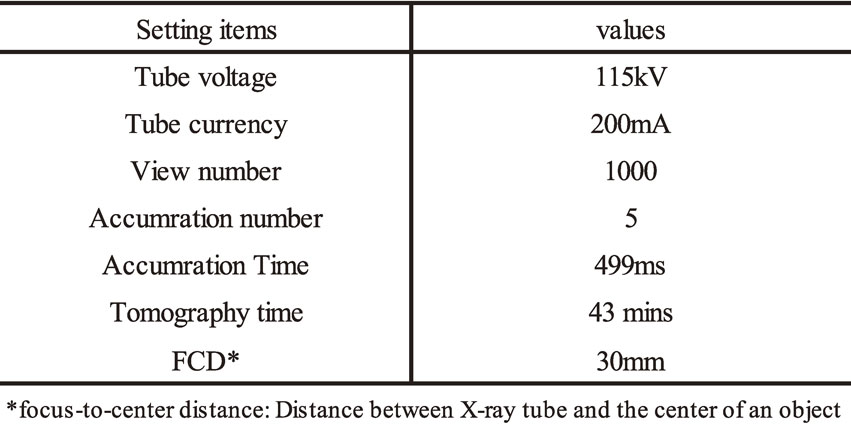
Table 1 Tomography conditions.
4. Rock Sample and Apparatus for One-dimensional Diffusion Tests
Sato et al.16,17) developed a pressure vessel for the visualization of permeation and diffusion phenomena using an µ-focus X-Ray CT scanner, and the apparatus has been also applied to the visualization of CO2 flow17) and diffusion of solution. In this study, nearly similar procedures and apparatuses were applied. Details are as follows.
4.1 Rock sample
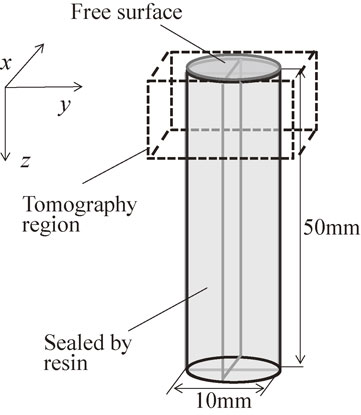
In this study, Berea sandstone and Kimachi sandstone, produced in the U.S. and Japan, respectively, were used as representatives of porous rock samples. The geometry of the sample is shown in Fig. 3. The rock samples were basically drilled perpendicular to the bedding planes, and the length and diameter were 50 mm and 10 mm, respectively. Only the top surface is free, and the other side and another end of the samples were completely sealed by resin. Therefore, no water and solute could penetrate the rock samples except for at the free surface.
Here, several rock samples were prepared with and without the Aquo-Siloxane treatment, and one-dimensional diffusion tests were conducted. As shown in Fig. 3, the side of the rock sample was sealed by resin, and Aquo-Siloxane was applied on the free surface. The Kyushu Research Institute for Cultural Properties Inc. recommended the aforementioned procedure of Aquo-Siloxane treatment. However, the procedure was experimentally derived, and it was not clear if a one-time treatment was sufficient or not. In this study, the procedure of Aquo-Siloxane treatment was also conducted twice and thrice on some rock samples, and the relation between the inhibitory effect on diffusion and treatment times was assessed.
4.2 Procedure of the diffusion tests
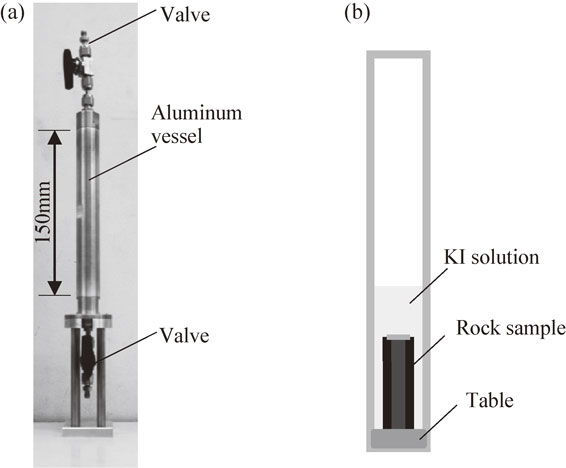
The same experimental apparatus developed by Sato et al.16) was applied in this study. The figure and the schematics inside of the vessel are shown in Fig. 4. The length of the vessel and the inner diameter were 150 mm and 20 mm respectively. As shown in Fig. 4, a rock sample, as previously stated, was installed at the bottom of the diffusion vessel. To reduce the attenuation of the X-ray, the main part of the vessel is composed of corrosion-resistant aluminum. During the diffusion process, the vessel was filled with 30 weight percent KI solution as shown Fig. 4(b), and the diffusion process from a free surface was visualized using the µ-focus X-Ray CT scanner. Typically, the diffusion tests continued for more than 20 h.
5. Problems Related to Utilization of the KI Solution and Translation of the Gray Scale Values to Density
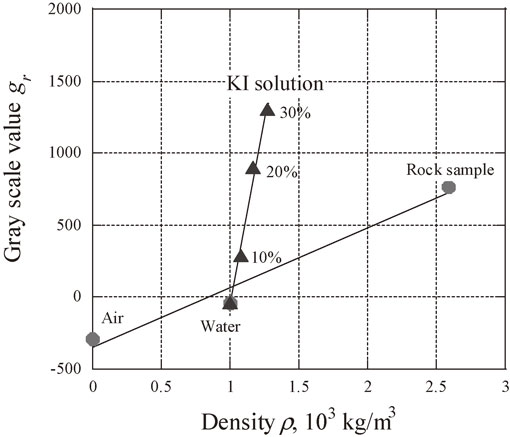
As is well known, X-rays are gradually attenuated when they pass through an object, and the number of attenuated X-rays is basically proportional to the density. An X-ray CT scanner utilizes these characteristics, and the two-dimensional/three-dimensional density distribution in an object is visualized by computed tomography technology. In this study, a high-density KI solution was used as a tracer to visualize diffusion phenomena. In the case of the KI solution, the gray scale value was also proportional to the density; however, the absolute value of the gray scale is higher than its density. This is because that KI solution contains the high atomic number ion I−. Therefore, it is difficult to discuss the density distribution using the absolute value of gray scale when KI solution is used as tracer. To avoid this problem and to clarify the relation between the density and gray scale value of the KI solution, tomography of the KI solution was conducted and the relation between the density and mean value of gray scale was evaluated under the same tomographic condition as the aforementioned diffusion tests stated. Here, tomography was conducted at 0% (= water), 10%, 20%, and 30% in weight percent. For the comparison, tomography on the air and rock sample was also conducted under the same conditions. The result is shown in Fig. 5. As shown, the relation between gray scale value and density shows a different tendency from the relation between the air, water, and rock sample. The gray scale is proportional to the density, and it is obvious that the KI solution has a higher gray scale value. Here, the gray scale value and density were denoted by gr and ρ, respectively. As shown in Fig. 5, the gradient between the gray scale value and the density of the KI solution and air-water-rock were obtained as follows:
| \begin{equation}
\frac{dg_{r}}{d\rho}\bigg|_{\text{KI}} = 5.12\ [\text{m$^{3}$/kg}]
\end{equation}
| (1) |
| \begin{equation}
\frac{dg_{r}}{d\rho}\bigg|_{\text{air-water-rock}} = 0.42\ [\text{m$^{3}$/kg}]
\end{equation}
| (2) |
As previously stated, the gray scale value differs by the size of the objects and tomographic parameters. Therefore,
eqs. (1) and
(2) can be applied when the tomography is conducted under the same conditions.
In this study, the diffusion tests were conducted using a 30% concentration of KI solution. Because the density of the solution which has a 30% KI concentration is 1.271 × 10³ kg/m3, the density of the solution in the pores changes in a range from 1.0 × 10³ to 1.271 × 10³ kg/m3.
6. Evaluation of the Density Increment from the X-ray CT Images during the Diffusion Tests
Some examples of CT images during the diffusion tests are shown in Figs. 6 to 9. All images are shown in a range with a diameter of 10 mm. Figures 6 and 7 are the CT images of the Berea sandstone without and with the Aquo-Siloxane treatment, respectively. Figures 8 and 9 are the images of the Kimachi sandstone without and with the Aquo-Siloxane treatment, respectively. When the high-density KI solution diffuses into the rock sample, the nominal density is increased. Generally, a higher density region is brighter in CT images. As these figures show, the figures following the diffusion tests are brighter than initial image. By comparing Figs. 6 and 7, the sample treated by Aquo-Siloxane is darker than that without treatment. This means that the solute migration was suppressed, and as a result the nominal density change decreased. The same tendency was shown comparing Figs. 8 and 9. In the case of the Berea sandstone, diffusion mainly occurs in the pores, and no significant density change can be observed in the rock mineral part. However, in the case of the Kimachi sandstone, all regions brightened because of the diffusion. That is, not only in the pores but also in the mineral parts, the solute diffused in the whole cross section. Sato et al.16) has already shown this phenomenon in other cases, and these figures show the same tendency.
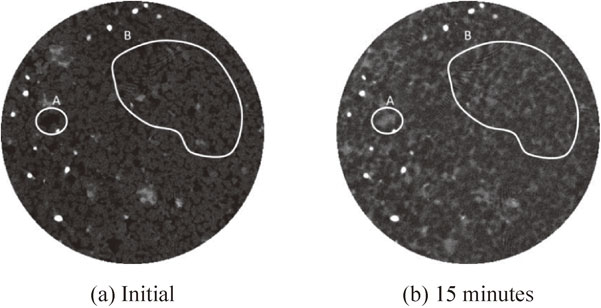
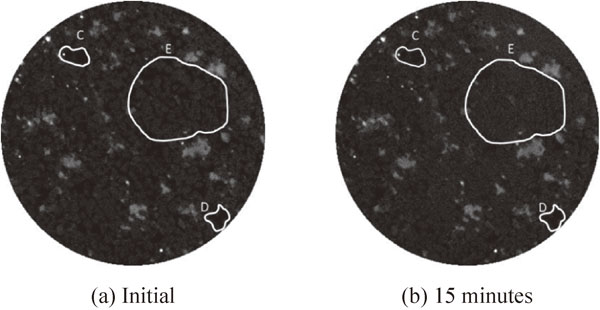
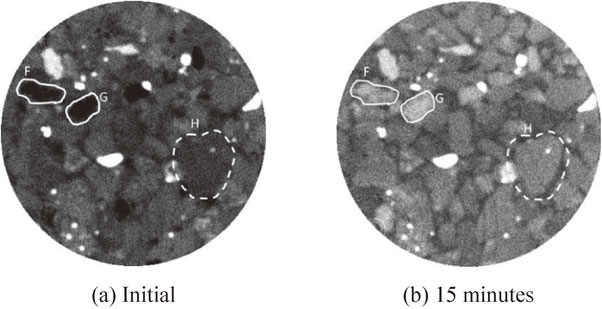
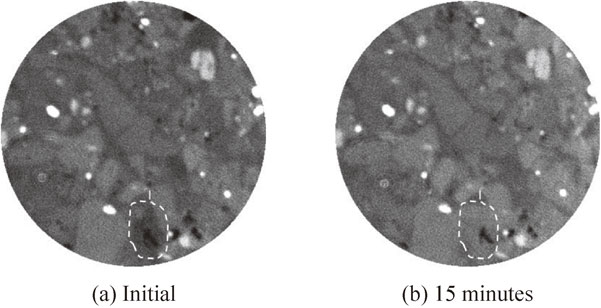
As shown in Figs. 6–9, the regions where the diffusion is remarkable were extracted. These were the regions inside of the white lines and each region was noted as region A-I. From these regions, information on density increment was obtained. However, this type of CT image contains considerable extra information in addition to that of diffusion. For example, the artifact is a representative noise component, and other random noise components are included in CT images. Moreover, the purpose of the study was to extract only the density change resulting from diffusion. To eliminate the noise components and extract necessary information from the CT images, an image subtraction method is useful and effective. Sato et al.13–16) also utilized the information after image subtraction and it was shown that extraction of the increment of gray scale value was possible. In this study, image subtraction was also applied between the initial image and images after initiation of diffusion tests, and the increment of the gray scale values was extracted. As previously stated, the increment of gray scale value is proportional to the density, and the gradient of the KI solution was obtained using eq. (1). Therefore, the density change can be evaluated from the increment of the gray scale value.
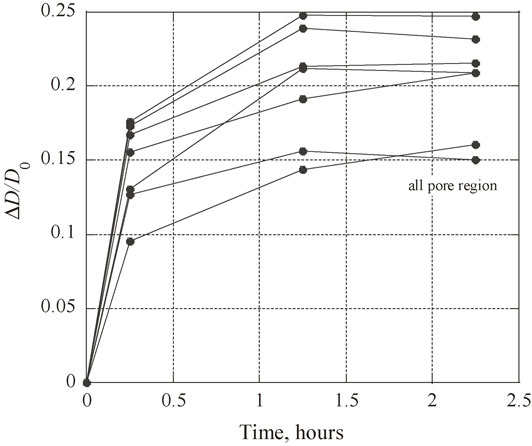
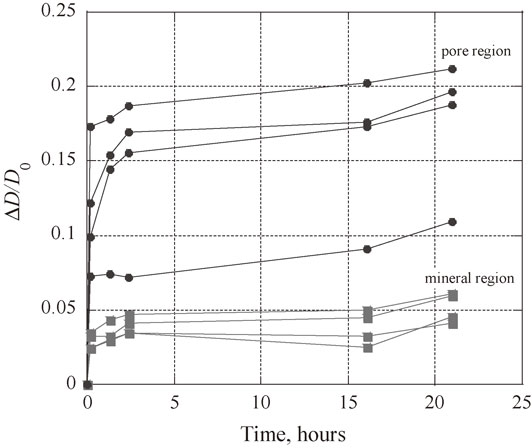
The temporal density changes in the rock samples are shown in Figs. 10 and 11. Figure 10 shows the result of the Berea sandstone and the density changes in the pore regions at the cross section of z = 0.8 mm (distance from free surface) were extracted. Figure 11 shows the result of the Kimachi sandstone, and the density changes in both the pores and rock mineral regions at z = 0.4 mm were extracted. Both show the results after the Aquo-Siloxane treatment was applied. Here, the density change ΔD is normalized by the initial density of the KI solution D0. As shown in Fig. 10, the density gradually increased with time because of the diffusion. In the case of the Berea sandstone, the normalized density increment ΔD/D0 reached values of approximately 0.15 to 0.25 after 1 h following commencement of the diffusion test, and then they maintained nearly the same values. In the case of the Kimachi sandstone (Fig. 11), the normalized density increment ΔD/D0 had nearly the same values as the Berea sandstone in the pore region. As previously stated, the density increment was confirmed in the rock mineral parts in the case of the Kimachi sandstone, and it was found that the value of the density increment was 1/3 to 1/4 of that in the pore region.
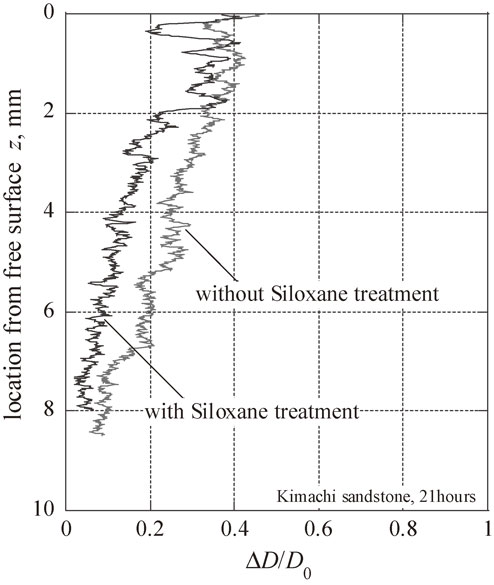
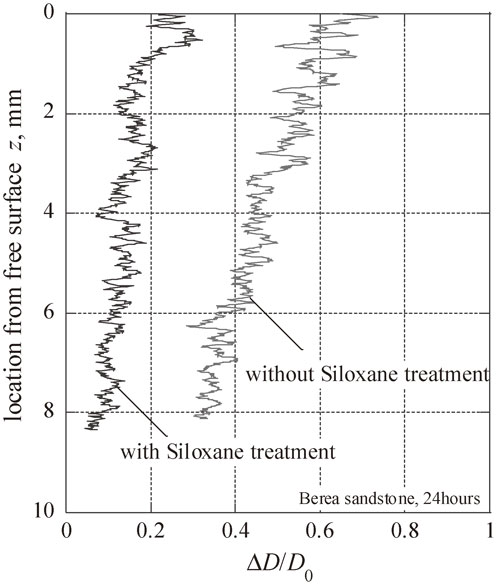
The vertical distribution of the normalized mean density increment ΔD/D0 of the Berea and Kimachi sandstones is shown in Figs. 12 and 13, respectively. In the case of the Berea sandstone (Fig. 12), the result after 24 h is plotted. In the case of the Kimachi sandstone, the result after 21 h is plotted. In each figure, the distributions of the samples with and without Aquo-Siloxane treatment are plotted together. It is obvious that the density increment is larger at the near region of the free surfaces, and that the values decrease as the distance from the free surfaces increases in both cases. It is also obvious that the value of the density increment with the Aquo-Siloxane treatment is smaller than that without the treatment. As for the Berea sandstone (Fig. 12), the density increment of the sample with the treatment was suppressed nearly 1/3 compared to that without the treatment. As for the Kimachi sandstone (Fig. 13), the density increment with the treatment was also suppressed, and the values with the treatment were generally 1/2 of those without the treatment. It was confirmed that the Aquo-Siloxane treatment is effective in suppressing diffusion of solute in rock samples; however, the effect depends on the rock type. The mean porosity of the Berea sandstone and Kimachi sandstone used in this study were 24% and 20%, respectively. However, the pore size of these sandstones was different. Minagawa et al.18) measured the pore scale distribution of the Berea sandstone using mercury porosimetry and showed that the dominant pore size of the Berea sandstone is approximately 5 µm to 10 µm. Takahashi et al.19) also measured the pore scale distribution using the same method and it was shown that the dominant pore size of the Kimachi sandstone is approximately 10−1 µm to 10−2 µm. As for the porosity, there are no significant differences between the two; however, the pore scale is totally different. Moreover, Sato and Ikeda12) measured the intrinsic permeability k of the Berea and Kimachi sandstones. It was found that the values of the sandstones were 10−13 m2 and 10−17 m2, respectively, and the values of the intrinsic permeability were also totally different. That is, in a case where the pore scale is smaller and the permeability is smaller, the Aquo-Siloxane hardly penetrates the rock sample, and the region where the Aquo-Siloxane reaches is limited to near the free surface. As a result, it is thought that the inhibitory effect on diffusion decreases in the case of the Kimachi sandstone.
7. Influence of Treatment Times Using the Aquo-Siloxane Method
As previously stated, the Kyushu Research Institute for Cultural Properties Inc. proposed the following procedure for the Aquo-Siloxane treatment. Aquo-Siloxane is painted on the surface of the object five times. After the objects are left for 1 day, some water is sprinkled on the painted surface, and then this process is repeated 5 times every 30 min. A series of this procedure corresponds to a one-time application of the Aquo-Siloxane method. The previously shown results are those with a one-time application of the Aquo-Siloxane method. However, this procedure was experimentally determined, and it remains unproven whether the procedure is appropriate or not.
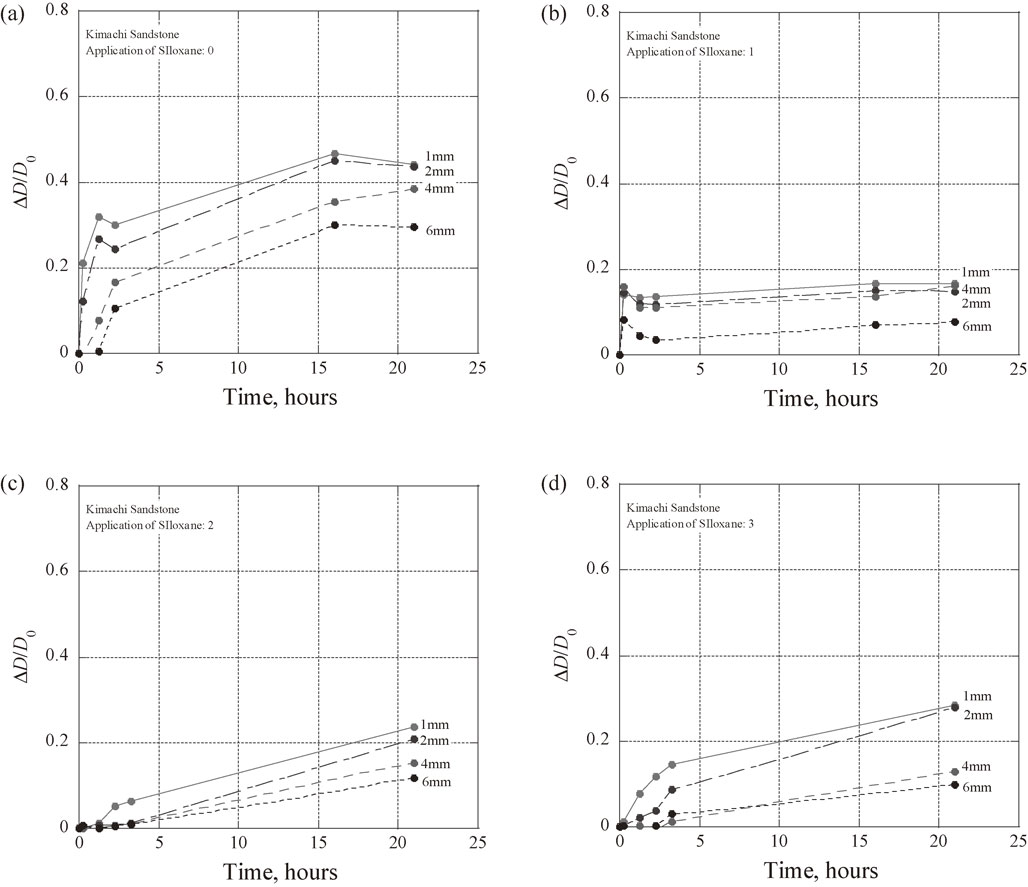
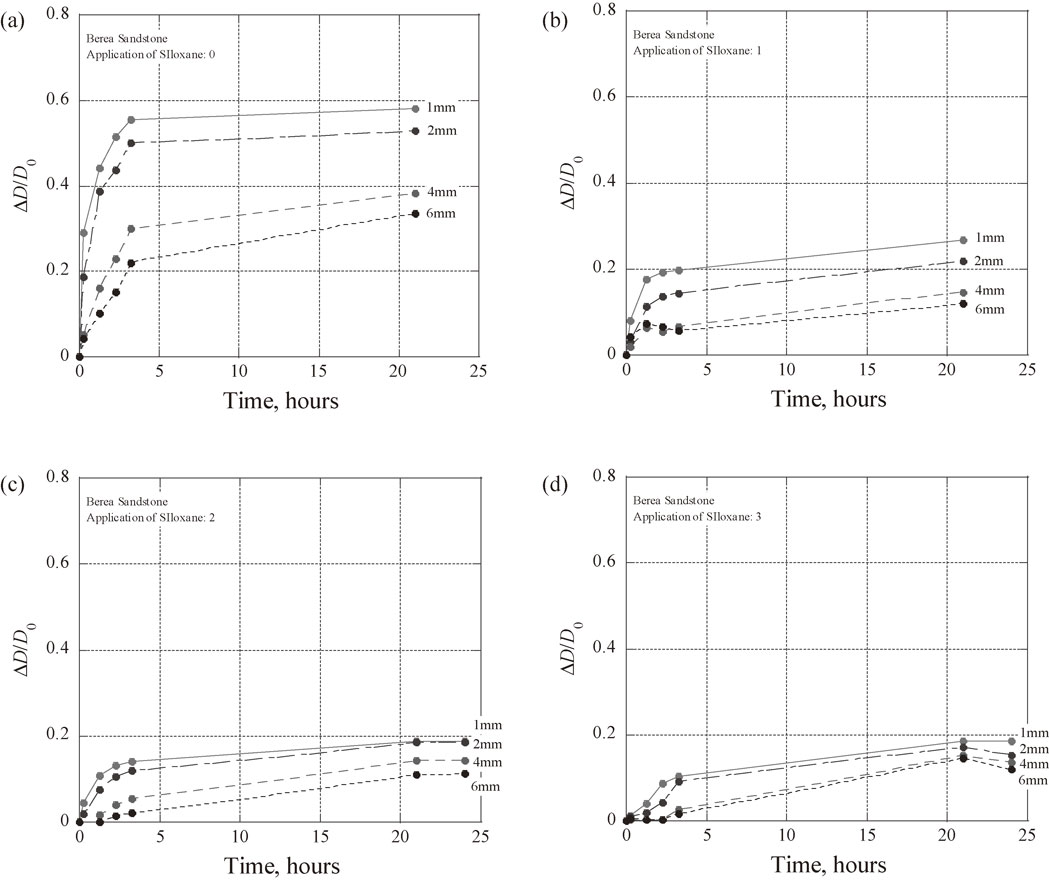
Here, the relation between the treatment times of the Aquo-Siloxane method and its effect was assessed. The treatment was applied twice and thrice to the rock samples, and the inhibitory effect on diffusion of the KI solute was verified. The temporal change in the increment of the mean density ΔD/D0 for the Berea sandstone is shown in Fig. 14. Here, Fig. 14(a) shows the result without treatment, and (b), (c), and (d) are the results with a one-time, two-time, and three-time application of the treatment, respectively. The increment of the mean density was evaluated at z = 1 mm, 2 mm, 4 mm, and 6 mm. The value of ΔD/D0 was larger where the position is nearer the free surface. All cases showed the same tendency. When the Aquo-Siloxane was applied, the value of the density increment was suppressed by approximately 1/2 of that without treatment; however, there were no significant differences among the treatment times. The same analysis was also conducted for the Kimachi sandstone. The results are shown in Fig. 15. In this case, the value of the density increment was also suppressed by approximately 1/2 one of that without treatment, and there were no significant differences among the treatment times. Therefore, it was proved that a one-time application of the Aquo-Siloxane method is sufficient to realize an inhibitory effect towards diffusion.
8. Conclusions
The Aquo-Siloxane method is expected to be a new preservation method for stone heritage sites. There are several reasons for weathering, and diffusion phenomena is among the fundamental problems in protecting stone heritage sites in good condition. In this study, one-dimensional diffusion tests were conducted on rock samples with and without the Aquo-Siloxane treatment, and the diffusion process was visualized using a µ-focus X-ray CT system. Subsequently, the density distribution resulting from diffusion was quantitatively evaluated. The conclusions obtained in this study are as follows:
-
(1)
The µ-focus X-ray CT system is a very efficient tool to inspect the inside of materials. However, the quality of the CT images is strongly influenced by the tomographic conditions and the size of the experimental apparatus. To avoid this problem, the experimental conditions were fixed, and the relation between the gray scale values and density was evaluated. When KI solution is used as a tracer in diffusion tests, the relation between the gray scale values and density shows a different tendency. Here, a series of the procedure to evaluate the density of KI solution diffused into the rock samples from X-ray CT images was introduced.
-
(2)
In the case of the Berea sandstone, diffusion occurs in pores. However, diffusion occurs both in the pores and rock mineral parts of the Kimachi sandstone. However, it was found that the density change in the mineral part was approximately 1/3 to 1/4 of that in the pore region.
-
(3)
When the Aquo-Siloxane treatment is applied to rock samples, the density change because of diffusion was obviously suppressed from 1/2 to 1/3 compared to rock samples without the treatment. However, the effect depended on the rock type. Comparing the Berea and Kimachi sandstones, the mean porosity was nearly the same. However, the pore scale and intrinsic permeability of the Kimachi sandstone were much smaller than those of the Berea sandstone. As a result, the Aquo-Siloxane barely permeated into the rock sample, and the inhibitory effect on the Kimachi sandstone was less than that of the Berea sandstone.
-
(4)
The influence of the number of Aquo-Siloxane treatments was verified. Diffusion tests were also conducted on the rock samples in which the treatment was applied zero to three times. It was found that there was no significant difference by application time of the treatment, and that a one-time application of the treatment was sufficient to suppress the diffusion phenomena.
REFERENCES
- 1) A. Al-Omari, K. Beck, X. Brunetaud and M. Al-Mukhtar: Environ. Earth Sci. 74 (2015) 609–620.
- 2) C. Maraveas and K. Tasiouli: Case Stud. Struct. Eng. 3 (2015) 1–10.
- 3) A. Torok, B. Szabo and J. Laszlovszky: Engineering Geology for Society and Territory - Volume 8: Preservation of Cultural Heritage, (2015) pp. 471–475.
- 4) K. Nishiyama, K. Miyamoto and S. Hasegawa: Natural Science Research, The University of Tokushima 28 (2014) 45–53.
- 5) P.M. Carmona-Quiroga, M.T. Blanco-Varela and S. Martinez-Ramirez: Engineering Geology for Society and Territory - Volume 8: Preservation of Cultural Heritage, (Springer, Berlin, 2015) pp. 531–534.
- 6) M.H. Ghobadi and M. Torabi-Kaveh: Environ. Earth Sci. 72 (2014) 5035–5047.
- 7) N. Schiavon, T. De Caro, A. Kiros, A.T. Caldeira, I.E. Parisi, C. Riccucci and G.E. Gigante: Appl. Phys. A 113 (2013) 843–854.
- 8) M.C. Eppes and R. Keanini: Rev. Geophys. 55 (2017) 470–508.
- 9) Y. Nara, R. Nakabayashi, M. Maruyama, N. Hiroyoshi, T. Yoneda and K. Kaneko: Eng. Geol. 179 (2014) 41–49.
- 10) E. Roussel and M.F. Andre: Geogr. Fis. Din. Quat. 36 (2013) 169–179.
- 11) K.I. Meiklejohn: S. Afr. Geogr. J. 79 (1997) 199–206.
- 12) K. Heinrichs: Environ. Geol. 56 (2008) 643–675.
- 13) A. Sato, S. Kanayama, M. Obata and A. Toyomi: J. MMIJ 129 (2013) 529–537.
- 14) A. Sato and K. Ikeda: Can. Geotech. J. 52 (2015).
- 15) A. Sato, M. Egashira and M. Obata: Mater. Sci. Appl. 8 (2017) 419–435.
- 16) A. Sato, K. Ikeda, T. Yatsunami, K. Tsuda, T. Fukumitsu and K. Habu: Rock Mechanics & Rock Engineering: From the Past to the Future 2, (2016) pp. 847–852.
- 17) A. Sato and K. Ikeda: Rrock Mechanics for Global Issues – Natural Disasters, Environment and Energy – ARMS8, (2014) Paper No. CCS-6.
- 18) H. Minagawa, Y. Nishikawa, I. Ikeda, K. Miyazaki, N. Takahara, Y. Sakamoto, T. Komai and H. Narita: J. Geophys. Res. 113 (2008).
- 19) M. Takahashi, Y. Fujii, A. Changwan, T. Takemura, N. Takahashi and P. Hyuck: J. Japan Soc. Eng. Geol. 52 (2011) 184–191.