Abstract
Surface-enhanced Raman spectroscopy (SERS) using plasmonic effect relies on the amplification of the Raman signals of targeted molecules due to a strong near-field enhancement of plasmonic nanostructures. The SERS intensity, therefore, depends strongly on the geometry of plasmonic structures wherein nanogaps between plasmonic objects play a significant role in the near-field enhancement. Here, using the random gold nanoisland assemble as a plasmonic medium and the Rh6G as the targeted molecule, we show that not only the size of the nanogaps but also their density influence strongly on the SERS intensity. The SERS intensity is found to be significantly improved if the gap size decreases and gap density increases. Our work provides additional information that might be useful for optimizing the SERS signal strength of the random plasmonic media.
1. Introduction
The ability to confine and enhance electromagnetic radiation from free space into a tiny area thanks to the localized surface plasmon has made plasmonic nanoantennas as useful components for slowing, localizing and manipulating photons at nanoscale in novel electronics devices and ultra-sensitive sensors1–8). Although plasmonics shows various perspective applications, its future in molecular sensing seems to be the most succeed one9–13). Surface-enhanced Raman spectroscopy (SERS)9,10) and surface-enhanced infrared absorption (SEIRA)11–13) utilize a huge enhancement of electromagnetic field at the nanogaps of the plasmonic antennas to improve the vibration signals known as fingerprints of absorbed molecules, making them applicable to sensitive and selective examination of a trace amount of molecules. Among plasmonic substrates suitable for SERS and SEIRA, gold island films prepared by the wet-chemical method have a number of advantages over the vacuum methods if taking into account the chemical inert of the gold surface and cost-effective synthesis procedure14–16). In addition, the random nature of morphology with nanogap architecture offers a controllable, broadband optical response starting from visible tailing to mid-infrared region, making the gold random nano-islands films ideally suitable for the sensing purpose in both the visible and the infrared frequency domains5,11,14,16–18).
As for the SERS research, the enhancement factor determined for the gold random film was estimated to be about |E/Eo|4~107, a monolayer of benzenthiol was used as the probe19). The enhancement factor calculated inside the nanogap depends on the confinement of electromagnetic field (gap size) rather than the charge transfer between resonated metallic nanoparticles and absorbed molecules19–21). The enhancement factor increases as the gap size decreases as long as the gap size is larger than the limit for the quantum effects (~1 nm)22,23).
In this work, we prepared the gold random nano-islands films with various particle length and gap size distributions. The image processing analysis of the obtained films by using Fourier transformation displayed the isotropic feature, meaning the random nature of this kind of plasmonic substrate. A Rhodamine 6G layer was used as the probe to demonstrate the SERS effect of the gold random nano-island films and the dependence of its Raman intensity on the gap sizes was found. Interestingly, the samples with the same gold coverage show different Raman intensities with a significant bias to the samples with smaller gap size and particle length. This work provides additional contribution to the fundamental understanding of the SERS effect of gold random nano-islands films.
2. Materials and Methods
2.1 Materials
(3-Aminopropyl) triethoxysilane (APTES), ethanol, hydrogen tetrachloroaurate (HAuCl4), sodium citrate dehydrate, hydroxylamine (50 mass%) in water were purchased from Sigma-Aldrich. All the chemicals were used as received. Water was double-distilled. Glass substrates (microscope slides) were purchased from Matsunami, Japan.
2.2 Film growth
2.2.1 Preparation of aminosilane-functionalized glass substrate
Glass substrates were cleaned ultrasonically and consecutively in distilled water, ethanol, acetone and double-distilled water, 10 min for each. The dried and clean glass substrates were immersed in solution of (10 mass%) APTES in ethanol for one hour. Then, the APTES-functionalized glass substrates were rinsed by double-distilled water and dried in air.
2.2.2 Preparation of gold island films
Immobilization of gold nanoparticles on the aminosilane-functionalized glass: Colloidal gold nanoparticles (AuNPs) were produced by citrate reduction of hydrogen tetrachloroaurate, as described in literature24–26). The whole surfaces of the aminosilane-functionalized glass substrates had been covered by the gold nanoparticle solution for 30 min. Then, the substrates were generously rinsed with double-distilled water to ensure a monolayer of gold nanoparticles absorbed on the aminosilane-functionalized glass substrate. Growth of random gold islands: The glass substrates with immobilized gold nanoparticles were exposed to a stirred mixture in volume of the aqueous solution of 0.3 mM HAuCl4 and the aqueous solution of 0.4 mM NH2OH for a certain time. Then, they were taken out, rinsed by double-distilled water and dried by nitrogen. During the growth of the random gold island film, the change of color of the glass substrates could be observed by naked eyes from pink (immobilized gold nanoparticles) to dark pink, blue-purple, and then gold as the gold nanoparticles were gradually enlarged. The samples were prepared in batches and in each batch they were taken out at different growth times of 3, 15, 25, 35 and 45 min.
Morphology of the samples was observed using a Field Emission Scanning Electron Microscope (FE-SEM, Hitachi S-4800) and the image processing was performed by the open software Gwyddion27).
2.2.3 Raman measurements
Rhodamine 6G (Rh6G) was used as the Raman probe for the demonstration of the SERS effect. Prior to the measurements, a 20 µl volume of a 10 µM Rh6G in ethanol was dropped on the center of the gold island films preheated at 413 K on a hotplate to be spread all over the gold substrate and dried. SERS spectra were then collected by the Raman system Labram -1B Horiba, 50 × lens, laser wavelength of 632.8 nm (He-Ne laser). For each sample, the Raman measurement was normalized from five measurements at different sample locations with an integration time of 10 ms for each measurement to make the statistic on the SERS intensity.
3. Results and Discussion
Gold nano-islands of the random gold nano-island films develop from seed gold nanoparticles (AuNP) of the single layer of AuNP particles (diameter ~15 nm) anchored by the APTES layer26). The reduction of Au3+ ions absorbed on AuNP particle surfaces makes the AuNP particles getting larger, following the Stranski-Krastanov model11,26). The formation of the randomly distributed gold islands with nanogaps in between was assigned to the electrostatic force between gold particles. Figures 1(a)–(c) show the evolution of the film morphology versus growing time, scale bar 300 nm for each figure. The growth process starts from individual, sparse and separated nanoparticles to the randomly distributed, elongated and arbitrary shapes of AuNPs. As the growth process is longer, the particle density increased. In the meantime, the gap size decreases and gap density increases. As can be seen in Fig. 1(a), only 3 min of growing, had the gold nanoparticles been enlarged, reaching a diameter of about 20 nm. After 35 min of growing (Fig. 1(b)), the film developed laterally and the distance between particles became smaller, simultaneously. After 45 min of the growth (Fig. 1(c)), the density of particles increased and their separation (nanogaps) got significantly narrower.
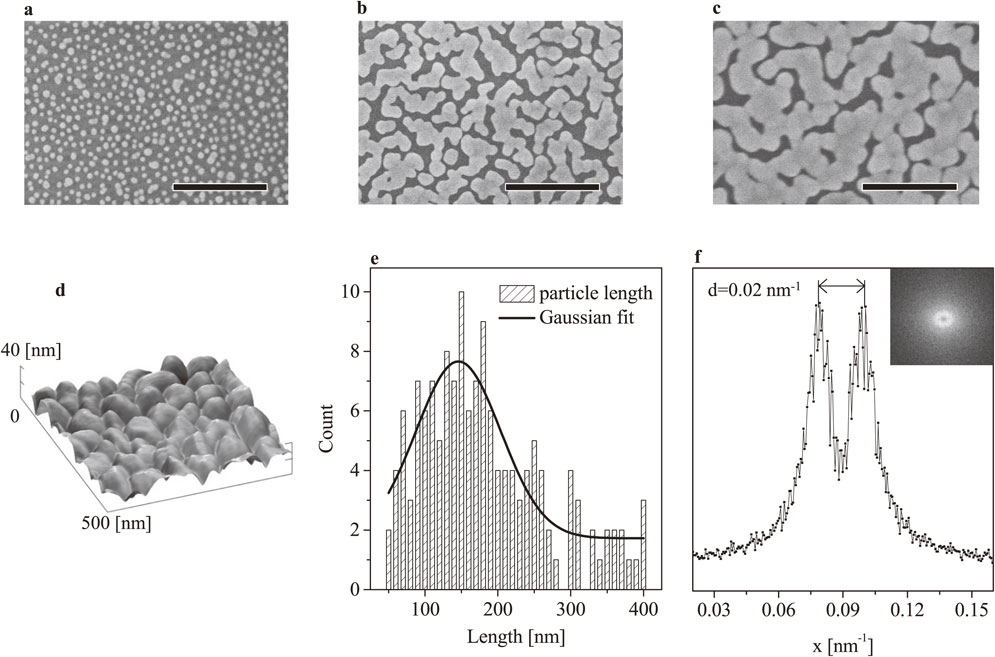
Figure 1(d) presents a typical atomic force microscope (AFM) image of a random AuNP film, taken in the ambient condition using tapping mode. The height profile provided by the AFM image of the film illustrates that the film consisted of well-separated islands with an average height of about 40 nm.
The distribution analysis of the 35 min sample (Fig. 1(b)) shows that the average particle length was 151 ± 7 nm, presented in Fig. 1(e). Figure 1(f) shows the isotropic nature of the random AuNP film by Fourier transformation of the 2-dimensional SEM image. The fast Fourier transformation (FFT) analysis of the sample of 35 min is also presented in Fig. 1(f) and its inset. The ring-like shape of FFT analysis indicates the isotropic feature of this sample with the peak-to-peak distance ~0.02 nm−1, corresponding to d~π/k = 157 nm, not much deviated from the actual particle length (~151 nm) in the real space. The analyzed parameters of all the samples are presented in Table 1. The mean particle size and gold coverage increased from 82 nm and 52% to 143 nm and 75.8%, respectively with growing time, offering the ability to control the film morphology by governing the growing time.

In order to demonstrate the SERS effect of the random AuNP films, the Rh6G was used as a probe by spreading out a thin layer of Rh6G onto the entire surface of random AuNP film. As the enhanced field is mainly located inside the nanogaps between nanoparticles, it is expected that the contribution of the Rh6G molecules inside the nanogaps played a significant role in the Raman signals11).
Figure 2 presents the Raman measurements of two different substrates with the same Rh6G coverage of a random AuNP film (35 min of growth) and a blank glass substrate. The significant difference between intensity of these two spectra demonstrates the obvious dominance of the gold substrate over the glass substrate in term of the SERS effect.

The resonance wavelength of a plasmonic nanoantenna is defined by its size, shape, optical property of the metal used for the fabrication and the dielectric function of surrounding medium28). Considering a single plasmonic nanoantenna with given dielectric constant and surrounding medium, its resonance displays a red-shift if the aspect ratio of the antenna increases and the spectral linewidth gets broader if the shape of the antenna becomes complex22,29). In terms of spectral response, a network of those plasmonic antennas with nanosize separation exhibits the interaction effect that also induces the red-shift and broadening of the resonance frequency, compared to the resonance of the single objects30). The theoretical design for optimizing the SERS intensity from plasmonic nanoantennas should take into accounts all of the above parameters. Obviously, the gap size is a critical point that has greatest impact on the SERS intensity.
Figure 3 presents the influence of the gap size between random Au nano-islands on the SERS intensity of Rh6G. Three samples with different growing times, including 15 min, 35 min and 45 min, had different gold coverage varied from 52.3%, 59.8% and 75.8%, respectively. The distribution of the smallest distances between nano-islands (defined as gap size) was also decreased from 45 nm to 23 nm and 19 nm, correspondingly. It was previously reported that the origin of SERS effect might be either due to the enhancement of the electromagnetic field at the plasmonic antennas or the charge transfer occurring between the antenna and the chemically-absorbed target molecules, for example -S-H terminated molecules31). However, in this case, Rh6G molecules do not have a -S-H terminated group, thus a chemical bonding to the gold surface is not expected. This ensures for the dominance of the electromagnetic field enhancement on the SERS signals, rather than the charge transfer via the chemical bonding. Looking at Fig. 3, it is clear that the SERS intensity solely depends on the gap size. SERS intensity taken at peak 640 cm−1 of sample 15 min is about 1/3 of that of sample 45 min which had 2.3 times smaller gap size. The relative position of the plasmonic resonance of AuNP film and the excited laser should be examined here as well, since the frequency matching of the laser excitation and the plasmonic resonance might induce higher SERS intensity. We present in Fig. 3(b) the diffusion scattering spectra (normalized) for the samples mentioned above. It is also shown that, the sample of 45 min exhibited a closest matching with the laser wavelength (632.8 nm). Hence, the contribution of the resonant matching with the laser wavelength to the SERS intensity should be taken into account. As can be also seen in Fig. 3(b), in addition to the change of the film morphology, varying the growing conditions induces also the shift of the plasmonic peak to the near infrared (from ~570 nm to ~660 nm) and broadens the resonant peak simultaneously.

In order to emphasize further the importance of the gap size on the SERS intensity, we performed the measurements of the SERS effect on the two samples which were similar in terms of gap size (~23 nm) and gold coverage (~60%). It is worth noticing that a small change in the synthesis process could induce a difference in the morphology of the samples and hence, the difference of the SERS spectral response of random gold plasmonic nanoantennas should be seen14). These samples were achieved mainly due to the difference in the humidity of experimental condition when the deposition step of AuNP was performed. Although the two samples display nearly the same gap size and coverage, the SERS signal of sample A was significantly stronger than that of sample B. This observation could be attributed to the greater density of nanogaps and/or shorter average particle length, namely as the following: i) Sample A had a greater density of particles (34.7 × 108 cm−1 particles, fabricated at humidity of 85%) than that of sample B (21.8 × 108 cm−1 particles, fabricated at humitidy 65%). It could then be inferred that the density of nanogaps of sample A was greater than that of sample B. Although the two samples have similar gap sizes, having a higher density of gaps bring out a higher SERS intensity for sample A. ii) Sample A displayed a shorter average particle length than that of sample B. As the particle became longer, its plasmonic resonance moved toward the near-infrared region and even in the mid-infrared region29). Having longer particle length makes sample B more active in the near-infrared region than in the visible region, thereby decreasing SERS intensity in the visible range.
To verify the origin of the different SERS intensity, we performed the distribution of electromagnetic field in the two samples using finite-difference time-domain (FDTD) method (FullWAVE, Synopsys' RSoft) under the same excitation of 632.8 nm. The dielectric functions of Au and SiO2 were taken from the literature32). The simulation domain was chosen with a grid size of 1 nm in a conjunction with a perfectly matched layer boundary condition. The amplitudes of the incident fields were normalized to 1. As a result, the simulated electric field distributions from two samples are presented in Fig. 4(a)–(b). The SEM analysis of sample A and sample B was exploited as 2-D films with uniform height of 40 nm (value taken from AFM image of Fig. 1(d)). The density of the hot-spots by sample A is larger than that of sample B. Also, the field enhancement of sample A is higher than that of sample B. Because sample A consists of AuNP with shorter particle length, its resonance is located at the blue side of sample B, hence, it is further to the laser wavelength compared to sample B. It can be inferred from here, that the density of the gap plays a more important role in the SERS intensity than other factors. As a consequence, the SERS intensity of sample A is significantly higher than that of sample B, as presented in Fig. 4(c).

4. Conclusions
We have presented a useful analysis for the class of gold random plasmonic media and demonstrated the influence of gap size, gap density and the particle length on the intensity of surface-enhanced Raman spectroscopy. The synthesized network of random gold antennas has the isotropic feature in the spatial distribution. The SERS intensity increased once the gap size decreased. Moreover, we found that the SERS intensity also depended on the density of nanogaps as well as the shapes of nanoparticles of the network. This work provides additional information on the understanding of gold random antennas in term of surface-enhanced spectroscopies.
Acknowledgements
This work was financially supported by the National Foundation for Science and Technology Development (NAFOSTED grant “103.02-2013.71”).
REFERENCES
- 1) S. Kawata: Jpn. J. Appl. Phys. 52 (2013) 010001.
- 2) M.T. Sheldon, J. van de Groep, A.M. Brown, A. Polman and H.A. Atwater: Science 346 (2014) 828–831.
- 3) S. A. Maier: Plasmonics: Fundamentals and Applications, (Springer-Heidelberg, 2007).
- 4) H.A. Atwater: Sci. Am. 17 (2007) 56–63.
- 5) S.M. Tabakman, L. Lau, J.T. Robinson, J. Price, S.P. Sherlock, H. Wang, B. Zhang, Z. Chen, S. Tangsombatvisit, J.A. Jarrell, P.J. Utz and H. Dai: Nat. Commun. 2 (2011) 466.
- 6) R. Adato, A.A. Yanik, J.J. Amsden, D.L. Kaplan, F.G. Omenetto, M.K. Hong, S. Erramilli and H. Altug: Proc. Natl. Acad. Sci. USA 106 (2009) 19227–19232.
- 7) E.W. McFarland and J. Tang: Nature 421 (2003) 616–618.
- 8) M.L. Brongersma, N.J. Halas and P. Nordlander: Nat. Nanotechnol. 10 (2015) 25–34.
- 9) K. Kneipp, H. Kneipp, I. Itzkan, R.R. Dasari and M.S. Feldet: Chem. Rev. 99 (1999) 2957–2976.
- 10) K.A. Willets and R.P. Van Duyne: Annu. Rev. Phys. Chem. 58 (2007) 267–297.
- 11) C.V. Hoang, M. Oyama, O. Sato, M. Aono and T. Nagao: Sci. Rep. 3 (2013) 1175.
- 12) M. Osawa: Surface-Enhanced Infrared Absorption, Near-Field Optics and Surface Plasmon Polaritons, ed. by S. Kawata, (Springer Berlin Heidelberg, 2001) pp. 163–187.
- 13) T.S. Bui, T.D. Dao, L.H. Dang, L.D. Vu, A. Ohi, T. Nabatame, Y.P. Lee, T. Nagao and C.V. Hoang: Sci. Rep. 6 (2016) 32123.
- 14) M. Kang, S.-G. Park and K.-H. Jeong: Sci. Rep. 5 (2015) 14790.
- 15) D. Enders, T. Nagao, A. Pucci, T. Nakayamaa and M. Aono: Phys. Chem. Chem. Phys. 13 (2011) 4935–4941.
- 16) S.M. Tabakman, Z. Chen, H.S. Casalongue, H. Wang and H. Dai: Small 7 (2011) 499–505.
- 17) T. Takenaka, J. Uemura and T. Nakagawa: Bull. Inst. Chem. Res. 66 (1988) 5.
- 18) Y.-J. Jen, M. Suzuki, Y.-H. Wang and M.-J. Lin: J. Appl. Phys. 112 (2012) 113111.
- 19) N.A. Hatab, C.-H. Hsueh, A.L. Gaddis, S.T. Retterer, J.-H. Li, G. Eres, Z. Zhang and B. Gu: Nano Lett. 10 (2010) 4952–4955.
- 20) E.C. Le Ru, E. Blackie, M. Meyer and P.G. Etchegoin: J. Phys. Chem. C 111 (2007) 13794–13803.
- 21) U.K. Chettiar, P. Nyga, M.D. Thoreson, A.V. Kildishev, V.P. Drachev and V.M. Shalaev: Appl. Phys. B 100 (2010) 159–168.
- 22) N.J. Halas, S. Lal, W.-S. Chang, S. Link and P. Nordlander: Chem. Rev. 111 (2011) 3913–3961.
- 23) J. Bochterle, F. Neubrech, T. Nagao and A. Pucci: ACS Nano 6 (2012) 10917–10923.
- 24) G. Frens: Nature 241 (1973) 20–22.
- 25) J. Turkevich, P.C. Stevenson and J. Hillier: Faraday Soc. 11 (1951) 55–75.
- 26) S. Hrapovic, Y. Liu, G. Enright, F. Benseba and J.H.T. Luong: Langmuir 19 (2003) 3958–3965.
- 27) http://gwyddion.net/, (accessed: 2017-04-20).
- 28) L. Novotny: Phys. Rev. Lett. 98 (2007) 266802.
- 29) J. Olson, S. Dominguez-Medina, A. Hoggard, L.-Y. Wang, W.-S. Chang and S. Link: Chem. Soc. Rev. 44 (2015) 40–57.
- 30) D. Weber, P. Albella, P. Alonso-González, F. Neubrech, G. Han, T. Nagao, R. Hillenbrand, J. Aizpurua and A. Pucci: Opt. Express 19 (2011) 15047.
- 31) N. Suwandaratne, J. Hu, K. Siriwardana, M. Gadogbe and D. Zhang: Anal. Chem. 88 (2016) 3624–3631.
- 32) Palik, E. D: Handbook of Optical Constants of Solids, 3rd ed., (Academic press, 1998).
