Abstract
Ternary Nb–Re–Si alloy samples were melted and pulled simultaneously in a tetra-arc furnace and rapidly water-quenched after heat treatment at 1150°C for 1200 h. The microstructures of the samples that had been water-quenched after heat treatment were observed and the Nb, Re and Si concentrations in the constituent phases were measured using an electron probe microanalyzer (EPMA). In the cross-sectional structure of the obtained alloy samples, the lower portion of the pulled part consists of Nb5Si3 and Nb–Re–Si ternary compound phases. By contrast, the upper portion consists of Nb5Si3 and Nb solid solution phases. The Nb solid-solution phase, Nb5Si3 and Nb–Re–Si ternary compound are in equilibrium. It was found that the solubility limit of Si in the Nb solid-solution phase ranges from 0.6 to 1.7 at%, while the solubility limit of Re in the Nb5Si3 phase is 1.3–2.0 at%. The maximum amount of Re in the Nb5Si3 phase in equilibrium with the Nb solid solution is about 0.9 at%.
This Paper was Originally Published in Japanese in J. Japan Inst. Met. Mater. 82 (2018) 409–414.
1. Introduction
Ni-based single-crystal superalloys are used in the rotor blades of gas turbines and jet engines. Thermal barrier coatings (TBCs) are typically used to protect the blades from the extremely hot combustion gases present, and internal cooling is also employed to suppress the temperature increase of the base material.1,2) However, the inlet temperature of gas turbines and jet engines has steadily increased over the last several decades as the thermal efficiency of these devices has improved. Furthermore, improving the thermal performance of Ni-based superalloys is hampered by the fact that their melting point is about 1350°C.3) Niobium (Nb) has a high melting point of 2477°C and a density of 8570 kg/m3, which is close to that of Ni. Thus, Nb-based alloys are potential next-generation high-temperature materials that can replace Ni-based superalloys.4,5) However, Nb-based alloys tend to suffer from severe degradation due to high-temperature oxidation, making it essential to develop oxidation-resistant coatings for these alloys.6) Narita et al. proposed a coating with a duplex layer structure containing a χ-phase Re–Cr–Nb alloy as a diffusion barrier layer sandwiched between a Nb-based alloy and an Al-reservoir layer.7) The lifespan of the Al-reservoir layer is controlled by forming a protective Al2O3 layer on its surface. To elucidate the properties and structural stability of the χ-phase Re–Nb–Si alloy, phase diagrams and diffusivity information are essential.
To determine the structural stability of this coating in an ultrahigh-temperature environment, we performed a series of experimental investigations of 1150°C isothermal cross sections for alloy systems based on Nb and Re, in all cases starting with an argon-arc-melted alloy ingot.8,9) However, the composition and structure varied with the position in the ingot because it solidified rapidly owing to cooling from the hearth. Component segregation was also caused by differing densities of elements in the alloy, and we could not obtain a homogeneous structure even in the case of prolonged heat treatment.10)
In this study, we therefore performed simultaneous melting and pulling of Nb–Re–Si ternary alloys in a tetra-arc pulling furnace normally used to grow single crystals of metals and other materials in order to produce samples with component segregation owing to density differences in the alloying elements that had posed insuperable difficulties for conventional argon-arc melting. In this manner, we hoped to elucidate phase equilibria over a wide range of compositions based on the local equilibrium in parts of the pulled samples. The heat-treated samples were then rapidly cooled. We investigated isothermal cross sections of the 1150°C Nb–Re–Si ternary systems based on the cross-sectional microstructure and a quantitative analysis of the elements in each part of the samples.
2. Experimental Procedure
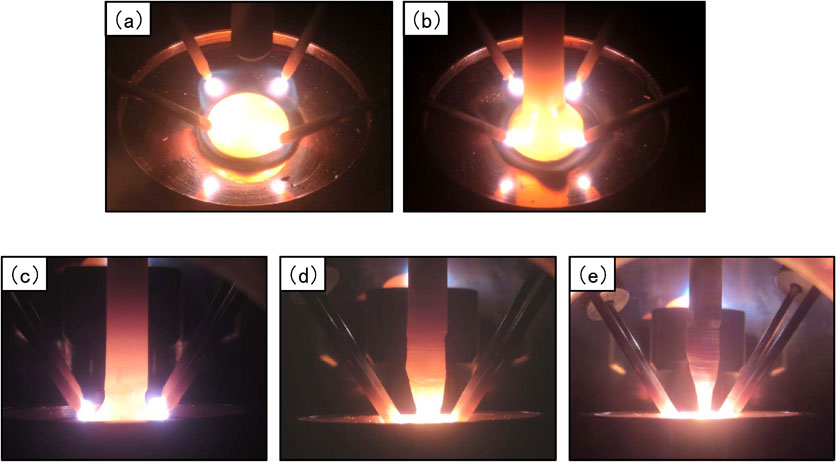
We produced alloy samples containing 50 at%Nb and 10 at%Re, corresponding to the region of coexistence of a Nb solid solution and a χ-Re3Nb phase containing 10 at%Si, based on the Nb–Re binary-system phase diagram.11) The starting materials used to prepare these alloy samples were Re (purity: 99.9 mass%), Cr (purity: 99.99 mass%), and Nb (purity: 99.9 mass%) powders. After weighing the powders, metal forms (ϕ13 mm × t 6 mm pellets weighing about 5 g) were produced by pressurization (load: 502 MPa). The metal forms was melted and solidified in an argon-arc melting furnace with a titanium getter to remove the active gas, and then remelted and pulled in a tetra-arc furnace. Table 1 shows the specifications of the furnace. For the metal sample secured on the pull shaft, we used a Nb round bar (purity: 99.99 mass%) with a diameter of 8 mm, beveled to a leading tip with a diameter of 5 mm. Figures 1(a)–(e) show photographs of the melting and pulling process in a tetra-arc furnace. In Fig. 1(a), the alloy ingot is melted by four electrodes while the hearth part is rotated. In Fig. 1(b), the pulling shaft is next lowered and the tip of the Nb round bar is brought into contact with the surface of the alloy ingot. Pulling then proceeds at a rate of 20 mm/h while melting the alloy ingot. In Fig. 1(c), a pulled part is formed between the Nb round bar and the molten alloy in the initial pulling period, and then gradually narrows.
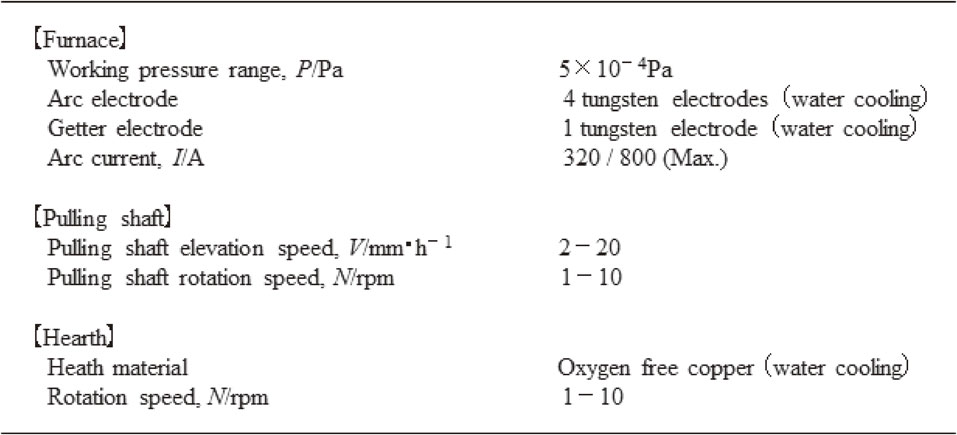
Table 1 Specification for tetra-arc furnace.

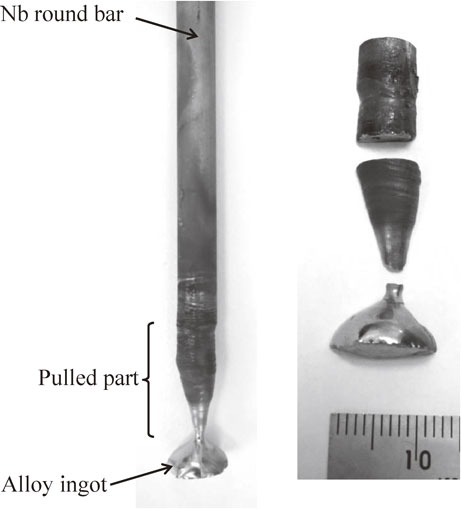
Figure 2 shows the pulled ternary Nb–Re–Si alloy sample in a tetra-arc furnace after cutting it into three segments approximately 20 mm long. Each of the three samples subjected to the heat treatment was wrapped in tantalum foil (purity: 99.95 mass%, t 0.03 mm) to prevent direct contact with the quartz tube. These samples were vacuum-sealed in transparent quartz tubes. After maintaining the samples at 1150°C for 1200 h, the tubes containing the samples were crushed under water to quench the samples. After heat treatment, the cross sections, of the quenched samples were mirror-polished using polycrystalline diamond abrasives. Microstructural observations and quantitative elemental analysis were conducted using an electron probe microanalyzer (EPMA) with an acceleration voltage of 15 kV and a probe current of 3.0 × 10⁻⁸ A. We took the mean of the measurement results at five points to determine the composition of the phase formed in each part in the pulled alloy sample.
3. Results and Discussion
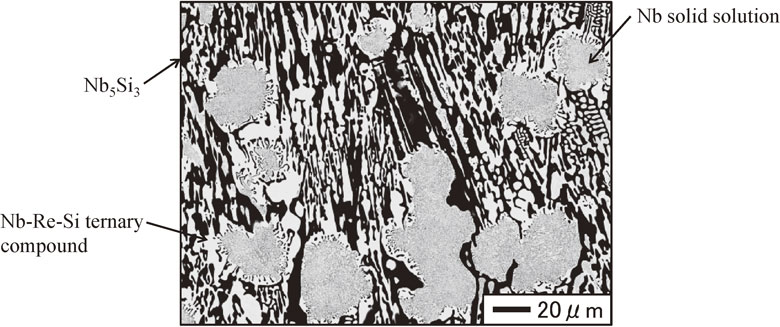
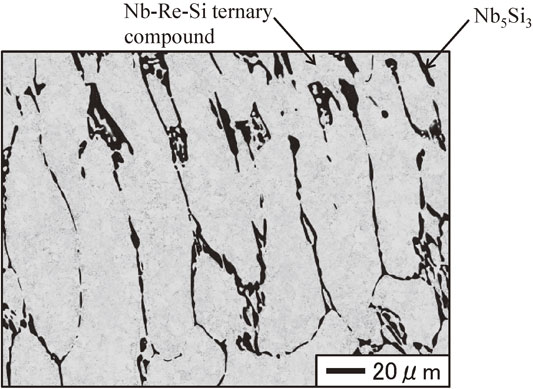
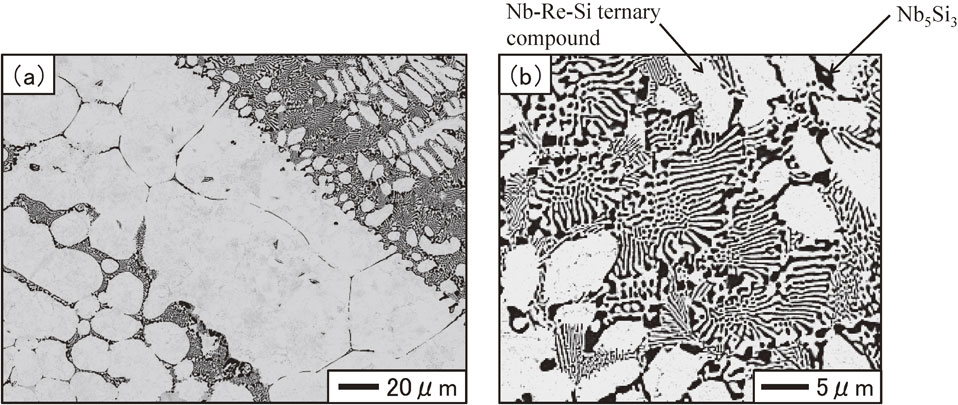
Figure 3 shows the cross-sectional microstructures of the Nb/upper portion interface water-quenched after heat treatment at 1150°C for 1200 h. The gray region in the cross-sectional microstructure is the Nb round bar. As shown in Fig. 3, the microstructure in the pulled part was composed of two regions that appear as light gray and dark gray. The compositions of the regions were 78.4–80.3 at%Nb, 18.0–20.4 at%Re, and 1.2–1.7 at%Si for the light gray regions, and 62.2–62.7 at%Nb, 0.1–0.2 at%Re, and 37.1–37.6 at%Si for the dark gray regions. Figure 4 shows the cross-sectional microstructure of the upper portion of the pulled part water-quenched after heat treatment at 1150°C for 1200 h. As shown in Fig. 4, a coarse structure consisting of white and light gray regions was observed, with white and dark gray regions at their peripheries. The compositions of the regions were 66.4–67.4 at%Nb, 31.7–33.0 at%Re, and 0.6–0.9 at%Si for the light gray regions, 61.8–62.1 at%Nb, 0.6–0.7 at%Re, and 37.2–37.5 at%Si for the dark gray regions, and 60.5–61.3 at%Nb, 27.2–29.0 at%Re, and 10.1–12.3 at%Si for the white regions. Figure 5 shows the cross-sectional microstructure of the middle portion of the pulled part water-quenched after heat treatment at 1150°C for 1200 h. The microstructure of the middle portion was composed of white and light gray regions. These were irregular and approximately 100 µm in width, and were larger than those in the upper portion of the pulled part. The compositions of the regions were 63.5–65.2 at%Nb, 33.7–35.3 at%Re, and 1.0–1.4 at%Si for the light gray regions, 61.7–62.2 at%Nb, 0.4–0.9 at%Re, and 36.7–37.6 at%Si for the dark gray regions, and 59.5–59.8 at%Nb, 29.5–31.3 at%Re, and 8.8–10.9 at%Si for the white regions. Figure 6 shows the cross-sectional microstructure of the lower portion of the pulled part water-quenched after heat treatment at 1150°C for 1200 h. The white regions had the shape of long thin bars approximately 25 µm in width, with dark gray regions at their peripheries. The compositions of the regions were 59.4–60.3 at%Nb, 29.8–31.5 at%Re, and 9.2–10.3 at%Si for the white regions, and 61.1–61.5 at%Nb, 1.3–2.0 at%Re, and 36.7–37.2 at%Si for the dark gray regions. Figure 7 shows the cross-sectional microstructures of the alloy ingot water-quenched after heat treatment at 1150°C for 1200 h. Coarse white areas were concentrated in the lower portion and fine eutectic structures appearing as white and dark gray regions were present in the upper portion as shown in Figs. 7(a) and 7(b). The compositions of the regions were 58.4–59.3 at%Nb, 30.7–33.3 at%Re, and 8.5–10.1 at%Si for the white regions, and 61.1–64.9 at%Nb, 13.0–16.9 at%Re, and 18.6–25.8 at%Si for the dark gray regions. The size of the phases constituting the eutectic structure was smaller than the EPMA spatial resolution; thus, the compositions were those for the eutectic composition.

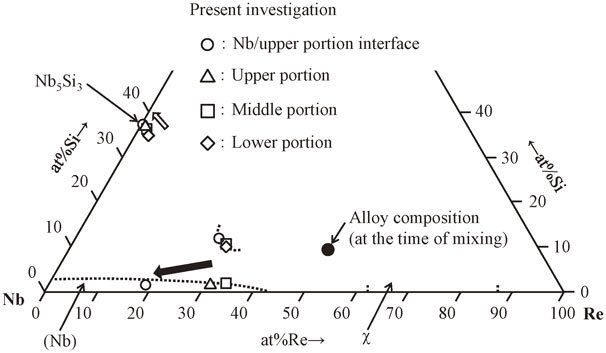
On the basis of the data shown in Figs. 3–6, we determined the composition of each phase in the pulled part. The results are summarized in Table 2, where the values in parentheses show the average and standard deviation, respectively. Figure 8 shows the isothermal section of the ternary Nb–Re–Si system at 1150°C constructed from the results in Table 2. The symbols indicate the composition of each phase in the pulled part and the dotted lines show the estimated phase boundaries. The following tendencies were observed for these results:

Table 2 Compositions (at%) of the each phase in the pulled part.
① At 1150°C, a Nb–Re–Si ternary compound phase forms a region with three coexistence phases comprising Nb5Si3 and Nb solid-solution phases.
② The amount of Si in the Nb solid-solution phase coexisting with the Nb5Si3 or Nb–Re–Si ternary compound phase ranges from 0.6 to 1.7 at% and the phase boundary line of the Nb solid-solution phase is almost defined.
③ Nb5Si3 and Nb–Re–Si coexist in the lower portion of the pulled part, and as the Nb concentration increases in the middle and upper portions, Nb5Si3, Nb solid solution, and the Nb–Re–Si ternary compound all coexist.
④ The amount of Re in the Nb5Si3 phase coexisting with the Nb–Re–Si ternary compound phase is ranges from 1.3 to 2.0 at%, while the amount of Re in the Nb5Si3 phase coexisting with the Nb solid-solution phase ranges from 0.1 to 0.9 at%; the solubility limit of Re in the Nb5Si3 phase decreases with increasing Nb concentration in the pulled part.
These results show that the Nb concentration tends to increase toward the high Nb side in the pulled part from lower portion to upper portion, as indicated by the black arrow in Fig. 8, and that the coexisting phases vary with the Nb concentration. On the other hand, the Re concentration in the Nb5Si3 phase coexisting with the Nb–Re–Si ternary compound phase is approximately 1.7 at%, while the Re concentration in the Nb5Si3 phase coexisting with the Nb solid-solution phase is approximately 0.2 at% and tends to decrease in the direction of the white arrow in Fig. 8. This closely matches the results obtained by Miura et al. for Nb–Nb5Si3 phase equilibrium in the Nb–Re–Si ternary system.12) The alloy composition at the time of mixing is indicated by the black circle in Fig. 8, and it appears that, in the present study, the phase equilibrium relation described above was obtained because the Nb concentration in the alloy ingot increased owing to the melting of the Nb round bar. Regarding the composition of the alloy samples at the time of mixing, it is considered that if a Nb round bar is used together with a Re–Si binary alloy with Nb melting taken into account, the selection of the metal sample used as the pulling shaft is important. Furthermore, Yarmolyuk and Gladyshevskii reported on NbReSi (hP9) as a stoichiometric compound,13) but these have been very few reports on the compounds in the Nb–Re–Si ternary system. Given the variation in element concentration found from our quantitative analysis, it is necessary to determine the tie-line composition of phases after the reheating treatment (1200 h) following the achievement of local equilibrium at 2400 h in a series of experimental investigations of 1150°C isothermal sections and to identify the Nb–Re–Si ternary compound phase.
4. Conclusions
We investigated isothermal cross sections of the 1150°C Nb–Re–Si ternary system from the cross-sectional microstructure and a quantitative analysis of the elements in each part of the samples. The following results were obtained.
-
(1)
The Nb–Re–Si ternary compound phase forms a region with three coexisting phases comprising Nb5Si3 and Nb solid-solution phases.
-
(2)
The solubility limit of Si in the Nb solid-solution phase coexisting with the Nb5Si3 or Nb–Re–Si ternary compound phase ranges from 0.6 to 1.7 at%.
-
(3)
The amount of Re in the Nb5Si3 phase coexisting with the Nb–Re–Si ternary compound phase ranges from 1.3 to 2.0 at%, while the amount of Re in the Nb5Si3 phase coexisting with the Nb solid-solution phase ranges from 0.1 to 0.9 at%.
-
(4)
Nb5Si3 and Nb–Re–Si coexist in the lower portion of the pulled part, and as the Nb concentration increases in the middle and upper portions, Nb5Si3, Nb solid solution, and the Nb–Re–Si ternary compound all coexist.
Acknowledgment
This work was supported by JSPS KAKENHI Grant Number JP17K0 and JST ALCA Grant Number JPMJAL1.
REFERENCES
- 1) R. Vassen, A. Stuke and D. Stover: J. Thermal Spray Technol. 18 (2009) 181–186.
- 2) J.L. Smialek: Surf. Coat. Tech. 206 (2011) 1577–1585.
- 3) Y. Tan, H. Tanaka, C. Ma, A. Kasama, R. Tanaka, Y. Mishima and S. Hanada: J. Achiev. Mater. Manuf. Eng. 24 (2007) 372–381.
- 4) Md. Zafir Alam, B. Venkataraman, B. Sarma and D.K. Dipak: J. Alloys Compd. 487 (2009) 335–340.
- 5) I.L. Svetlov: Inorg. Mater. 2 (2011) 307–315.
- 6) B.P. Bewlay, M.R. Jackson, J.C. Zhao and P.R. Subramanian: Metall. Mater. Trans. A 34 (2003) 2043–2052.
- 7) K. Saito, S. Hayashio, T. Narita, I. Iwanaga and R. Tanaka: Mater. Sci. Forum 522–523 (2006) 309–316.
- 8) S. Saito, T. Takashima, K. Miyama, T. Narita, T. Nagata, I. Masuda and K. Kajiwara: J. Japan Inst. Metals 77 (2013) 424–429.
- 9) S. Saito, T. Takashima, K. Miyama and T. Narita: J. Japan Inst. Metals 80 (2016) 350–354.
- 10) S. Saito, K. Kurokawa, S. Hayashi, T. Takashima and T. Narita: J. Japan Inst. Metals 71 (2007) 608–614.
- 11) T.B. Massalski: Binary Alloy Phase Diagrams, 2nd ed., (ASM International, Almere, 1990) pp. 2756–2757.
- 12) S. Miura, T. Hatabata, T. Okawa and T. Mohri: Metall. Mater. Trans. A 45 (2014) 1136–1147.
- 13) Y.P. Yarmolyuk and E.I. Gladyshevskii: Dopov Akad Nauk Ukr RSR Ser. B 36 (1974) 1030–1032.