Effects of Factors on Contact Forces Analysis between Die and Casting and Validation Using Die-Cast Product
2019 Volume 60 Issue 7 Pages 1390-1397
Details
2019 Volume 60 Issue 7 Pages 1390-1397
In die casting design, residual stress and thermal deformation based FEM analysis are gaining enormous importance.
Shiga et al. have reported that the thermal and residual stress of the I-shaped model could be more accurately predicted by using the elasto-plastic-creep model than by using the conventional elasto-plastic model.
In this study, factors affecting the contact forces between the die and the casting were analyzed by using a little more complicated model than the I-shaped model. The results clearly indicate that, irrespective of shapes, the plastic strain term affects the contact forces the most, and that the creep term further reduces the contact forces. Furthermore, a comparison between the simulated and measured values of the residual stress of an aluminum die-cast product confirms the superiority of the elasto-plastic-creep model than the elasto-plastic model in predicting the residual stress, which could also be used instead of the contact forces.
This Paper was Originally Published in Japanese in J. JFS 90 (2018) 386–392. The title of this paper was slightly modified to match the content of the paper. The references from 3) to 6) were added.
Improved mechanical properties, such as high fracture strength, fatigue strength, and dimensional precision have recently become a requirement of certain die cast products. Additionally, it is necessary to design lightweight shapes that satisfy design specifications within a limited development period. In die casting design, residual stress and thermal deformation based FEM analysis are gaining enormous importance. Proper simulation techniques are required, to accurately predict this outcome. Because residual stress is a cause of strength reduction and thermal deformation within die cast products, it is very important to estimate the residual stress level of the product at a design stage. When this is done, design improvements can be made to improve the reliability and weight of die cast products.
In order to quantitatively assess stress and deformation during solidification and after ejection, it is necessary to consider the material plastic behavior at high temperature and its strain rate as a function of temperature and stress. Oki and Niyama1) studied the relationship between cooling rate and stress during solidification assuming steady state creep for plate, sphere or cylinder castings.
Recently, Motoyama et al.2,3) showed the originally developed elasto-plastic-creep model could describe the recovery. The recovery is used when the analysis of thermal stress that occurs during casting is done. Here, the inelastic strain developed at the high-temperature range does not contribute to strain hardening behavior at the low-temperature range because of metallurgical phenomena such as recovery and recrystallization (hereinafter referred to recovery).3–6) They see this behavior as recovery. The recovery is not considered in the conventional elasto-plastic model. Therefore, its conventional method is expected to overestimate the predicted residual stress of die castings, and cannot predict the thermal stress of the die castings with high accuracy. To solve this problem, Shiga et al.7) conducted the thermal stress analysis on the I-shaped model during cooling to verify the analysis method. It showed that the prediction accuracy of thermal stress greatly was improved. As a result, the difference from the measured value decreased from 50% to 18% by using the elasto-plastic-creep model instead of using the elasto-plastic model.
Based on the above research results, firstly, we thought that it was important to accurately analyze the contact force and its sum between the die and the casting at high temperature, where recovery was occurring. By improving the prediction accuracy of the analysis of the contact force and its sum, secondly, we expected that it was possible to improve a prediction accuracy of residual stress, thermal deformation and ejection force analysis. Here, we defined the total value of the contact force as “contact forces”. The contact forces are generated perpendicularly to the contact surface as the molten metal is solidified in the die. This is dependent upon the difference in thermal expansion coefficient between the die and the casting.
In this study, evaluation was conducted on the effects of various factors on contact forces. This has all become possible due to recent computer performance improvements.
In this study, factors affecting the contact forces were analyzed using a little more complicated model than the I-shaped model, and an aluminum die-cast product model (BRACKET ENGINE MOUNTING). Furthermore, since direct measurement of contact forces is difficult, the residual stress was measured instead of contact forces, and the analysis result was verified.
2.1 Material model and shape of simulated model used for simulationThe material model and shape of simulated model used for the simulation of both simple shaped and product models are shown in Table 1, Table 2, respectively. In order to investigate the effect of material model on both simple shaped and product models, three different geometries were investigated. The input data of the material was the same for both simple and product model shapes. The data of ADC12 was used for creep distortion data, because the near actual condition of aluminum die casting was assumed.7) Table 3 shows a summary of factors affecting on the contact forces of simple shaped models. In addition, the elasto-plastic-creep model as the material model is given in eq. (1) to (3),
| \begin{equation} \varepsilon_{\textit{all}} = \varepsilon_{E} + \varepsilon_{\textit{In}} + \varepsilon_{T} \end{equation} | (1) |
| \begin{equation} \varepsilon_{\textit{In}} = \varepsilon_{P} + \varepsilon_{C} \end{equation} | (2) |
| \begin{equation} \dot{\varepsilon}_{C} = A(T)\cdot\sigma^{n(T)} \end{equation} | (3) |


For cylindrical shape, contact forces were calculated theoretically based on the stress calculation formula at the time of shrink fitting. This time, in conducting a survey on the effects on contact forces using simulation, first of all, we decided to compare the analytical solution to the theoretical solution of the cylindrical contact forces, in order to confirm the validity of the contact forces analysis. Assuming that R1(mm), which is a cylinder corresponding to the draft angle α° = 0° in Fig. 1, is the die radius inside the cylinder, R2(mm) is the product radius of the cylindrical portion, H is the height of the product, α(1/K) is the coefficient of thermal expansion, ΔT(K) is the product temperature difference, E1(MPa) is the Young’s modulus of the die, E2(MPa) is the Young’s modulus of the product, ν1 is the Poisson’s ratio of the product, the contact forces N is derived from eq. (4) to (7).
| \begin{equation} A = 2R_{1}\cdot\pi\cdot\mathrm{H} \end{equation} | (4) |
| \begin{equation} \delta = \alpha\cdot\varDelta\mathrm{T}\cdot R_{1} \end{equation} | (5) |
| \begin{align} P& = \left(\frac{\delta}{R_{1}}\right)\\ &\quad \times\frac{1}{(\mathrm{R}_{2}{}^{2} + R_{1}{}^{2})\{E_{2}(R_{2}{}^{2} - R_{1}{}^{2})\}^{-1} + \nu_{2}\mathrm{E}_{2}{}^{-1} - (\nu_{1} - 1)\mathrm{E}_{1}{}^{-1}} \end{align} | (6) |
| \begin{equation} N = P\cdot\mathrm{A} \end{equation} | (7) |

Schematic drawing of simulated model (Cylindrical and sloped cylindrical shape).
The eq. (4) shows the area A of the contact surface between the die and the product, and the eq. (5) shows the amount of heat shrinkage of the product when it is presumed without a die. The eq. (6) shows the pressure at the interface between the die and the product, and the eq. (7) shows the contact forces.
2.2.2 The contact forces analysis of simple shaped modelsIn contact forces analysis, structural analysis software Abaqus ver. 6.14-4 was used for both the simple shaped model and the die-cast product model.
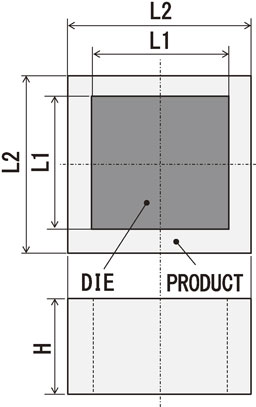
As simple shaped models, two kinds of cylindrical models were used. The inside of cylindrical model was a die. By using these models, we verified the analysis of the elastic model by the theoretical value of the contact forces which were theoretically calculated from the stress calculation formula at the time of shrink fitting. We thought that it was easy to evaluate the effect of the simulation mesh. Also, in order to investigate the effect of the shape, the contact forces analysis was carried out for the two kinds of square tube shape models and the sloped cylindrical shape models. About the sloped cylindrical shape models, one of the draft angles is 1°, another is 5°. The sloped cylindrical shape model is shown in Fig. 1, the square tube shape model is shown in Fig. 2, and the dimensions of the cylindrical shape (①, ②), the square tube shape (①, ②), and the sloped cylindrical shape (draft angles of 1 and 5 degrees) are shown in Table 4.
Schematic drawing of simulated model (Square tube shape).

In considering these simple shaped models, regarding the sloped cylindrical shape, we referred to the research report on ejection force of die castings.9) In this study, measurement results of the ejection force of the sloped cylindrical shape product was reported, and it was reported that when the curing time was longer, the ejection force tended to increase. From the research described above, the sloped cylindrical shape was considered to be the shape that could evaluate the contact forces. Therefore, in this study, the sloped cylindrical shape was adopted as a simple shaped model. The contact forces were calculated by the thermal shrinkage analysis. The thermal shrinkage analysis was carried out by changing temperature of the simple shaped product from 767 K to 499 K. And the cooling time was 15 seconds. Then, the total value of the contact force generated by the thermal shrinkage was evaluated as the contact forces. The product temperature 499 K that described above was decided by reference to the product ejection temperature described in the research report.9)
2.2.3 Factors, levels on contact forces, and confirmation of interactions using Design of ExperimentsAs the factors affecting on contact forces of analytical input parameters, we decided to investigate five factors shown in Table 3 that we considered important.
The evaluation method of the effects on contact forces was shown below. First of all, thermal shrinkage analysis of the simple shaped product was carried out by using the temperature change of the product, and the Young’s modulus (constant value) at the average product temperature 523 K when the product was ejected. Generally, the Young’s modulus tends to rise as the temperature decrease, and the contact forces analysis using the Young’s modulus at room temperature is expected to overestimate the contact forces. Therefore, when we set up a reference model for the evaluation of effects, we used the Young’s modulus at 523 K. Additionally, in each shape, the contact forces obtained by analyzing the elastic model using Young’s modulus at 523 K were considered as a reference value, and this model was used as a reference model (elastic model) in evaluating the effects. For the reference model of cylindrical shape particularly, the analysis result was compared with the value calculated by the theoretical formula to confirm the validity of the analysis result. Then, the result of contact forces analysis at this time was normalized to 1. And the change of the contact forces was evaluated for each shape, when the level was changed with respect to the three factors (temperature dependence of Young’s modulus, die temperature, and simulation mesh node alignment) of the reference model of Table 3. Furthermore, the effects of the plastic strain and creep strain were also compared. However, the effect of the creep strain was evaluated by introducing the creep term including the plastic strain term. Next, in order to confirm the interaction of each factor, each experiment was assigned to the L16 orthogonal array table of two level system for the five factors shown in Table 5, and analyses were carried out. For modeling, we used the elasto-plastic model. And the elasto-plastic-creep model was used when creep strain was included. Finally, analyses of variance were carried out and significant differences were analyzed for each factor and interaction.

In the case of product model, evaluation by Design of Experiments is difficult because it takes much analysis time. Therefore, the effect of the creep strain especially on the contact forces was focused. In order to investigate the effect of creep strain, we analyzed using three material models including temperature dependence of the elastic model, the elasto-plastic model and the elasto-plastic creep model shown in Table 1 and compared them. Contact forces analysis of the product model was carried out in the following procedure.
After heat shrinkage analysis of the product model, the residual stress was analyzed until the temperature of the casting reached 293 K uniformly by air cooling. At this time, in order to simulate the release state of the product, the contact definition as simulation conditions between the product and the die was invalidated and one element in the center of the product was constrained and analyzed.
2.3.3 Residual stress experimental methodThe strain gauges (manufactured by Kyowa Electronic Instruments Co., Ltd., Model: KFG-1-120-C1-23L3M2R, Gauge factor: 2.07 ± 1.0%) were attached to the die-cast product by an adhesive (manufactured by Kyowa Electronic Instruments Co., Ltd., CC-33A) at points from 1 to 9 shown in Fig. 3. These points were considered to be important concerns from the fatigue strength in the design. Then, the die-cast product was cut at near each point. The residual strains were released and measured with a strain measuring instrument (View scanner manufactured by NEC San-ei Instruments, Ltd., Model: DC5200). The residual stresses were ascertained by multiplying the released strain by Young’s modulus at room temperature. The residual stresses were measured by using three die-cast products.

Locations of strain gauge.
The analysis of the elastic model was carried out with the reference model of the cylindrical shape. And the theoretical value and analytical value of contact forces were compared. For the purpose of comparative evaluation, the difference was defined by the following eq. (8). The difference was −3%.
| \begin{align} \text{Difference}\ (\%) &= (\text{analytical value}-\text{theoretical value})\\ &\quad \times 100/\text{theoretical value} \end{align} | (8) |
Figure 4 shows the effect of various factors on the contact forces. In comparison with the elastic model, the factors of the Young’s modulus of the product part, the die temperature, and the simulation mesh node alignment were evaluated. Due to the effect of the temperature dependence of the Young’s modulus, contact forces increased. The reason for this is that the Young’s modulus at the final temperature (T = 499 K) of the product part is larger than the Young’s modulus of the constant at 523 K and the former makes the elastic strain larger. Due to the effect by temperature rise of the die, contact forces increased. Due to the effect of the simulation mesh alignment between the die and the product part, contact forces increased. The reason for this is that the accuracy of the contact calculation is improved by matching the positions of the nodes of the contact surface. At this time, the difference from the theoretical value of the contact forces in the cylindrical shape was −3% to +0.1%. On the other hand, due to the effect of the plastic strain and the creep strain, it was confirmed that the contact forces decreased. By considering the temperature dependence of the Young’s modulus, the die temperature, the simulation mesh alignment, and the plastic strain as input values, the elastic strain were reduced. As a result, contact forces were reduced. Furthermore, the contact forces were reduced by introducing the creep strain term. In addition, even if the shape was changed, the same tendency was obtained.

Effect of various factors on contact forces.
Experiments were carried out using L16 orthogonal table picked up 5 factors, 2 levels. In general, there are many cases where there is no interaction of three or more factors. Even if it exists, it is difficult to understand its meaning. Therefore, the interaction of three or more factors may be regarded as an error. Based on this idea, we evaluated the main factor affecting contact forces and two factor interaction, although the repetition of analysis was not done. And the result of variance analysis in a cylindrical shape② is shown in Table 6. The statistical significant differences of test results in variance analysis of each shape are shown in Table 7.


From the result of Table 6, significant differences were detected with five factors; B. temperature dependence of true stress-true plastic strain curve, C. introduction of creep strain term, D. die temperature, B × C interaction, and B × D interaction. The effect of the factor B was the largest. Next, the effects of the factor C and the factor B × C interaction were large. As significant difference was detected in the interaction of the factor B × C, it was found that when there was the creep strain, plastic strain was largely suppressed, and its effect was also large. Therefore, even if the shape and size of the simple models were changed, the same result as the above tendency was obtained. However, in the analysis results of the contact force distribution, there was a difference depending on the shape, when we focused on the analysis results further. In Fig. 5, in order to estimate the generated stress, contact pressure is used instead of contact force. In the cylindrical shape, the contact pressure was generated almost uniformly. On the other hand, in the square tube shape, the contact pressure was occurred non-uniformly, especially at the corners in the square tube.

Contact pressure distribution of thermal contraction (Cylindrical and square tube shape).
There was an effect of the shape on the distribution of the contact force. However, there was no effect of the difference in shape on the total of the contact force. As a result, the significant difference detection of each factor did not change.10)
3.2 Analysis and experimental results of die-cast product 3.2.1 Effect of introduction of creep strain term on contact forcesFigure 6 shows the comparison of relative contact forces between the elasto-plastic model and the elasto-plastic-creep model in ejector cavity. The analysis result of contact forces of the elasto-plastic model was standardized as 1. The horizontal axis showed the time from injection t = 0 sec to ejection t = 20 sec. The vertical axis showed the relative contact forces for each time. Figure 7 shows the force comparison of the relative contact force between the elasto-plastic model and the elasto-plastic-creep model in an ejector cavity at the time t = 20 sec in Fig. 6. The effect of the creep on contact forces is shown in Fig. 8. The each data showed the decrease by the creep consideration to the elasto-plastic analysis for simple shaped models and the product model. Here, the result of the product model was the result at t = 20 sec. In addition to Fig. 6, in Fig. 7, it was confirmed that the relative contact force further decreased due to the consideration of the creep strain term. In addition, from the results in Fig. 8, the reduction rate of contact forces was 22 to 25% in simple shaped models, and the differences between the shapes were small. However, in the product model, the reduction rate was 39%, and there was a large difference compared with simple shaped models. As a cause of the difference in the product model, we evaluate that the product model has temperature distribution, and the reduction rate of contact forces changes from 0 to 39% depending on the curing time. This analysis result demonstrated that the contact forces were reduced by considering creep strain term in the design of die casting.

Comparison of relative contact forces between elasto-plastic model and elasto-plastic-creep model in ejector cavity.

Comparison of a contour of relative contact force between elasto-plastic model and elasto-plastic-creep model in ejector cavity.

Effect of creep on contact forces.
Figure 9 shows the change of the relative residual stress of part1 and part8 with time. This analysis was conducted by using the elasto-plastic-creep model. Also, Fig. 10 shows the comparison between the simulated and measured values of the residual stress for the three material models. The measurement result also showed the variation of the measurement of three products. Here, the relative residual stress represented the ratio of the residual stress when the maximum value of the residual stress of the elasto-plastic model was normalized to 1.

Change of relative residual stress of part 1 and part 8 with time. (Simulation result of elasto-plastic-creep model)

Comparison of calculated and measured relative residual stress.
Figure 9(a) shows that residual stress changes over time. In addition, Fig. 9(b) shows the initial rise of stress at t = 0 to 20 sec. We evaluated that the contact forces between the die and the die-cast product made the residual stress larger. On the other hand, after ejection at t = 20 sec, Fig. 9(a) shows that the stress of each part changes over time and converges. We evaluated that the residual stress changed due to the shape of the product, as the product was released. In this time, the effect on the residual stress was shown instead of the effect of the contact forces. For the prediction of the residual stress, we evaluated that the effect of the product shape after an ejection was also important. The elastic model in Figure 10 shows that the residual stress was almost determined at the initial uniform temperature and the final uniform temperature of the product, and it became almost 0. Therefore, it was difficult to predict the residual stress distribution in the elastic model. On the other hand, in the elasto-plastic model, the residual stress distribution was qualitatively obtained by the analysis. However, the relative residual stress tended to be larger in the calculated value than the measured value. Particularly, in the part1, the calculated value was about twice as large as the measured value. In the elasto-plastic-creep model, it was found that the stress was relaxed more than the elasto-plastic model, and furthermore, it got closer to the measured value. The model with the highest accuracy of the analysis prediction was the elasto-plastic-creep model. The correlation coefficient between the measured value and the analytical value was also strongly correlated with r = +0.943. The effectiveness of the elasto-plastic-creep model could be confirmed in the residual stress analysis prediction instead of the contact forces. Therefore, by using the elasto-plastic-creep model, improvement of the accuracy of contact forces analysis also can be expected.11)
We would particularly like to thank Waseda University Professor M. Yoshida, Nissan Motor Co., Ltd. K. Yageta, T. Sato, and H. Shiga for giving us valuable feedback as we proceed with this research.