Abstract
The effect of Cu-addition on age-hardening and precipitation have been investigated by hardness measurement, tensile test, high resolution transmission electron microscopy (HRTEM) and high angle annular dark field scanning transmission electron microscopy (HAADF-STEM) techniques. Higher hardness, strength, and lower elongation were caused by increasing amount of Zn + Mg because of increased number density of precipitates. Cu addition also provided even higher peak hardness, strength, and lower elongation. The alloy containing highest Cu content had fine precipitates of GPB-II zones or the second clusters, in the precipitate free zones (PFZs) and the matrix, together with η′/η in the matrix from the early stage of aging. Two regions have been confirmed as the PFZs in the peak aged alloy containing highest Cu: (i) nearest to grain boundary (GB) about 70 nm in width (n-PFZ) and (ii) conventional PFZ about 400 nm in width which can be confirmed by conventional TEM (con-PFZ). The con-PFZ contains fine precipitates consisting of GPB-II zones or the second clusters, even for 2 minutes of aging at 473 K which were not present in the n-PFZ. The fine precipitates, GPB-II zones or the second clusters in the con-PFZ and the matrix disappeared at overaged condition.
1. Introduction
Al–Zn–Mg alloys have been well known as high strength age-hardenable Al alloy.1,2) Cu addition can particularly improve strength of alloys.3–6) Precipitation of Al–Zn–Mg alloys depend on Zn/Mg ratio (mol%). In alloys with Zn/Mg ratio over 2 (high Zn) η′/η phases nucleate in abundance and for low Zn/Mg ratio T′/T phase precipitates. On the other hand, Al–Cu–Mg alloys systems precipitate S′/S or θ′/θ phase depending on Cu/Mg ratio.5,7–9) There are several reports about Cu effect on precipitation on this alloy system.4,6,10–12) In this work, Al–Zn–Mg alloys with different ratios of Zn/Mg have been investigated to understand their effect on age-hardening, microstructures and precipitates. Alloys containing higher ratios of Zn to Mg revealed higher peak hardnesses, ultimate tensile strengths, 0.2% proof stresses and higher number densities of precipitates per unit area. Square shaped T′-phase precipitates have been observed in the matrices of low Zn/Mg ratio alloys aged at 423 K with the aid of Transmission Electron Microscope (TEM) imaging and its selected area electron diffraction (SAED) patterns. While SAED patterns of η′ and/or η-phase have been detected in high Zn/Mg ratio alloys.13) High-Angle Annular Dark Field Scanning Transmission Electron Microscope (HAADF-STEM) characterization along [110]Al showed that except η′/η2 phases, η1 was the second most found precipitate in peak-aged Al–Zn–Mg samples and it incorporated different atomic arrangements from that commonly observed in η′/η2 phases.14) Some age-hardenable Al–Mg–Si, Al–Mg–Ge, and Al–Zn–Mg alloys including Cu were also investigated by TEM to understand extra diffraction spots that appear in their SAED patterns. The initial cluster, which is based on the β′′-phase in the Al–Mg–Si alloy, is proposed to be MgSi(/Ge)Mg, CuMgSi(/Ge), AlCuMg, and AlZnMg, while the second clusters, which consist of three initial clusters including anti-phase boundary short-range order, are proposed for Cu-containing alloys.15)
In this work, the effect of different added amount of Zn + Mg and Cu solute elements on precipitation behavior of Al–Zn–Mg alloys with the same Zn/Mg ratio was investigated using TEM to understand age-hardening behavior. The evidence of co-existence of GPB zones with η′/η phase precipitates has been found out in high Cu added alloy.
2. Experimental Procedure
Five different alloys were prepared by casting in the steel mold. Each alloy has been designed to have the same ratio of Zn to Mg (Zn/Mg ≒ 2), but with different total added amount of Zn and Mg (Zn + Mg ≒ 4.0, 5.5 and 7.0 mol%). The chemical composition of each element in this work is described as mol%. To investigate the effect of Cu addition on Al–Zn–Mg alloy, low and high Cu content versions of alloys (0.2 and 1) were prepared on the selected alloy (Zn + Mg ≒ 5.5). Chemical compositions of the investigated alloys are shown in Table 1. Alloys are designated as ZM31, ZM42, ZM53, ZM42C and ZM42HC according to chemical compositions. Each ingot was homogenized at 743 K for 86.4 ks. Hot extrusion was carried out using homogenized ingots acquiring slabs of 1.5 mm thickness. The extruded plate was prepared with dimensions of about 15 mm in width, 1200 mm in length and 1.5 mm in thickness. This hot extruded plate was cooled down to the room temperature by an air blower cooling. Then, sheets of 1 mm thickness for hardness measurement and 0.2 mm thickness for TEM samples were obtained from this extruded plate by a cold rolling. Sheets after cold rolling were subjected to solution heat treatment at 748 K for 3.6 ks in air atmosphere and quenched into iced-water at 273 K. This solution heat treatment provides fully recrystallized sample. Subsequently, the artificial aging was carried out at 473 K in silicone oil bath. The micro Vickers hardness measurements were conducted using Mitutoyo HM-101 (load: 0.98 N, holding time: 15 s). Tensile specimens of cross-section 0.8 × 0.6 mm and 17.5 mm gauge length were prepared. Tensile loading axis was parallel to extrusion direction. Tensile tests were conducted using peak-aged samples at room temperature with the strain rate of 1.0 × 10⁻³ s−1 using Shimadzu DSS-5000. Fractured surfaces were observed by Scanning Electron Microscopy (SEM, HITACHI S-3500). TEM specimens were prepared by electropolishing using a solution of perchloric acid + ethanol (1:9) for foil thinning to 0.1 mm in thickness, discs of 3 mm in diameter were punched out from this 0.1 mm thickness sheet, and thin foils for TEM observation were prepared by nitric acid + methanol (1:3) for twin-jet electropolishing. TEM observation was conducted using TOPCON 002B with accelerating voltage of 120 kV for obtaining Bright Field images (BF) and SAED patterns. A double aberration-corrected (image and probe Cs) cold-FEG Jeol ARM-200F operated at 200 kV was used for the HAADF-STEM imaging. The probe size was 0.08 nm, the convergence semi-angle was 28 mrad and the inner and outer collection angles were 35 and 150 mrad, respectively. The inner collection angle is somewhat smaller than what is considered for HAADF-STEM (50 mrad), but our experience is that the lower Z-contrast Mg-containing atomic columns are better resolved with this setting.

Table 1 Chemical compositions of the alloys.
3. Results
3.1 Mechanical properties
Figure 1 shows age hardening curves of the alloys aged at 473 K. The alloys exhibit higher hardness with increasing amount of added solute elements. ZM31 alloy shows lowest peak-hardness and age-hardening ability of all the alloys due to its low amount of solute content. Alloy order according to descending peak-hardness value is ZM42HC, ZM53, ZM42C, ZM42 and ZM31. Figure 2 shows nominal stress–nominal strain curves obtained for peak-aged alloys. ZM53 alloy shows high ultimate tensile strength (UTS) and typical intergranular fracture. ZM42HC alloy shows the highest strength and lower total elongation than that of ZM42C alloy. ZM31 alloy shows the lowest UTS and the highest elongation. The fracture path was completely intergranular in ZM53, completely transgranular in ZM31 and mixed mode for other alloys. It is suggested that UTS of each alloy depends on the total amount of solute elements as shown in Table 1. For better understanding of above results the microstructure of each aged alloy was investigated using TEM for aging times where have been indicated by the arrows in Fig. 1.

Figure 3 shows TEM images obtained for peak aged ZM31, ZM42 and ZM53 alloys at 473 K. ZM31 alloy in Fig. 3(a) shows coarse microstructure containing rod or particles shaped η′ and η1 phases mixed with a rectangular shaped T′ phase indicated by black arrows in the same matrix. According to the analysis of SAED patterns, rod or plate shaped precipitates are recognized as η′ and η1 phases, and rectangular shaped precipitate as T′ phase. Microstructure of ZM42 alloy also contains η′ and small volume fraction of T′ phase precipitates based on its BF images and SAED patterns analyze. ZM53 alloy shown in Fig. 3(c) contains η′ and η1 phase in its matrix but without T′ phase. The mean number density of precipitates per unit area was about 500, 1400 and 3500 µm−2 respectively for ZM31, 42 and 53 alloys.

Figure 4 shows bright field (BF) TEM images of precipitates free zone (PFZ) obtained for ZM31, 42 and 53 alloys peak aged at 473 K. The width of PFZ in ZM53 alloy is the narrowest among all alloys. The grain boundary (GB) precipitates in ZM31 alloy were coarser than other alloys, although some GB precipitates were wiped out by electrical polishing. Fine GB precipitate were observed in ZM53 alloy. The mean width of PFZ was about 1270, 1350 and 160 nm respectively in ZM31, 42 and 53 alloys. PFZ in ZM53 was about 1/10 of ZM31 alloy. According to TEM observation, denser and finer precipitates in ZM53 alloy imply for the highest peak hardness and UTS. While, the lowest hardness, UTS and highest elongation in ZM31 alloy are caused by the existence of coarser T′ phase. The behavior of ZM42 alloy was in between that of ZM31 and ZM53 alloy, except for the width of PFZ. Results show that, the higher added amount of Zn + Mg the higher the strength is, even as ratio of Zn/Mg remains the same in each alloy. Subgrain boundaries or low angle GBs at fiber shaped crystal grains could not be confirmed in this work.

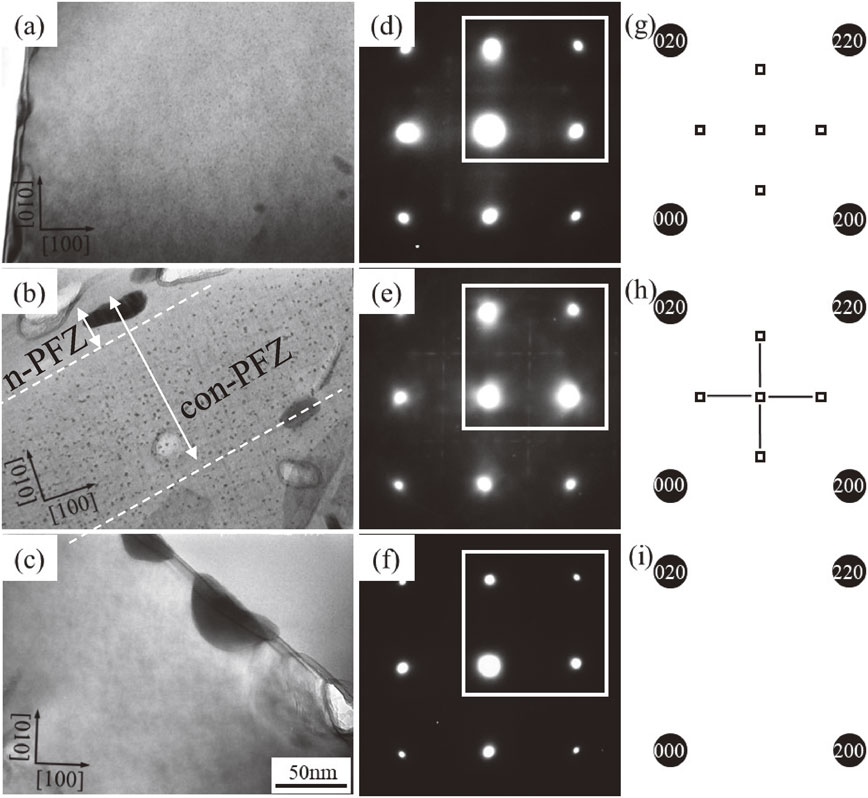
The effect of Cu addition on precipitation has been investigated for ZM42, ZM42C and ZM42HC alloys. Figure 5 shows TEM BF images obtained for ZM42, ZM42C and ZM42HC alloys peak aged at 473 K, to know the effect of different added amount of Cu on precipitation. Microstructures shown in Fig. 5(a) and (b) are almost the same as those of Fig. 3(b) and (e). Precipitation in each alloy is very fine and it cannot be distinguished any difference between 3 alloys. The number density of precipitates per unit area in each alloy was about 1400, 1500 and 3300 µm−2 respectively for ZM42, 42C and 42HC alloys and it looks like that it is depended on the total amount of solute atoms.5,6,11,16,17) SAED patterns obtained for 3 alloys show η′, T′ phases and also spots near Al forbidden reflections as shown in Fig. 5(e) and (f) by open square symbol which position corresponds to GPB-II zones or the second clusters that we have proposed recently.15,18,19) Figure 6 shows TEM images of PFZ obtained for ZM42, 42C and 42HC alloys peak aged at 473 K. The width of PFZ in ZM42HC alloy is the narrowest among all of alloys, which is 1/10 that of ZM42 or ZM42C alloys. The mean PFZ width was 1350, 1360, 380 nm respectively for ZM42, 42C and 42HC alloys. Two types of PFZ have been confirmed: (1) PFZ nearest to GB about 70 nm, and (2) conventional PFZ about 400 nm marked by white dashed lines in Fig. 6(c). Those PFZs are referred as (1) n-PFZ and (2) con-PFZ, respectively. Figure 7(a)–(c) show BF images obtained for regions of GBs marked by rectangles in Fig. 6 and SAED patterns obtained for regions of PFZs marked by dashed circles in Fig. 6. There are no spots corresponding to precipitates in SAED patterns of Fig. 7(d) and (e) except spots arising from Al matrix. To notice is that, there are spots arising in SAED patterns of Fig. 7(f) and (i) which do not fit with spots positions of η′, η or T′/T phases. The only fit is with SAED patterns of GPB-II zones or the second clusters we have previously proposed and which yield spots at positions shown in SAED patterns of Fig. 5(e) and (f). Existence of extremely fine particles of plate or needle shape is confirmed also by BF TEM image shown in Fig. 7(c). Considering altogether with the analysis of SAED patterns, con-PFZ contains GPB-II zones or the second clusters. We refer to those precipitates as the second cluster in this work. Figure 8 shows HAADF-STEM images obtained from a region near one grain boundary in ZM42HC alloy peak aged at 473 K. GB precipitates (GBPs) and precipitates in the matrix can be observed as brighter contrasts. Those are probably η′, η1, T′ phases and the second cluster in the matrix, and η′, η1, T′ phase on the GBs. Figure 8(c) shows an atomic scale HAADF-STEM image acquired in the region marked by white dashed square in Fig. 8(b), which corresponds between n- and con-PFZs. Once more, atomic scale HAADF-STEM characterization has confirmed presence of second clusters in the PFZ in accordance with results of SAED patterns. It is also confirmed by EDS mapping obtained for PFZ. Figure 9 shows HAADF-STEM image and EDS maps obtained from a region near GB marked with square in Fig. 8(a). Zn and Mg are superimposed at the coarsest GB precipitate, which is the largest brightest intensity contrast in Fig. 9(a). Cu and Mg are superimposed at precipitates between n- and con-PFZs marked by arrows. It means that fine precipitates are composed of Cu and Mg and therefore there is a possibility of co-existence of GPB-II zones or second clusters rich in Cu and Mg atoms in the PFZ, and η′/η inside grains and on the GBs. Figure 10 shows enlarged atomic scale HAADF-STEM images obtained for the region in con-PFZ except to n-PFZ shown also in Fig. 8(c). It can be seen the same “peanut patterns” as the GPB-II zones reported by Kovarik et al.20) If these are combination or aggregation of 2 or more second clusters that we have proposed,15) Zn in the AlZnMg second cluster can be replaced by Cu as the AlCuMg second cluster, and this could make possible transformation to S′ phase after long aging.

4. Discussion
According to the present work, there is a possibility that ZM42HC alloy has been decomposed through 2 precipitation sequences, that of Al–Zn–Mg and Al–Cu–Mg alloys systems because of existence of η′/η of Al–Zn–Mg systems and GPB-II or the second clusters of Al–Cu–Mg systems. There are also reports that 2 precipitation sequences act in Al–Zn–Mg–Cu alloys. It means that: (G.P.)T → η′ → η → T and (G.P.)S → S′ → S.6) This assumption is confirmed by prolonged aged samples, especially in their PFZ. Figure 11 shows BF images obtained in the PFZ of samples aged for 0.12, 0.96 and 24 ks. Fine precipitates are observed in Fig. 11(a) and (b) but no precipitate is present in Fig. 11(c). SAED patterns obtained from areas marked by dashed circles in Fig. 11 have been shown in Fig. 12. Figure 12(a)–(c) are enlarged TEM images of areas marked by black rectangles in Fig. 11. Spots near forbidden Al reflections in SAED pattern can be observed in samples aged for 0.12 and 0.96 ks in Fig. 12(d) and (e). Fine precipitates are also observed in Fig. 12(a) and (b). However, precipitates and their corresponding spots have disappeared after 2.4 ks aging as seen in the PFZ shown in Fig. 12(c) and (f). It can be suggested that those fine precipitates consisting of AlCuMg second clusters, probably dissolved in PFZ after prolonged aging and do not transform to more stable S′- or S-phase. It is also slightly possible co-existence of 2 precipitation sequences, that of Al–Zn–Mg and Al–Cu–Mg alloy systems in this ZM42HC alloy. There are several reports about the behavior of Stress Corrosion Cracking (SCC) resistance of Al–Zn–Mg alloys caused by Cu-segregation or Cu incorporation into GB precipitates.21,22) According to our results, the second clusters appear distributed homogeneously inside grains in Cu-added alloys and even in the their PFZs. As the second clusters can be formed in con-PFZ without the participation of Zn atoms, SCC resistance could be affected from those fine precipitate containing Cu. Usually, there are not enough supersaturated vacancies or solute atoms in the PFZs because of GBs sink role and therefore precipitation and growth of large volume fraction of GB precipitates. The AlCuMg second clusters, however, can precipitate in the con-PFZ and the matrix simultaneously with nucleation of η′/η in the matrix. Cu addition probably enhances persistent nucleation of η′/η-MgZn2 phase on the GBs22) and not phase transformation to S′/S-Al2(Cu,Mg) phase. Supersaturated Cu atoms can remain in the PFZ, mainly in the con-PFZ and inside grains, and are consumed to form the second clusters in the PFZ, also in the matrix. We propose two possibilities for nucleation of the second cluster in the con-PFZ.

-
(1)
Precipitates in this alloy are mostly controlled by diffusion, being less sensitive on vacancy concentration, especially for formation of the AlMgCu second clusters.
-
(2)
As Cu-vacancy clusters have stronger binding energy than Zn-vacancy clusters,23) the AlCuMg second clusters can trap vacancies in their structures at the very early stage of aging before nucleation of GB precipitates.
Since the diffusion of Zn in Al-matrix is faster than Cu [1.77 × 10⁵ > 1.5 × 10⁵ (m2/s)] and activation energy of Zn is smaller than Cu [117 < 126 (kJ/mol)],24) then η′ or η could be nucleated on GBs at the very early stage of aging or during quenching. It causes wider composition gradient of Zn or lower content of Zn around GBs than Cu counterpart, right before the nucleation of the second clusters incorporating Cu takes place. Recent 3DAP work proposed the precipitation mechanism in an Al –6.22 mass%Zn –2.46 mass%Mg –2.13 mass%Cu –0.155 mass%Zr (–0.021 mass%Fe) alloy.22) They obtained data of chemical composition and proposed the following sequence: (1) Segregation of solute elements near GB occurs during quenching, (2) GP zones nucleate on GBs meanwhile clusters are formed in the matrix, (3) GP zones on GBs grow to η′ and clusters in the matrix grow to GP zones, (4) (η′ on GBs grow to η) and GP zones in the matrix grow to η′. They could not obtain data about precipitation of GPB, S′-, S-phase or any other precipitate containing Cu. Based on present results, it seems that Cu atoms act as the nucleation sites, even when they are distributed near GBs. We have obtained information about Cu incorporation into the second clusters through SAED patterns, HAADF-STEM imaging and Cu map by EDS. Cu acts as the formation of the AlCuMg second cluster in the matrix and in the con-PFZ.
The PFZ will deform more easily than the interior of grains, because the flow stress in the region within grains where precipitates are densely dispersed is higher than that in the region without precipitates such as in the solid solution or in the supersaturated solid solution, i.e. in the PFZ. It means that the structure consisting of the PFZ and the matrix in the materials is like a deformable thin film sandwiched between hard materials.25) The large preferential deformation near GBs has also been confirmed by our previous works in peak aged Al–Zn–Mg and Al–Mg–Si alloys and we have pointed out its importance for the beginning of cracking during tensile test condition.26,27) According to those reports, the large plastic restriction between crystal grains with densely dispersed precipitates is caused by the narrower n-PFZ which has been found it out in this work, then, the ZM42HC alloy can gives higher strength and elongation than those of the ZM 53 alloy. The effect of the existence of n-PFZ on mechanical properties in this alloy will be required more detailed investigation including parameters of misorientation for GBs, the width of PFZs, the number density and size distribution of GB precipitates related with aging conditions.
5. Conclusions
The effect of Cu-addition on age-hardening and precipitation have been investigated by HRTEM and HAADF-STEM techniques. The obtained data reveal the following conclusions:
-
(1)
Increasing added amount of Zn + Mg solutes causes higher hardness, strength and lower elongation due to increased number density of precipitates.
-
(2)
Cu addition to ZM42 alloy increases peak hardness, strength and lowers elongation.
-
(3)
Alloy containing highest Cu amount (ZM42HC) had fine precipitates which could be GPB-II zones or the second clusters, simultaneously present in the PFZ and inside grains, together with η′/η only present inside grains since the early stage of aging.
-
(4)
Two regions have been confirmed as the PFZs in ZM42HC alloys peak aged at 473 K: (i) nearest to GB (n-PFZ) about 70 nm which does not have any precipitate and (ii) conventional PFZ about 400 nm (con-PFZ) which can be confirmed by conventional TEM.
-
(5)
Fine precipitates consisting of GPB-II zones or the AlCuMg second clusters can form in the con-PFZ, even for 2 minutes of aging at 473 K, but not in the n-PFZ.
-
(6)
Fine precipitates consisting of GPB-II zones or the second clusters, initially simultaneously present in the con-PFZ and inside grains disappeared at overaged condition and large plates of η′/η phases appeared between con-PFZ and the matrix, meanwhile η′/η were preserved inside grains.
Acknowledgement
This work was supported by JST (Japan Science and Technology Agency) under collaborative research based on industrial demand “Heterogeneous Structure Control”: Toward innovative development of metallic structural materials, Light Metal Educational Foundation of Japan, 2018 Ame Hisaharu foundation, and by President description 2018, University of Toyama. The authors also thank to Dr. S. Murakami and Mr. T. Yoshida in Aisin Keikinzoku Co., Ltd. (Imizu, Toyama, Japan), for analysis of chemical composition of alloys.
REFERENCES
- 1) E.A. Starke, Jr. and J.T. Staley: Prog. Aerospace Sci. 32 (1996) 131–172.
- 2) H. Nako, K. Osamura, H. Adachi, K. Hono and T. Ohkubo: J. JILM 56 (2006) 655–661.
- 3) K. Watanabe, K. Matsuda, T. Yoshida, S. Murakami and S. Ikeno: J. JILM 64 (2014) 413–417.
- 4) N.Q. Chinh, J. Lendvai, D.H. Ping and K. Hono: J. Alloys Compd. 378 (2004) 52–60.
- 5) J. Polmear: J. Inst. Metals 89 (1960–61) 51.
- 6) H. Suzuki, M. Kanno and S. Asami: J. JILM 22 (1972) 661–667.
- 7) L.F. Mondolfo, N.A. Gjostein and D.W. Levinson: J. Met. 8 (1956) 1378–1385.
- 8) H. Suzuki, M. Kanno and S. Asami: J. JILM 23 (1973) 452–456.
- 9) P. Villars, A. Prince and H. Okamoto: Handbook of Ternary Alloy Phase Diagram, (ASM International, Materials Park, OH, 1994).
- 10) C. Cayron and A. Buffet: Acta Mater. 48 (2000) 2639–2653.
- 11) X. Fang, Y. Du, M. Song, K. Li and C. Jiang: J. Mater. Sci. 47 (2012) 8174–8187.
- 12) G. Sha and A. Cerezo: Acta Mater. 52 (2004) 4503–4516.
- 13) S. Lee et al. J. JILM 67 (2017) 162–167.
- 14) A. Bendo, K. Matsuda, S. Lee, K. Nishimura, N. Nunomura, H. Toda, M. Yamaguchi, T. Tsuru, K. Hirayama, K. Shimizu, H. Gao, K. Ebihara, M. Itakura, T. Yoshida and S. Murakami: J. Mater. Sci. 53 (2018) 4598–4611.
- 15) K. Matsuda, A. Kawai, K. Watanabe, S. Lee, C.D. Marioara, S. Wenner, K. Nishimura, T. Matsuzaki, N. Nunomura, T. Sato, R. Holmestad and S. Ikeno: Mater. Trans. 58 (2017) 167–175.
- 16) T. Engdahl, V. Hansen, P.J. Warren and K. Stiller: Mater. Sci. Eng. A 327 (2002) 59–64.
- 17) T. Marlaud, A. Deschamps, F. Bley, W. Lefebvre and B. Baroux: Acta Mater. 58 (2010) 248–260.
- 18) L. Kovarik, P.I. Gouma, C. Kisielowski, S.A. Court and M.J. Mill: Acta Mater. 52 (2004) 2509–2520.
- 19) L. Kovarik, P.I. Gouma, C. Kisielowski, S.A. Court and M.J. Mill: Mater. Sci. Eng. A 387–389 (2004) 326–330.
- 20) L. Kovarik and M.J. Mills: Acta Mater. 60 (2012) 3861–3872.
- 21) R. Goswami, S. Lynch, N.J.H. Holroyd, S.P. Knight and R.L. Holtz: Met. Mater. Trans. 44 (2013) 1268–1278.
- 22) H. Zhao, F.D. Geuser, A.K. Silva, A. Szczepaniak, B. Gault, D. Ponge and D. Raabe: Acta Materialia 156 (2018) 318–329.
- 23) S. Hirosawa, F. Nakamura, T. Sato and T. Hoshino: J. JILM 56 (2006) 621–628.
- 24) Kinzoku Data Book, 2nd ed., (Maruzen, Tokyo, Japan, 1983) p. 24.
- 25) T. Kawabata and O. Izumi: Acta Metall. 24 (1976) 817–825.
- 26) Y. Uetani, K. Matsuda, T. Katayama, S. Rengakuji and S. Ikeno: J. JILM 47 (1997) 475–480.
- 27) K. Watanabe, K. Matsuda, N. Miura, Y. Uetani, S. Ikeno, T. Yoshida and S. Murakami: J. JILM 64 (2014) 368–372.