2. Experimental
Disk-like Ti-17 samples were fabricated using a 1500-ton forging simulator.7) Its chemical compositions are shown in Table 1. First, a Ti-17 ingot with a diameter of 120 mm and a height of 240 mm was forged at 1073 K to a round disk-like sample. Then, a quarter of the forged disk-like sample was cut to prepare the tensile and fatigue specimens. For the preparation, the cut pieces were subjected to solution treatment (ST) at four different temperatures: 1063, 1123, 1143, and 1203 K followed by water quenching (WQ). The β transus temperature of Ti-17 is approximately 1163 K; therefore, the ST temperature of 1203 K was slightly higher than the β transus temperature, but within the β region. The other three ST temperatures were lower than the β transus temperature, and in the (α + β) region. Each sample was then subjected to an aging treatment at 893 K for 8 h, followed by air cooling (AC). The heat treatment processes are schematically shown in Fig. 1. The samples subjected to aging after the different STs were denoted as ST/1063 K, ST/1123 K, ST/1143 K, and ST/1203 K, according to the ST temperatures. Smooth round bar-shaped tensile specimens with a gage diameter of 7.0 mm, a gage length of 14 mm, and a total length of 34 mm, hour-glass shaped fatigue specimens with a minimum diameter of 3 mm and a length (without the gripping part) of 28 mm, and a total length of 52 mm for load-controlled fatigue tests to obtain high cycle fatigue life, and smooth round bar fatigue specimens with a diameter of 3 mm, a gage length of 15 mm, and a total length of 52 mm for strain-controlled fatigue tests to obtain low cycle fatigue life were machined from the aged samples. The specimen surfaces of tensile, and load- and strain-controlled fatigue test specimens (the geometries are shown in Fig. 2) were finished by #1500 grid SiC emery paper, mirror polishing, and #1500 grid SiC emery paper, respectively. The long axes, namely stress axes of the tensile, and load- and strain-controlled fatigue test specimens were perpendicular to the radial direction of the forged disk-like sample. Tensile tests were carried out at a strain rate of 0.5%/min up to a strain of 5% and after that, a strain rate of 1.5%/min using an Instron-type testing machine with a capacity of 10 kN, at ambient temperature. Fatigue tests under load-controlled conditions were carried out at a stress ratio of 0.1 and a frequency of 10 Hz using an electro-hydraulic servo fatigue-testing machine with a capacity of 5 kN, at ambient temperature. The maximum cyclic stress, at which the specimen did not fail at 106 cycles, namely fatigue strength at 106 cycles was defined as the fatigue limit in this study. One of the reason to investigate the fatigue strength 106 cycles is that the strain-controlled fatigue life is generally emphasized in aircraft engine components. The Fatigue tests under strain-controlled conditions were carried out at representatively selected total strain ranges of 1.05, 1.1, and 1.2, respectively to examine relative fatigue life among specimens using an electro-hydraulic servo fatigue testing machine with a capacity of 100 kN, at ambient temperature.

Table 1 Chemical composition of Ti-17 in mass%.
Tensile and fatigue fracture surfaces were observed using a scanning electron microscopy (SEM) at an accelerating voltage of 20 kV.
Specimens with a thickness of 4 mm for micro-Vickers hardness measurement were cut from the center of the gripping parts of the tensile tested specimens, and then finished by #1500 grid SiC emery paper. The micro-Vickers hardness of the samples was measured using a micro-Vickers hardness tester with an indention load of 0.245 N and a holding time of 10 s.
Specimens with a thickness of 4 mm for microstructural observations were cut from the center of the gripping parts of the tensile tested specimens, and then finished by #4000 grid SiC emery paper and buff polishing. Microstructural observations were carried out using an optical microscopy.
3. Results and Discussion
3.1 Microstructure
The optical microstructures of ST/1063 K, ST/1123 K, ST/1143 K, and ST/1203 K are shown in Fig. 3. The dotted line in each micrograph indicates the prior β grain boundary.
The microstructure of ST/1203 K exhibits equiaxted prior β grains with an average grain diameter of 546 µm composed of fine acicular α precipitated by aging treatment: secondary α because it was subjected to ST at a temperature higher than the β transus temperature. However, the microstructures of ST/1063 K, ST/1123 K, and ST/1143 K exhibits elongated prior β grains composed of two different microstructural feature regions: acicular and fine spheroidal α phase regions, both of which are primary α. The area except these primary α area is composed of secondary α and β phases. The average thickness of the prior β grain increases with increasing ST temperature as listed in Table 2.

Table 2 Average thickness of elongated prior β grain.
The highly magnified optical micrographs of acicular and fine spheroidal α phase regions in ST/1063 K, ST/1123 K, and ST/1143 K are shown in Fig. 4. The volume fractions of both acicular and fine spheroidal α phases decreases with increasing ST temperature, and are listed in Table 3 with ST temperature. On the other hand, the volume fraction of (secondary α + β) area increasing with increasing ST temperature: namely the volume fraction of secondary α increasing with ST temperature.

Table 3 Volume fractions of acicular and fine spheroidal α phases.
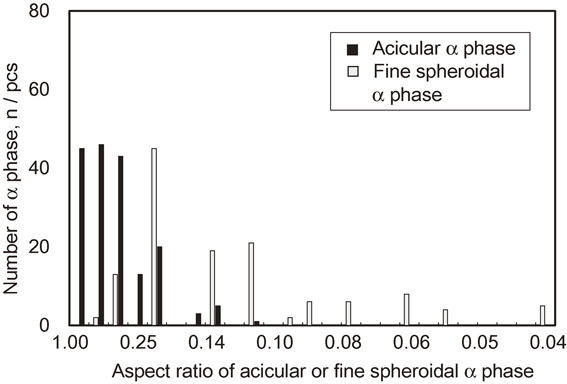
The aspect ratios (short axis divided by long axis) of acicular and fine spheroidal α phases versus their numbers in ST/1063 K, ST/1123 K, and ST/1143 K are shown in Figs. 5, 6, and 7. The number of the fine spheroidal α phase with low aspect ratio is also large, as well as that of the acicular α phase at the lowest ST temperature of 1063 K, but they disappear at ST temperatures of 1123 and 1243 K. The numbers of both α phases decreases with increasing ST temperature. The numbers of both α phases with relatively high aspect ratios increases with increasing ST temperature.
3.2 Vickers hardness
Vickers hardness values of ST/1063 K, ST/1123 K, ST/1143 K, and ST/1203 K are shown in Fig. 8 as a function of ST temperature. The Vickers hardness increases with increasing ST temperature.
3.3 Tensile properties
The tensile properties as a function of ST temperature and stress-strain curves of ST/1063 K, ST/1123 K, ST/1143 K, and ST/1203 K are shown in Figs. 9 and 10. Notably, the 0.2% proof stress, σ0.2, and tensile strength, σB, increase with increasing ST temperature up to 1143 K within the (α + β) region, but decrease with further increasing ST temperature to 1203 K within the β region. In addition, the elongation, EL, and reduction of area, RA, decrease with increasing ST temperature and becomes nearly 0%, corresponding to an ST temperature of 1203 K. Interestingly, the σ0.2 and σB of ST/1203 K are equivalent. The specimen is likely fractured in elastic deformation region of true stress-strain curve, which will be shown below. However, σ0.2 was obtained in ST/1203 K as stated above. Therefore, a small amount of plastic deformation seems to be occurred, but ST/1203 K is fractured in a brittle manner.

SEM fractographs of ST/1063 K, ST/1123 K, ST/1143 K, and ST/1203 K are shown in Fig. 11. Ductile transgranular fracture morphologies are observed in the fracture surfaces of ST/1063 K, ST/1123 K, and ST/1143 K, although the fracture surface becomes flatter and the depth of dimples becomes shallower with increasing ST temperature. However, a brittle grain boundary fracture is observed in the fracture surface of ST/1203 K, because the intragrain strength exceeds the strength of the prior β grain boundary due to the precipitation of secondary α by aging treatment.
The tensile stress-strain curves of ST/1063 K, ST/1123 K, ST/1143 K, and ST/1203 K well exhibits the their fracture trends as described above.
3.4 Fatigue life under load-controlled conditions: high cycle fatigue life
Fatigue lives under load-controlled conditions of ST/1063 K, ST/1123 K, ST/1143 K, and ST/1203 K are shown in Fig. 12 as maximum cyclic stress, σmax, -number of cycles to failure, Nfl, (S-Nfl) curves. The fatigue limit increases with increasing ST temperature up to 1143 K, corresponding to the (α + β) region; however, it decreases with further increase in the ST temperature to 1203 K. Accordingly, ST/1203 K exhibits the lowest fatigue limit.

SEM fractographs of ST/1063 K, ST/1123 K, ST/1143 K, and ST/1203 K subjected to the load-controlled fatigue tests are shown in Fig. 13. The crack initiates from the surface of the specimen for ST/1203. The crack initiation site is featureless and the crack propagation region exhibits a brittle fracture surface showing grain boundary fracture morphology similar to that of its tensile fracture surface. However, the crack initiates from subsurface of the specimen for ST/1063 K, ST/1123 K, and ST/1143 K: the subsurface crack initiation site was observed in 80% of the specimens.

The differences in the fracture surface and microstructural morphologies, and fatigue strength and tensile properties of ST/1203 K, which is subjected to ST in the β region, from those of ST/1063 K, ST/1123 K, and ST/1143 K, which are subjected to ST in the (α + β) region are relatively large, and Ti-17 subjected to ST in the β region is not suitable for practical applications in engine components. Furthermore, the fatigue ratio demonstrates more clearly the resistance to fatigue failure of materials because fatigue failure is caused at very restricted weak site in the microstructure such as α phase and interface between α and β phases as compared with the case of tensile fracture. The fatigue cracks of the (α + β)-type titanium alloys such as Ti–6Al–4V, Ti–6Al–7Nb, and Ti-17 subjected to aging treatment after solution treatment below β transus temperature having primary α phase were reported to initiate at slip band formed in primary α phase,8,9) micro crack formed at interface between primary α and β phases,8) interface of primary α phase,10,11) or interface between primary α phase and (β + secondary α phase)-region.9–11) On the other hand, in the (α + β)-type titanium alloys such as Ti–6Al–4V and Ti–6Al–7Nb subjected to aging treatment after solution treatment over β transus temperature having acicular α phase in the whole microstructure, the fatigue cracks were reported to initiate in unit of colony or prior β grain.9–11) The fatigue crack initiation mechanism is different between the alloys having primary α phase and acicular α phase in the whole microstructure. The morphologies of the fatigue surfaces of ST/1063 K, ST/1123 K, and ST/1143 K are similar each other, but significantly different from that of ST/1203 K in this study. Therefore, the fatigue ratios (maximum cyclic stress range at each number of cycles to failure/tensile strength) of ST/1063 K, ST/1123 K, and ST/1143 K having primary α phases are shown in Fig. 14 as a function of the number of cycles to failure. The fatigue ratios at the fatigue limits of ST/1063 K, ST/1123 K, and ST/1143 K are 0.92, 0.85, and 0.82, respectively. Therefore, ST/1063 K shows the greatest fatigue ratio at the fatigue limit, which was shown in Fig. 14.

Fatigue lives of ST/1063 K, ST/1123 K, ST/1143 K, and ST/1203 K under strain-controlled conditions are shown in Fig. 15 as the total strain range, Δεt, as a function of number of cycles to failure, Nfs. The fatigue life tends to increase with decreasing ST temperature and Δεt in the case of ST/1063 K, ST/1123 K, and ST/1143 K contrary to the trend recognized in the fatigue life under load-controlled conditions. A.W. Funkenbusch and L.F. Coffin6) have reported the low cycle fatigue life of Ti-17 fabricated under nearly the same condition as that of present ST/1063 K, and its reported fatigue life is nearly the same as that of the present ST/1063 K.
The fatigue life is the worst in the case of AT/1203 K; this trend is same as that in its fatigue life under load-controlled conditions. The fatigue life of AT/1203 K is, in particular, not well related to Δεt; this seems to be related to the brittleness of this material.
Although there maybe possibility to get better correlation between the plastic strain range or elastic strain range and the number of the cycles to failure, the total strain range, Δεt, is used to relate with the fatigue life, namely the number of cycles to failure in this study. Further investigation is required to make this problem to be clear in future.
SEM fractographs of ST/1063 K, ST/1123 K, ST/1143 K, and ST/1203 K subjected to strain-controlled fatigue tests at total strain ranges of 1.05% and 1.2% are shown in Figs. 16 and 17. Almost all of the cracks tend to initiate from the surface of the specimen although almost all the cracks tend to initiate from the subsurface of the specimen under load-controlled conditions as stated above. The difference in the fatigue crack initiation site between load- and strain-controlled conditions are currently unclear. Further investigations are necessary to solve this problem in future.
3.6 Quantitative relationship of fatigue life and microstructural factor or tensile property
(1) Under load-controlled conditions
The authors focused on the samples subjected to solution treatment at temperatures less than the β transus temperature according to the discussion on the crack initiation mechanism stated above in the section of 3.4. The relationship between the fatigue ratio at fatigue limit, R, and the volume fraction of the primary α phase, V(%), for the samples subjected to ST at temperatures less than the β transus temperature was found as shown in Fig. 18 in this study: the volume fraction of the primary α phase is inversely related to that of the secondary α phase. This relationship can be expressed as the following equation.
| \begin{equation}
\mathrm{R} = F_{l}/\sigma_{B} = 0.80\mathrm{e}^{0.0029V(\%)}
\end{equation}
| (1) |
where
Fl and σ
B are the fatigue limit and the tensile strength, respectively.
Therefore, the fatigue limit can be calculated using eq. (1) when the tensile strength and volume fraction of the primary α phase are known. However, the accuracy of the eq. (1) should be more raised by increasing the data points in future.
(2) Under strain-controlled conditions
The fatigue life, which is the number of cycles to failure, Nfs, for each Δεt was found to be well related to the tensile ductility, namely elongation obtained by tensile testing sated above. Therefore, the tensile true strain at breaking of the specimen, εTT, which is well express the tensile ductility was adopted to relate with Nfs. The relationship between εTT and Nfs for each Δεt is shown in Fig. 19. εTT was calculated by the following equation.
| \begin{equation}
\varepsilon_{TT}=\ln (A_{I}/(A_{I}-A_{F}))
\end{equation}
| (2) |
where
AI and
AF are the initial cross section of the tensile specimen and the cross section of the fractured tensile specimen, respectively.
The relationship between εTT and Nfs for each total strain range, Δεt = 1.05, 1.10, or 1.2% can be expressed by the following equations.
| \begin{equation}
\varepsilon_{TT} = 0.6\cdot 10^{-3}\mathrm{N}_{\text{fs}}{}^{0.62}\quad \text{for $\varDelta\varepsilon_{t} = 1.05$%}
\end{equation}
| (3) |
| \begin{equation}
\varepsilon_{TT} = 0.8\cdot 10^{-3}\mathrm{N}_{\text{fs}}{}^{0.56}\quad \text{for $\varDelta\varepsilon_{t} = 1.10$%}
\end{equation}
| (4) |
| \begin{equation}
\varepsilon_{TT} = 2.5\cdot 10^{-3}\mathrm{N}_{\text{fs}}{}^{0.41}\quad \text{for $\varDelta\varepsilon_{t} = 1.2$%}
\end{equation}
| (5) |
Therefore, the low cycle fatigue life is well quantitatively related to the ductility of the materials in this study.
εTT was also found to be well linearly related to V(%) of the primary α phase as show in Fig. 20. εTT can be expressed by the following equation.
| \begin{equation}
\varepsilon_{TT} = 5.9\times 10^{-3}\cdot V(\%) + 5.3\times 10^{-2}
\end{equation}
| (6) |
Therefore, quantitative relationship between the fatigue life (the number of cycles to failure: Nsf) for each εt and V(%) can be given by following each equation.
| \begin{equation}
\text{N$_{\text{fs}}$} = \mathrm{e}^{1.6\log (9.8\cdot V(\%)+88.3)}\quad \text{for $\varDelta\varepsilon_{t} = 1.05$%}
\end{equation}
| (7) |
| \begin{equation}
\text{N$_{\text{fs}}$} = \mathrm{e}^{1.8\log (7.4\cdot V(\%)+66.3)}\quad \text{for $\varDelta\varepsilon_{t} = 1.1$%}
\end{equation}
| (8) |
| \begin{equation}
\text{N$_{\text{fs}}$} = \mathrm{e}^{2.4\log(2.4\cdot V(\%)+21.2)}\quad \text{for $\varDelta\varepsilon_{t} = 1.2$%}
\end{equation}
| (9) |
The fatigue live under strain-controlled conditions for each total strain range is swell quantitatively related to the volume fraction of the primary α phase.