Abstract
Two multicomponent β-type Zr alloys were designed using the d-electron alloy design method, and their mechanical properties, magnetic susceptibility, and Young’s modulus were evaluated. A phase stability ($\bar{\text{B}}_{\text{o}}$–$\bar{\text{M}}_{\text{d}}$) map was constructed by performing theoretical calculations and was subsequently used to determine alloy compositions (Zr–14Nb–5Ta–1Mo and Zr–14Nb–10Ta–1Mo mass%) based on the results previously obtained for Zr–Nb, Zr–Mo, and Zr–Ta ternary alloys. The designed alloys were fabricated via arc melting and casting methods. They consisted of the β-phase and a small volume fraction of the ω-phase. Both alloys exhibited similar mechanical properties; however, a higher strength of 796 MPa and an elongation of 15% were obtained for the Zr–14Nb–5Ta–1Mo alloy. Furthermore, the fabricated Zr–14Nb–5Ta–1Mo and Zr–14Nb–10Ta–1Mo alloys were characterized by low magnetic susceptibilities of 16.96 × 10⁻⁹ and 17.34 × 10⁻⁹ m3 kg−1, respectively, and Young’s moduli of 61 GPa and 58 GPa, respectively. In conclusion, the designed alloys demonstrated a good balance of mechanical properties with low Young’s moduli and magnetic susceptibility.

1. Introduction
Magnetic resonance imaging (MRI) is a technique widely used in surgical diagnosis, due to its advantages over X-ray diagnosis (e.g., it does not require exposure to irradiation and can be utilized for imaging soft tissues such as blood vessels). Conversely, the drawbacks of MRI include various artifacts and image defects resulting from the implantation of metallic devices within a human body. Particularly, the appearance of artifacts is caused by the differences in magnetic susceptibility between the implanted metallic devices and surrounding tissues. Moreover, the magnetic susceptibility of implanted metallic devices is known to be directly proportional to the artifact volume. Therefore, the number of artifacts can be minimized by using metallic materials with low magnetic susceptibilities.
For 316L-type stainless steel and cobalt-chromium alloys, relatively large volumes of artifacts are observed because the magnetic susceptibilities of their Fe, Ni, and Co components are considerably larger than those of other metals.1) Even Ti alloys produce artifacts, although the magnetic susceptibility of Ti is relatively small. In this respect, Zr metal can be used to decrease the artifact volume, due to its low magnetic susceptibility, high corrosion resistance, and low cytotoxicity.2) However, the strength of commercially available pure Zr is almost identical to that of pure Ti, which is significantly lower than the strength of Ti alloys; hence, it is insufficient for use in medical devices. Consequently, Zr must be combined with alloying elements that are safe, exhibit low magnetic susceptibility, and promote solid solution strengthening. Zr–Nb3–6) and Zr–Mo2,7) alloys were previously studied because Nb and Mo metals were characterized by low magnetic susceptibility and absence of cytotoxicity, while their magnetic susceptibility and mechanical properties depended on the compositions of the corresponding crystal phases.7) According to the results of these studies, the magnetic susceptibilities of Zr–Nb and Zr–Mo alloys are approximately five times lower than those of Co–Cr–Mo alloys and three times lower than the susceptibilities of Ti alloys.
Furthermore, low Young’s modulus is required for metallic biomaterials because high Young’s modulus leads to bone resorption. The “d-electron alloy design method” developed by Morinaga et al.8) is based on the molecular orbital calculations of electronic structures. Using this method, a Ti–29Nb–13Ta–4.6Zr alloy was designed as a metastable β-type alloy.9) It was further transformed to the β-phase via heat treatment and forging and exhibited the lowest Young’s modulus compared with other β-type alloys.
Thus, the utilization of Zr alloys in medical applications requires significant strengthening with low Young’s modulus, while retaining low magnetic susceptibilities. Hence, some multicomponent Zr system alloys must be designed in accordance with this criterion. In this study, multicomponent Zr alloys were designed using the d-electron alloy method to achieve new β-type Zr alloys with high strength, low magnetic susceptibility, and low Young’s modulus.
2. Materials and Methods
2.1 Theoretical alloy design
Zr alloys with various compositions were designed according to the procedure presented in the flowchart in Fig. 1.10) Their electronic structures were determined using the d-electron alloy design method. Two alloying parameters were obtained theoretically: bond order (Bo) and metal d-orbital energy level (Md). The former is a measure of the covalent bond strength between Zr and an alloying element, while the latter correlates with the electronegativity and metallic radii of the constituent elements. The values of Bo and Md were previously determined for different Zr alloys by computing the compositional averages of the alloy parameters (denoted as $\skew3\bar{B}_{\text{o}}$ and $\skew3\bar{M}_{\text{d}}$, respectively) using the following formulas:10)
| \begin{equation}
\skew3\bar{B}_{\text{o}} = \Sigma X_{i} \cdot (B_{\text{o}})_{i},
\end{equation}
| (1) |
| \begin{equation}
\skew3\bar{M}_{\text{d}} = \Sigma X_{i} \cdot (M_{\text{d}})_{i},
\end{equation}
| (2) |
where (
Bo)
i and (
Md)
i are the
Bo and
Md of atom
i, respectively, and
Xi is the atomic fraction of atom
i. The calculated
$\skew3\bar{B}_{\text{o}}$ and
$\skew3\bar{M}_{\text{d}}$ values were used to construct a phase stability (
$\skew3\bar{B}_{\text{o}}$–
$\skew3\bar{M}_{\text{d}}$) map, which was subsequently used to determine the final compositions of the designed Zr alloys by taking into account the mechanical properties and magnetic susceptibilities of previously studied binary Zr alloys.
2.2 Alloy preparation
Button ingots of the designed Zr alloys (Zr–14Nb–5Ta–1Mo and Zr–14Nb–10Ta–1Mo, mass%) were prepared by arc melting from commercially pure Zr (99.8%), Nb (99.8%), Ta (99.95%), and Mo (99.95%) metals in an Ar atmosphere on the water-cooled copper hearth of an arc-melting furnace. Each ingot was flipped and re-melted a minimum of ten times to homogenize the alloy composition. The surfaces of the produced ingots were analyzed at five different points via X-ray fluorescence spectroscopy (XGT-1000WR, HORIBA, Ltd.) using the standard Zr–10.1Nb–10.2Mo–9.42Ta–1.22Pt–1Pd–0.04Fe alloy as a reference. As a result, homogeneous button ingots were confirmed and subsequently cast to rods with diameters of 3 mm, 5 mm, and 8 mm under an Ar atmosphere using a vacuum centrifugal casting machine.
2.3 Structural characterization
Disks with thicknesses of 1 mm were obtained by cutting the rods with the 5 mm diameters, after which they were metallographically ground and polished with suspensions containing 9 µm diamond and 0.04 µm SiO2 particles. The polished disks were ultrasonically rinsed two times in acetone and once in ethanol for 600 s. X-ray diffraction (XRD) analysis was performed using a D8 ADVANCE X-ray diffractometer (Bruker Corp.) with Cu-Kα radiation at a voltage of 40 kV and current of 40 mA. For microstructure observation, the specimens were ground with SiC papers with grit numbers of up to #800 and polished with 9 µm diamond suspension and 0.04 µm SiO2 particles suspension to a mirror like surface. Then, disks were subjected to electrochemical polishing in a solution containing 8 vol% perchloric acid, 57 vol% methanol, and 35 vol% butanol at 20–35 V. Laser Microscope (LEXT OLS4000, Olympus Corp.) was used.
2.4 Evaluation of mechanical properties
2.4.1 Vickers hardness
Disks with thicknesses of 1 mm were cut from the top, middle, and bottom parts of the rod with the 5 mm diameter. They were then metallographically ground and polished with suspensions containing 9 µm diamond and 0.04 µm SiO2 particles. Vickers hardness was measured at 12 different points of the tested specimen for 15 s using a hardness testing machine (HMV-1, SHIMADZU Corp.) with a load of 2.942 N. The maximum and minimum measurement values were excluded, and the obtained data were statistically analyzed by performing a t-test.
2.4.2 Young’s modulus
Rod specimens with diameters of 3 mm and lengths of 52 mm were cast as described above. Their Young’s moduli were evaluated using a free resonance vibration method (JE-RT3, Nippon Techono-Plus Co., Ltd.). Each specimen was tested four times in the upside-down and laterally reversed positions.
2.4.3 Tensile testing
Rods with diameters of 5 mm and lengths of 58 mm were cast as described above. From these rods, tensile specimens with gauge lengths of 15 mm and diameters of 3 mm (ISO 6871-1:1994) were prepared using a lathe. The surface roughness of the specimen is ∼10 µm. Each tensile test was performed on a tensile testing machine (Autograph AG-2000B, SHIMADZU Corp.) at an initial strain rate of 1.3 × 10⁻³ s−1. Five different specimens for Zr–14Nb–5Ta–1Mo alloy and four different specimens for Zr–14Nb–10Ta–1Mo alloy were tested. After tensile testing, the fractured surface was observed by scanning electron microscopy (SEM, S-3400NX, HITACHI, Ltd.).
2.5 Magnetic susceptibility measurements
Rod specimens with diameters of 3 mm and lengths of 25 mm were cut from the as-cast rods with diameters of 3 mm. Their magnetic susceptibilities were measured using a magnetic balance (MSB-MKI, Sherwood Scientific Ltd.) under a magnetic field of 0.35 T at room temperature. The direction of the applied magnetic field was normal to the longitudinal direction of the rod. A minimum of three measurements were conducted for each specimen in the original position, and three additional measurements were performed in the upside-down position.
3. Results and Discussions
3.1 Alloy composition
The $\skew3\bar{B}_{\text{o}}$–$\skew3\bar{M}_{\text{d}}$ map constructed for Zr alloys is shown in Fig. 2. Here, the direction of each vector represents the crystal phase of the alloy, the vector length characterizes the stability of the phase, and the total sum of the vectors corresponding to various elements represents the phase of the multicomponent alloy. The vector lengths shown in Fig. 2 correspond to Zr alloys containing 10 mass% of each element. According to this diagram, the β alloy region is in the upper-left corner. In this study, elements with vectors that were directed toward the upper-left corner on the $\skew3\bar{B}_{\text{o}}$–$\skew3\bar{M}_{\text{d}}$ map, as well as nontoxicity, were essential selection criteria applied to Nb, Mo, and Ta alloying elements. Their contributions to the stability of the β-phase can be ranked in the following order from greatest to least: Mo, Nb and Ta (Fig. 2). Conversely, according to the results of previous studies,6,7) the best balance between good mechanical properties and low magnetic susceptibility was observed in Zr–14Nb and Zr–1Mo alloys. The as-cast Zr–14Nb alloy is a metastable β-type Zr alloy including ω-phase and unknown phase. The small volumes of ω-phase can decrease magnetic susceptibility and increase strength, while large volumes of ω-phase decrease elongation to fracture and increase Young’s modulus. Therefore, a little more stabilization of β-phase is required for Zr–14Nb alloy in order to decrease Young’s modulus. The content of Mo should be small because Mo has a higher stability of the β-phase. When Ta is used, its relatively large contents are required to stabilize the β-phase, while the ω-phase is formed at a Ta concentration of 15 mass% when cooling after casting. Therefore, the Ta content in a designed alloy can be less than 15 mass%. Additionally, increasing the concentration of Ta decreases Young’s modulus and magnetic susceptibility and increases the hardness of the alloy.11–13) After taking these parameters into account, the optimal compositions of the Zr alloys determined in this study were Zr–14Nb–5Ta–1Mo and Zr–14Nb–10Ta–1Mo alloys (mass%). The values of $\skew3\bar{M}_{\text{d}}$ and $\skew3\bar{B}_{\text{o}}$ calculated for both alloys and the as-cast Zr alloys, as well as their phase constitutions shown in our previous study,6,7,20) are shown in Fig. 3. Both designed alloys were located in the upper-left corner on the $\skew3\bar{B}_{\text{o}}$–$\skew3\bar{M}_{\text{d}}$ map. In our previous study, Zr alloys consisting mainly of β-phase were located in the β alloy region, and the Zr–1Mo and Zr–3Nb alloys consisting of α′-phase were located in the α + β alloy region. The Zr alloys located in the β alloy region close to the α + β alloy region, such as Zr–3Mo, Zr–7.5Mo, and Zr–12Nb, contained relatively large volumes of the ω–phase, which increased their brittleness. The Zr–14Nb–5Ta–1Mo and Zr–14Nb–10Ta–1Mo alloys have higher $\skew3\bar{B}_{\text{o}}$ values and lower $\skew3\bar{M}_{\text{d}}$ values than those of the previous three alloys. Additionally, they were close to the positions of the Zr–22Nb and Zr–24Nb alloys containing only the β-phase and that of the Zr–18Nb and Zr–20Nb alloys composed of the β-phase and a small volume fraction of the ω-phase. Therefore, it was expected that the designed Zr–14Nb–5Ta–1Mo and Zr–14Nb–10Ta–1Mo alloys would represent β-type Zr alloys with or without small volume fractions of the ω-phase.

The laser microscopy images of these alloys are shown in Fig. 4; the images indicated that their microstructures were similar. Their microstructures had equiaxed grains with an acicular structure. These microstructures were similar to that of the as-cast Zr–16Nb alloy.6) The XRD patterns obtained for the Zr–14Nb–5Ta–1Mo and Zr–14Nb–10Ta–1Mo alloys are shown in Fig. 5. Both alloys contained mainly the β-phase and a small volume fraction of the ω-phase. A small peak that originated from an unknown phase was also found at approximately 34°. This unknown phase has been reported by R. Kondo et al. in Zr–(12, 14, 16, 18)Nb alloys6) and by X.L. Zhao et al. in Zr–(13, 15, 17)Nb alloys.19) According to the XRD results and laser microscopy images, the designed alloys of Zr–14Nb–5Ta–1Mo and Zr–14Nb–10Ta–1Mo consisted of equiaxed β-grains with an acicular structure and a small amount of the ω-phase. The measured β-grain sizes were 55 ± 5 µm in the Zr–14Nb–5Ta–1Mo alloy and 56 ± 4 µm in the Zr–14Nb–10Ta–1Mo alloy.

The Vickers microhardness obtained for the top, middle, and bottom parts of the Zr–14Nb–5Ta–1Mo alloy rods were 207, 210, and 208 HV, respectively, as compared to those of 219, 217, and 218 HV for the Zr–14Nb–10Ta–1Mo alloy. No differences in hardness were observed at different positions of the cast rod, indicating that the cooling rate was relatively uniform along the rod length. The average hardness of the Zr–14Nb–10Ta–1Mo alloy was 218 HV, which slightly exceeded that of 208 HV for the Zr–14Nb–5Ta–1Mo alloy. It was considered that this increase in hardness was due to solid solution hardening. The mechanical properties and magnetic susceptibilities of the designed Zr–14Nb–5Ta–1Mo and Zr–14Nb–10Ta–1Mo alloys are summarized in Table 1. For comparison, the table contains data obtained for pure Zr, as well as for Zr–14Nb, Zr–1Mo, Ti–6Al–4V ELI, Ti–6Al–7Nb, and Co–28Cr–6Mo alloys. The hardness values of both Zr–Nb–Ta–Mo system alloys were larger than that of pure Zr (129 HV) and smaller than that of Zr–14Nb alloy (275 HV), which could be attributed to the differences in their phase compositions, volume fractions, and morphologies.6)

Table 1 Mechanical properties and magnetic susceptibilities of pure Zr, Zr–14Nb–5Ta–1Mo, Zr–14Nb–10Ta–1Mo, Zr–14Nb, Zr–1Mo, and conventional medical alloys.
As shown in Table 1, both alloys showed lower Young’s moduli compared with that of pure Zr. Young’s modulus (E) of the Zr–14Nb–10Ta–1Mo alloy was slightly smaller than that of the Zr–14Nb–5Ta–1Mo alloy. This was consistent with the XRD results because both alloys were stabilized to the β-phase and had low Young’s modulus by adding the β-stabilized elements of Nb, Ta, and Mo to Zr. Young’s modulus depended on the phase constitution and its value, for the β-phase was smaller than that of the ω-phase. Therefore, the Zr–14Nb–10Ta–1Mo alloy had a larger amount of the β-phase than the Zr–14Nb–5Ta–1Mo alloy. Young’s moduli of the Zr–14Nb–5Ta–1Mo and Zr–14Nb–10Ta–1Mo alloys designed in this study were much smaller than those of pure Zr, Zr–14Nb alloy, and conventional Ti alloys, due to the greater fraction of the β-phase containing stabilizing elements. The obtained results indicated that Zr alloys can possess low Young’s moduli.
3.3.3 Tensile properties
The stress-strain curves recorded for the Zr–14Nb–5Ta–1Mo and Zr–14Nb–10Ta–1Mo alloys are shown in Fig. 6. From the obtained data, the average values of ultimate tensile strength (UTS), 0.2% proof stress (σ0.2), and elongation to fracture (l) were estimated (Table 1). The UTS for the Zr–14Nb–5Ta–1Mo alloy was similar to that of the Zr–14Nb–10Ta–1Mo alloy.

As shown in Table 1, the UTS of both alloys were smaller than those of the Zr–1Mo, Ti, and Co–28Cr–6Mo alloys; larger than that of pure Zr; and similar to that of the Zr–14Nb alloy. The values of 0.2% proof stress exceeded those of pure Zr and the Zr–14Nb and Co–28Cr–6Mo alloys but were smaller than the magnitudes obtained for other alloys. The ratios of the 0.2% proof stress to UTS calculated for the Zr–14Nb–5Ta–1Mo and Zr–14Nb–10Ta–1Mo alloys were 0.947 and 0.937, respectively, which were almost identical to that of the Ti–6Al–4V ELI alloy (0.924) and exceeded the magnitudes obtained for the other alloys. Therefore, the 0.2% proof stress values of the designed Zr–14Nb–5Ta–1Mo and Zr–14Nb–10Ta–1Mo alloys were relatively large.
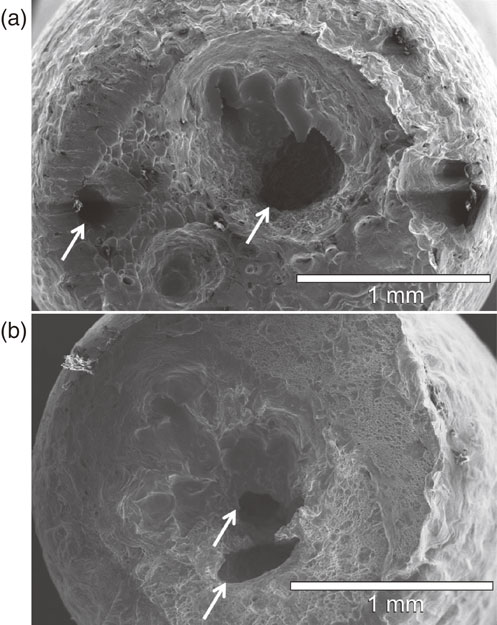
In contrast, the elongation to fracture of the Zr–14Nb–5Ta–1Mo alloy was almost equal to those of pure Zr and the Ti–6Al–4V ELI alloy and larger than those of the Zr–14Nb, Zr–1Mo, Ti–6Al–7Nb, and Co–28Cr–6Mo alloys. The value obtained for the Zr–14Nb–10Ta–1Mo alloy was almost identical to those of the Zr–14Nb and Co–28Cr–6Mo alloys, larger than the magnitudes determined for the Zr–1Mo and Ti–6Al–7Nb alloys, and smaller than those of pure Zr and the Ti–6Al–4V ELI alloy. The standard deviation of the elongation to fracture was relatively large. The SEM image of the fractured surface of the Zr–14Nb–5Ta–1Mo alloy obtained after tensile testing is shown in Fig. 7. It contained multiple dimples, which indicated that the fracture was ductile in nature. Conversely, the fractured surfaces of the Zr–14Nb–5Ta–1Mo and Zr–14Nb–10Ta–1Mo alloys exhibited many casting defects, which decreased the elongation to fracture and caused large variations in tensile strength,14) as was observed for the alloys listed in Table 1. Therefore, the decrease in UTS with increasing Ta content was not consistent with the trends observed for hardness. Possible procedures to suppress the formation of defects include performing a rolling or hot isostatic pressing procedure after casting.
The mass magnetic susceptibilities (χg) of the Zr–14Nb–5Ta–1Mo and Zr–14Nb–10Ta–1Mo alloys are listed in Table 1. It shows that their magnitudes decreased slightly with increasing Ta content. The value of the mass magnetic susceptibility of Ta was χg = 10.7 × 10⁻⁹ m3 kg−1, which was lower than the value of χg = 16.8 × 10⁻⁹ m3 kg−1 obtained for Zr,15) indicating that increasing Ta content decreases the magnetic susceptibility of Zr–Ta alloys.11,12) It is well known that magnetic susceptibility depends on the phase composition and volume fractions of the constituent phases.7) The stability of the β-phase increased, as indicated by the XRD results, and the microstructure and phase constitution between the Zr–14Nb–5Ta–1Mo and Zr–14Nb–10Ta–1Mo alloys were similar to those of the Zr–14Nb alloy. Thus, the magnetic susceptibility of the studied alloys was almost equal to the value of the Zr–14Nb alloy. Therefore, it was concluded that the addition of alloying elements did not affect the magnetic susceptibility of Zr alloys. As expected, their values were much smaller than the magnitudes obtained for pure Ti and the Co–28Cr–6Mo alloy.
4. Conclusions
In this study, Zr–14Nb–5Ta–1Mo and Zr–14Nb–10Ta–1Mo alloys were designed using the d-electron alloy method to achieve a new β-type Zr alloy with high strength, low magnetic susceptibility, and low Young’s modulus followed by melting and casting. The results of their morphological analyses revealed that both alloys contained the equiaxed grains of β-phase and a small volume fraction of the ω-phase. The UTS of the studied alloys showed more than 700 MPa. Young’s modulus and magnetic susceptibility were low. These properties of the designed alloys were similar to Zr–14Nb alloy but the Young’s modulus was lower than Zr–14Nb alloy. Both alloys demonstrated a good balance of mechanical properties with a low Young’s modulus and magnetic susceptibility.
Acknowledgments
This study was supported by the Grant-in-Aid for Scientific Research (B) program (Grant No. 19H04464) funded by the Japan Society for the Promotion of Science (JSPS) and by the Creation of Life Innovation Materials for Interdisciplinary and International Researcher Development (iLIM) project funded by the Ministry of Education, Culture, Sports, Science and Technology (MEXT). Additionally, this research is based on the Cooperative Research Project of Research Center for Biomedical Engineering.
REFERENCES
- 1) H. Imai, Y. Tanaka, N. Nomura, Y. Tsutsumi, H. Doi, Z. Kanno, K. Ohno, T. Ono and T. Hanawa: Acta Biomater. 9 (2013) 8433–8439.
- 2) F.Y. Zhou, B.L. Wang, K.J. Qiu, L. Li, J.P. Lin, H.F. Li and Y.F. Zheng: J. Biomed. Mater. Res. Part B. 101 (2013) 237–246.
- 3) R. Kondo, R. Shimizu, N. Nomura, H. Doi, Suyalatu, Y. Tsutsumi, K. Mitsuishi, M. Shimojo, K. Noda and T. Hanawa: Acta Biomater. 9 (2013) 5795–5801.
- 4) H.L. Yang, S. Kano, Y. Matsukawa, Y.F. Li, J.J. Shen, F. Li, Z.S. Zhao, Y. Satoh and H. Abe: Mater. Des. 104 (2016) 355–364.
- 5) Y. Kajima, A. Takaichi, T. Yasue, H. Doi, H. Takahashi, T. Hanawa and N. Wakabayashi: J. Mech. Behav. Biomed. Mater. 53 (2016) 131–141.
- 6) R. Kondo, N. Nomura, Suyalatu, Y. Tsutsumi, H. Doi and T. Hanawa: Acta Biomater. 7 (2011) 4278–4284.
- 7) Suyalatu, N. Nomura, K. Oya, Y. Tanaka, R. Kondo, H. Doi, Y. Tsutsumi and T. Hanawa: Acta Biomater. 6 (2010) 1033–1038.
- 8) M. Morinaga, M. Kato, T. Kamimura, M. Fukumoto, I. Hanada and K. Kudo: Theoretical design of β-type titanium alloys, ed. by F.H. Froes and I.L. Caplan, (Titanium ’92, Science and Technology, Proc. 7th Int. Conf. on Titanium, San Diego, CA, USA, June 29-July 2, 1992) pp. 276–283.
- 9) D. Kuroda, M. Niinomi, M. Morinaga, Y. Kato and T. Yashiro: Mater. Sci. Eng. A 243 (1998) 244–249.
- 10) H. Shibutani, M. Morinaga and K. Kikuchi: J. At. Energy Soc. Jpn. 40 (1998) 70–78 (in Japanese).
- 11) A. Takaku, Y. Tanaka, S. Takahashi, N. Nomura and T. Hanawa: Collected Abstracts of the 153th Meeting of Japan Institute of Metals, (2013) p. 119 (in Japanese).
- 12) Y. Tanaka, A. Takaku, S. Takahashi, N. Nomura and T. Hanawa: Collected Abstracts of the 153th Meeting of Japan Institute of Metals, (2013) p. 120 (in Japanese).
- 13) A. Takaku, Y. Tanaka, R. Kondo, N. Nomura, Y. Tsutsumi and T. Hanawa: Adv. Mater. Process. Technol. 2 (2016) 606–614.
- 14) M. Okayasu and H. Sakai: Metall. Mater. Trans. A 46 (2015) 5418–5430.
- 15) W. Martienssen: “2.1. The Elements,” Springer Handbook of Condensed Matter and Materials Data, ed. by W. Martienssen and H. Warlimont, (Springer: Berlin Heidelberg, Germany, 2005) pp. 45–158, ISBN: 978-3-540-44376-2.
- 16) Suyalatu, R. Kondo, Y. Tsutsumi, H. Doi, N. Nomura and T. Hanawa: Acta Biomater. 7 (2011) 4259–4266.
- 17) ASTM F75-01: Standard Specification for Cobalt-28 Chromium-6 Molybdenum Alloy Castings and Casting Alloy for Surgical Implants (UNSR30075).
- 18) ASTM F136-02a: Standard Specification for Wrought Titanium–6Aluminum–4Vanadium ELI (Extra Low Interstitial) Alloy for Surgical Implant Applications (UNSR56401).
- 19) X.L. Zhao, L. Li, M. Niinomi, M. Nakai, D.L. Zhang and C. Suryanarayana: Acta Biomater. 62 (2017) 372–384.
- 20) R. Kondo, Suyalatu, Y. Tsutsumi, H. Doi, N. Nomura and T. Hanawa: Mater. Sci. Eng. C 31 (2011) 900–905.


