Abstract
The kinetics for the isothermal carburization of pure iron (Fe) at a temperature of 1073 K (800°C) for times between 1.8 ks (0.5 h) and 32.4 ks (9 h) was experimentally observed by Togashi and Nishizawa. According to the observation, the austenite (γ) phase with the face-centered cubic (fcc) structure is produced on the Fe specimen of the ferrite (α) phase with the body-centered cubic (bcc) structure, and gradually grows into the α phase. The carbon (C) concentration in the γ phase at the moving γ/α interface is greater than that of the γ/(γ + α) phase boundary in a phase diagram of the binary Fe–C system. Although the former one gradually approaches to the latter one with increasing annealing time, their difference hardly vanishes even at the longest annealing time of 32.4 ks (9 h). The molar Gibbs energy of the γ phase was described by a two-sublattice model to evaluate the chemical driving force working at the moving γ/α interface. The evaluation provides that the chemical driving force monotonically decreases with increasing annealing time. This annealing time dependence of the chemical driving was used to calculate the migration distance of the γ/α interface as a function of the annealing time. The observation for the interface migration was satisfactorily reproduced by the calculation. According to the calculation, the migration of the γ/α interface is controlled by the interface reaction at the moving interface in the early stages, but it is governed mainly by the volume diffusion of C across the γ phase and partially by the interface reaction in the late stages. The experimental annealing times mostly belong to the transition stages between the rate-controlling processes of the interface reaction and the volume diffusion.
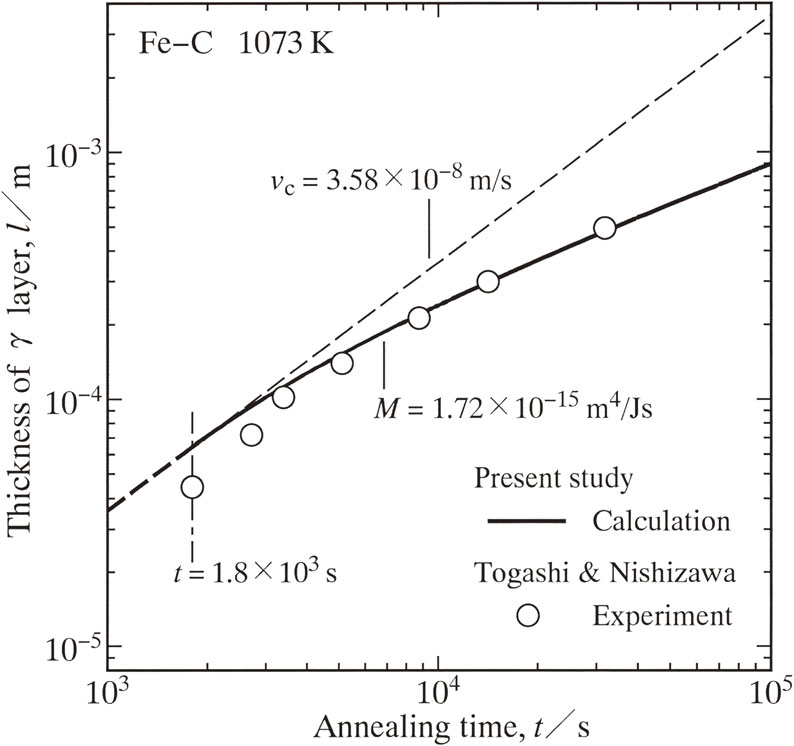
Fig. 5 The thickness
l of the γ layer versus the annealing time
t. Open circles show the observation reported by Togashi and Nishizawa,
7) a solid curve and a dashed line indicate the calculation from eq. (11), and a thin dashed line represents the extrapolation of the dashed line in the early stages.
Fullsize Image

