Abstract
Rolling contact fatigue failure is one of the main fatigue damages in railway wheels caused by cyclic rolling contact with rails. This fatigue failure is caused by internal defects such as nonmetallic inclusions or voids and may occur in heavy haul freight car wheels. The subsurface crack propagation behaviors caused by the internal defects are evaluated by twin-disc-type rolling contact fatigue tests using test specimens with artificial defects. Finite element analyses involving simulated rolling contact fatigue tests are also conducted. The subsurface cracks are more likely to propagate in the test specimens with larger artificial defects. Moreover, cracks initiating from the trailing side of the defects propagate faster than those from the leading side. Shear mode equivalent stress intensity factors obtained from the finite element analyses correspond well to the results of the rolling contact fatigue tests. The test specimen models with larger defects have larger equivalent stress intensity factor ranges than the test specimen models with smaller defects in both the leading and trailing sides. The results of the finite element analyses also suggest that the crack propagations are affected by the deformation of the artificial defects, which leads to higher resistance to crack propagation in test specimens with smaller internal defects.
This Paper was Originally Published in Japanese in J. Soc. Mater. Sci., Japan 68 (2019) 904–909.
1. Introduction
Rolling contact fatigue (RCF) is one of the main types of fatigue that damage railway wheels owing to the cyclic rolling contact with rails. Fatigue damage calls for wheel replacements because the RCF occurs at the tread surface which is in contact with the rails.1–5) The damages by RCF are more likely to occur particularly in heavy haul freight cars that transport iron ore or coal. There are two types of crack initiation positions in RCF: the contact surface and the subsurface. In the subsurface crack initiation type, the fatigue crack may initiate and propagate from internal defects such as nonmetallic inclusions or voids that exist below the wheel tread surface. The fatigue strength of the materials is considerably affected by the internal defects. It is well known that the fatigue strength decreases with an increase in the internal defect size even in RCF affected by shear stress.6–8) Therefore, studies9–12) on RCF cracks initiated from the internal defects of railway wheels have been conducted. The effect of the internal defects has been studied from various points of view. However, most studies have discussed fatigue limits, i.e. the limit of crack initiations or the nonpropagation limit of micro cracks. The propagation behaviors of subsurface cracks after initiation from the internal defects have not been fully studied.
On the other hand, there are several studies13–15) on the case of bearing steel, which have evaluated RCF crack propagation behaviors from internal defects. The crack propagation path and the effect of the shapes of the internal defects have been studied. However, subsurface cracks from the internal defects in railway wheels are likely to initiate from deeper areas than those in bearings because the product size and applied loads are different for the railway wheels and bearings. Thus, it is necessary to assess the effect of internal defects on subsurface crack propagations in railway wheels in reference to the service conditions. In this study, RCF tests using test specimens of railway wheel steel with artificial defects and FE analyses simulating the RCF test were conducted. Subsequently, the subsurface crack propagation properties from the internal defects were evaluated based on fracture mechanics.
2. Rolling Contact Fatigue Test
2.1 Material and test specimen
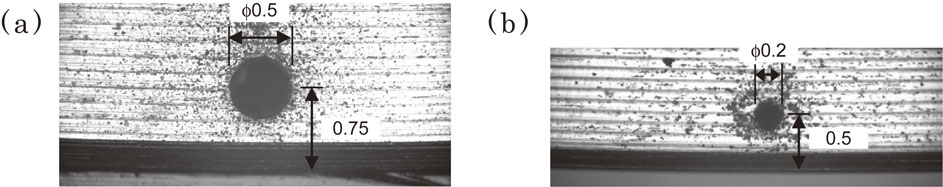
The test material was the Class-C wheel steel specified in the AAR (Association of American Railroads) standard for freight cars.16) This wheel steel is 0.7% C steel with pearlite structure, and HV330 Vickers hardness. The configurations of the test specimens are illustrated in Fig. 1. A set of wheel and rail test specimens was used for one test. The diameter of the wheel test specimen was 120 mm; they were taken from the subsurface area of the actual wheel rim. The diameters of the rail test specimens were between 184 and 195 mm, and the specimens were obtained from quenched and tempered forged material with the same chemical compositions as the wheel steel. Small holes were machined by electrical discharge machining from one face side to the center of the thickness to simulate the internal defects in the wheel test specimens. Examples of the photos of the micro holes are shown in Fig. 2. The diameters of the holes are 0.2 mm and 0.5 mm, and the positions of the holes (distance from the contact surface) are determined in reference to the maximum shear stress positions calculated by the Hertzian theory.

A twin disc type RCF testing machine was used for the tests. The slip ratio was 0.0%, i.e., the rotating speeds of the wheel and rail test specimen were equivalent. The wheel test specimens were followers and the rail test specimens were driven. The rotating speed of the wheel test specimens was 6.283 m/s (1000 rpm). The tests were conducted at ambient temperature in atmosphere with no lubrication conditions. The vibration acceleration of the testing machine, vertical load and torque of the axle with the wheel test specimens were measured during the tests. The acceleration vibration was obtained using an accelerometer on the bearing case of the axle with the wheel test specimens. The average Hertzian stresses were determined by the measured vertical loads, and the average friction coefficients were calculated from the vertical loads and torques. The RCF lives were defined as the number of cycles exceeding the vibration acceleration of 1.5 G when flaking at the contact surface occurred in the tests. The number of cycles to terminate the tests was 107 cycles.
3. Test Results
3.1 Fatigue life
Figure 3 shows the relationship between the Hertzian stress and RCF life determined by vibration acceleration. The RCF lives increase as the Hertzian stress reduces. The fatigue strength is higher in the test specimens with smaller holes. Figure 4 demonstrates the contact surface of the wheel test specimen after the tests, which has the small hole below the surface. The vibration acceleration exceeded limitation in this test. RCF damages are clearly observed at the contact surface. However, RCF damages were not observed at the contact surface of some wheel test specimens, although the vibration acceleration increased in the specimens. In these wheel test specimens, the vibration acceleration is considered to have increased because the contact surface shape may change slightly owing to the fatigue damages at the subsurface area.
3.2 Fatigue crack propagation behaviors
To evaluate the fatigue damages at the subsurface area, the circumferential cross sections containing the small holes were observed for the tested wheel test specimens. Figure 5 shows examples of the fatigue cracks from the small holes observed by the optical microscope; it also shows whether the vibration acceleration exceeded 1.5 G within 107 cycles. The fatigue cracks initiated from the two edges of the small holes are in the trailing and leading sides of the contact loads, respectively. The fatigue cracks on the trailing side were longer than on the leading side. Moreover, the cracks also initiated in the wheel test specimens that ran out at 107 cycles. These cracks are probably nonpropagating because they are comparatively short.

The crack propagation rates of the wheel test specimens with small holes having diameters of 0.2 mm and 0.5 mm were compared to evaluate the relationship between the fatigue crack propagation properties and defect size. Figure 6 shows the relationship between the average crack propagation rates (final crack length/number of cycles) and the Hertzian stresses. The crack length is defined as the distance from the crack tips to the hole edges of the trailing and leading side. The crack propagation rates in this figure are not equivalent to the actual crack propagation rates because these results include the crack initiation life. However, the cracks at the same number of cycles in the smaller defects are likely to be shorter. The leading side has shorter cracks than the trailing side. The plots enclosed by a dashed line in the figure show the same average crack propagation rate independent of the Hertzian stress. The cracks are considered to initiate relatively early cycles and stop propagation because all these plots represent the results of the wheel test specimens that run out at 107 cycles. The average crack propagation rates for the plots outside the dashed line are relatively high, and the cracks probably propagate during the tests. Therefore, the Hertzian stresses corresponding to the threshold of the crack propagation are considered to be stresses between the plots inside and outside the area enclosed by the dashed line.

Table 1 lists the Hertzian stresses of the crack propagation threshold with each defect size for the wheel test specimen. These threshold stresses are obtained from the average values between the Hertzian stress for the nonpropagation cracks and the minimum Hertzian stress for crack propagation. The Hertzian stress threshold is higher for the wheel test specimen with the smaller defects. The leading side of the contact loads has a higher Hertzian stress threshold than the trailing side in the small hole with a diameter of 0.5 mm.

Table 1 Maximum Hertzian stress for nonpropagating crack.
4. Assessment of Crack Propagation Behaviors Based on Fracture Mechanics
4.1 FE-analysis model
FE-analyses were carried out to calculate the stress intensity factor of the crack tip for the assessment of crack propagation behaviors observed in RCF tests in the previous chapter. FE-analysis models for the RCF tests are illustrated in Fig. 7. The models consisted two-dimensional plane strain elements. The shape of the wheel test specimen model was a plane, and that of the rail test specimen model was a circle. The small holes were introduced into the wheel test specimen model similarly as in the RCF test specimens. The holes in the FE-analyses were modeled as through holes because the two-dimensional models were applied although the small holes in the RCF test specimens were non through holes with certain depth to the center of the thickness. The diameter of the rail test specimen model was 75 mm with the same Hertzian stress and contact width as the RCF test specimens. The cracks were introduced using double nodes, and the elements near the crack tip were divided into circular shapes. The stress intensity factors were calculated by the contour integral method with these elements. The vertical load, displacement of the rotation and horizontal movement was applied to the inner diameter of the rail test specimen model to simulate rolling contact.

Table 2 shows the crack length, diameter, and positions of the small holes modeled in the analyses. The positions of the hole shown in the table were defined as the distance between the hole center and contact surface as shown in Fig. 7(b). In this case, the wheel test specimens that run out at 107 cycles in the RCF tests were modeled. These cracks were regarded as nonpropagation cracks in the tests except for the trailing side of Case 4.

Table 2 Dimensions of holes and cracks in FE model.
The rolling contact was simulated by the following procedure in the analyses. (1) A vertical load corresponding to the Hertzian stress was applied. (2) The prescribed displacements of the rotation and horizontal movement were applied to the rail test specimen model to roll on the wheel test specimen model while maintaining the vertical load. The total movement was 15 mm in this step. (3) The rail test specimen model was moved away from the wheel test specimen model to the initial position. For procedure 1 to 3 to consider the effects of the residual stress, five cycles of the elastoplastic analysis were performed. The obtained residual stresses were considered as the initial stress for the next elastic analysis. The five cycles were determined to stabilize the residual stresses. The stress intensity factor of each crack was calculated from the elastic analysis results. The FE analysis was performed using the ABAQUS Ver. 6.12 commercial software.
The cyclic S-S curve of the wheel steel was given by the nonlinear kinematic hardening law of the wheel test specimen model.
| \begin{equation}
\sigma_{eq} = \sigma_{0} + \frac{C}{\gamma} \{ 1 - \exp (-\gamma \varepsilon_{peq}) \}
\end{equation}
| (1) |
σ
eq: Mises equivalent stress (MPa), σ
0: elastic limit (440 MPa), C: the initial kinematic hardening coefficient (140 GPa), γ: the reduction ratio of the kinematic hardening coefficient in response to the increase in plastic deformation (260.0), and ε
pq: equivalent plastic strain. The rail test specimen model was calculated as an elastic material. The Young's modulus was 206 GPa and Poisson’s ratio was 0.3. The applied vertical loads in the analyses were the same as those in the RCF tests. The slip ratio was 0.25%, obtained from the revolutions of the test specimens measured in the RCF tests, which was not 0.0% of the test condition. The friction coefficient between the contact surface of the wheel and rail test specimen models was 0.04, which was equivalent to the tangential force coefficient measured in the RCF tests. The friction coefficient between the crack surfaces was 0.3. It is known that the mode II stress intensity factor
KII decreases when the friction coefficient of the crack surface is large and
KII increases when the friction coefficient is small. A friction coefficient of 0.3 was applied because it had the best correspondence between the RCF test and FE-analysis results, as will be described later.
4.3 FE-analysis results
The variation in the stress intensity factors with the rolling contact for Case 2 is shown in Fig. 8. The center of the defect is located at 7.5 mm in the horizontal axis of the figure. The stress intensity factors show mixed modes with mode I and mode II as shown in this figure. The mode I stress intensity factor KI is calculated to be compressive in this analysis. However, KI is regarded as 0 if it is negative because it is considered that the crack is closed when KI is negative. On the other hand, the mode II stress intensity factor KII varies greatly with the rolling contact. This indicates that the crack propagation direction is mainly in mode II, i.e., the shear mode. This was the same in other cases. The following equation has been proposed as the equivalent stress intensity factor KIIeq for the shear mode crack propagation under the mixed mode.17)
| \begin{equation}
K_{\textit{IIeq}} = \frac{1}{2}K_{I}\cos \frac{\theta_{\tau}}{2} \sin \theta_{\tau} + \frac{1}{2}{K_{\textit{II}}}\cos \frac{\theta_{\tau}}{2} (3\cos \theta_{\tau} - 1)
\end{equation}
| (2) |
θτ in the equation is the angle between the plane to calculate KIIeq and of the crack surface. The above equation is called the maximum shear stress criterion, and the equivalent stress intensity factor is obtained in the plane where the shear stress is maximized at the crack tip.
To evaluate the crack propagation properties, it is necessary to calculate the variation range of KIIeq with the cyclic rolling contact. The variation range, ΔKIIeq, is determined as the difference between the maximum and minimum values of KIIeq. However, KIIeq has different values depending on the angle because there is a nonproportional loading between KI and KII as shown in Fig. 8, i.e. the principal stress direction changes in one loading cycle. Therefore, the angle is determined with the assumption that ΔKIIeq is maximized. It is considered that ΔKIIeq corresponds to the driving force of the crack propagation and that the angle indicates the crack propagation direction. Subsequently, to verify the ΔKIIeq value calculated from the FE-analysis results, it is compared with the threshold of the crack propagation ΔKIIth of the material. Figure 9 presents the results of the comparison between ΔKIIeq and ΔKIIth for each crack. ΔKIIth was obtained from the mode II crack propagation tests developed by Murakami et al.18) and is shown with the variation range in the figure.19) Of all the cracks except for those on the trailing side of Case 4, which were determined as nonpropagating cracks, ΔKIIeq is less than or equal to ΔKIIth, and these cracks are predicted not to propagate. On the other hand, because ΔKIIeq of the trailing side of Case 4 is larger than ΔKIIth, the crack is expected to continue to propagate. These results correspond to the test results. This indicates that the analysis model is appropriate for the assessment of subsurface crack propagation properties from internal defects.

The crack propagation rate was higher in the test specimens with the larger internal defects even in the same loading conditions as those in the RCF tests. In this section, this crack propagation property is discussed using the FE-analysis results. Four additional models were applied with a constant 1.0-mm crack length of the trailing side and that of the leading side was varied. The crack length of the leading side had values of 0.0, 0.25, 0.5 and 1.0 mm in both models with the small hole diameters of 0.2 and 0.5 mm. The applied vertical load was 1760.7 N (the Hertzian stress 1300 MPa). Figure 10 shows the relationship between ΔKIIeq of the leading side and the leading side crack length. The crack length was defined as the distance from the center of the hole to the crack tip. ΔKIIeq was observed to increase with the larger internal defect. This indicates that the leading side cracks propagate faster when the internal defect size is larger.

Subsequently, the ΔKIIeq of the trailing side is evaluated in reference to the difference of the leading side crack length rather than the trailing side. Figure 11 shows ΔKIIeq of the trailing side with the different leading side crack lengths. ΔKIIeq of the trailing side does not depend on the defect size but on the leading side crack length or the total crack length. The leading side crack length is likely to be longer with the larger internal defect as shown in Fig. 10. Consequently, ΔKIIeq of the trailing side increases with the larger internal defect as well. This suggests that because ΔKIIeq increases with the larger internal defect, the cracks are more likely to propagate with the larger internal defect in both the leading and trailing side.

The difference in crack propagation behaviors between the internal defect sizes is caused by the deformation of the defects. The deformations of the leading side crack tip are shown in Fig. 12. ΔKIIeq of the leading side increases with the larger internal defect because the shear deformation of the leading side also increases with the larger internal defect.
In this study, small holes are regarded as internal defects; however, the internal defects of actual wheels are mainly nonmetallic inclusions, except for cast steel wheels, which have voids as internal defects. To evaluate the crack propagation properties from the nonmetallic inclusions, it is necessary to study the effect of the shape and deformation properties of non-metallic inclusions in future work.
5. Conclusion
The crack propagation properties of a railway wheel steel caused by the internal defects on its subsurface were assessed by RCF tests with small artificial holes, and FE-analyses were conducted for the tests. Two kinds of artificial holes with 0.2 and 0.5 mm diameter were applied. The main results obtained are outlined below.
-
(1)
The subsurface cracks initiate and propagate in two positions of the leading and trailing side of the contact loads in the RCF tests. The average crack propagation rate obtained in the tests was lower for the smaller holes. The Hertzian stress of the threshold for the nonpropagation cracks was also considered to be higher for the smaller holes.
-
(2)
The shear mode equivalent stress intensity factor was calculated in consideration of the mixed mode from the FE-analysis results. The threshold of the shear mode crack propagation in the RCF tests predicted by the FE-analysis results corresponded well to that of the mode II crack propagation obtained from crack propagation tests.
-
(3)
From the results of FE-analysis, ΔKIIeq of the leading side was observed to increase with the larger internal defect. ΔKIIeq of the trailing side also increased with the larger internal defects because the crack length of the leading side is larger in the larger internal defect. This suggests that the subsurface cracks are more likely to propagate with larger internal defects for both the leading and trailing side. Therefore, higher cleanliness wheels, which have smaller internal defects, are superior to the propagation and initiation of subsurface cracks from internal defects.
REFERENCES
- 1) S.M. Cummings and D. Lauro: Proceedings of 2008 ASME Rail Transportation Division Fall Technical Conference, (2008).
- 2) L.M. Keer, M.D. Bryant and G.K. Haritos: J. Lubr. Technol. 104 (1982) 347–351.
- 3) H. Tournay, S. Cakdi, K. Jones and M. Archuleta: Proceedings of 10th International Conference on Contact Mechanics and Wear of Rail/Wheel Systems, (2015).
- 4) A. Ekberg, E. Kabo and H. Andersson: Fatigue Fract. Eng. Mater. Struct. 25 (2002) 899–909.
- 5) A. Ekberg and J. Marais: Proc. Inst. Mech. Eng., F J. Rail Rapid Transit 214 (2000) 45–54.
- 6) M. Endo and Y. Murakami: J. Eng. Mater. Technol. 109 (1987) 124–129.
- 7) Y. Murakami, K. Takahashi, M. Takada and T. Toriyama: Trans. Japan Soc. Mech. Eng., Ser. A 64 (1998) 271–277.
- 8) M. Endo: J. Soc. Mater. Sci., Japan 45 (1996) 16–20.
- 9) A. Ekberg, E. Kabo, J.C.O. Nielsen and R. Lundén: Int. J. Solids Struct. 44 (2007) 7975–7987.
- 10) D. Zeng, L. Lu, J. Zhang, X. Jin and M. Zhu: Proc. Inst. Mech. Eng., F J. Rail Rapid Transit 230 (2016) 544–553.
- 11) J. Sandström: Int. J. Fatigue 37 (2012) 146–152.
- 12) J. Sandström and J. de Maré: Wear 271 (2011) 143–147.
- 13) H. Komata, J. Yamabe, Y. Fukushima and S. Matsuoka: Trans. Japan Soc. Mech. Eng., Ser. A 78 (2012) 1250–1265.
- 14) T. Makino, Y. Neishi, D. Shiozawa, S. Kikuchi, S. Okada, K. Kajiwara and Y. Nakai: Int. J. Fatigue 92 (2016) 507–516.
- 15) Y. Nakai, D. Shiozawa, S. Kikuchi, T. Obama, H. Saito, T. Makino and Y. Neishi: Eng. Fract. Mech. 183 (2017) 180–189.
- 16) Association of American Railroads: AAR M–107/M–208 (2017).
- 17) K. Tanaka: Trans. Japan Soc. Mech. Eng., Ser. A 74 (2008) 786–795.
- 18) Y. Murakami, T. Fukuhara and S. Hamada: J. Soc. Mater. Sci., Japan 51 (2002) 918–925.
- 19) T. Yamamoto, M. Yamamoto, T. Makino and T. Fujimura: Proceedings of 14th International Wheelset Congress, (2004).