Original Articles
Dynamics of memory-guided choice behavior in Drosophila
2016 年 92 巻 8 号 p. 346-357
詳細
2016 年 92 巻 8 号 p. 346-357
Memory retrieval requires both accuracy and speed. Olfactory learning of the fruit fly Drosophila melanogaster serves as a powerful model system to identify molecular and neuronal substrates of memory and memory-guided behavior. The behavioral expression of olfactory memory has traditionally been tested as a conditioned odor response in a simple T-maze, which measures the result, but not the speed, of odor choice. Here, we developed multiplexed T-mazes that allow video recording of the choice behavior. Automatic fly counting in each arm of the maze visualizes choice dynamics. Using this setup, we show that the transient blockade of serotonergic neurons slows down the choice, while leaving the eventual choice intact. In contrast, activation of the same neurons impairs the eventual performance leaving the choice speed unchanged. Our new apparatus contributes to elucidating how the speed and the accuracy of memory retrieval are implemented in the fly brain.
The fruit fly Drosophila melanogaster exhibits remarkable behavioral plasticity and has been an excellent model system to study the principles of memory processing.1) Among those, olfactory conditioning has attracted a special attention.2),3) The olfactory conditioning apparatus was first introduced in the early 1970s,4) by modifying the countercurrent fractionation system originally used to measure the phototaxis.5) The field subsequently took a significant step forward with the development of a versatile apparatus introduced by Tully and Quinn.6) This apparatus is designed to accommodate both conditioning and test in the same machine. For conditioning, flies en masse receive electric shock punishment or sugar reward with an odor (CS+) in a constant airflow, and consecutively another odor (CS−) without the reinforcement. For testing, the flies are brought to the cross-point using a small elevator and allowed to choose one of the two odors in the T-maze. The performance of conditioned odor preference is measured based on the number of flies in the two arms at a given time point.
This widely-used setup has greatly contributed to the molecular and cellular mechanisms of olfactory memory.2),3) However, because it measures the choice behavior as a ‘snap shot’, the dynamics of choice cannot be directly visualized. Speed and accuracy of decision-making are closely related and one is often achieved at the cost of the other.7)–10) Therefore, to understand the neural mechanism that controls the trade-off between speed and accuracy, methodological advance that allows the measurement of the choice speed is essential.
To track the choice behavior, a single-fly assay has a great advantage with its simplicity. A previous study measured the conditioned odor choice of a single fly at several time points, and successfully demonstrated that different types of aversive memory are expressed with distinct dynamics.11) However the measurement required tedious work (n = ∼100 for each data point). Furthermore, the temporal resolution was limited (five different time points in 180 sec),11) making the system not suitable for a large-scale screening or detecting subtle differences.
Another group has developed a system in which the conditioned odor choice of a single fly can be monitored in a miniature T-maze — narrow transparent pipe,12) and identified essential genetic and neural substrates regulating the choice speed.13) However, the drawback is again that a huge number of measurements were required due to individual variability; sometimes exceeding n = 800 for a single group.13) Robustness of the assay by Tully and Quinn is based on the mass assay, which averages the stochasticity of the choice by individual flies.4) Therefore, measuring the choice speed of grouped flies would provide a great advantage.
Here, we present a new T-maze that can measure the dynamics of odor choice of groups of around 50 flies. The multiple mazes are video-recorded, and simple image processing can automatically visualize choice dynamics. Using this new system we demonstrate that serotonin neurons control the speed and the eventual result of the conditioned odor approach.
Flies were reared in a mass culture at 24 °C and 60% relative humidity, under a 12–12 hour light-dark cycle on a standard cornmeal-based food. Canton-S was used as the wild-type flies. For the dopamine blockade, males of w;;R58E02-GAL414) or w;;TH-GAL415) were crossed to females of w;;pJFRC-20XUAS-TTS-shibirets1-p1016) and the F1 progenies were used. For the serotonin manipulation, males of TrH-GAL417),18) flies were crossed to females of w;;UAS-shibirets1 (one copy of UAS-shibirets1 from the Preat laboratory) or w;UAS-dTrpA119) and the F1 progenies were used.
The new T-maze apparatus.This apparatus enables video-recording of the choice behavior of grouped flies. It consisted of three major parts: (1) Multiplexed T-mazes made of plexiglas; (2) Odor sources connected to both ends of each maze; (3) Vertically set cameras for video recording of the mazes from above (Fig. 1).

New setup for odor choice. (A) Schematics of the testing setup. Multiplexed transparent T-maze is placed on the pedestal with infrared LEDs (peak wavelength = 880 nm). Constant airflow (arrows) for odor delivery is created by a blower. The CMOS camera captures the shadows of flies, and captured images are directly saved in a computer. (B) Testing procedures. Flies are loaded into the elevator in the middle of the apparatus. After sliding the elevator the flies are allowed to choose one of the arms. Their choice behavior is filmed by cameras. (C) The testing setup. (D) Image processing. The background image is subtracted to highlight the flies, which can be automatically detected.
The T-mazes were laid horizontally on a plexiglas pedestal. The cross section of the tubes was made to be trapezoid so that a single camera can record multiple mazes without the vertical interference by the walls. The wall and the ceiling of the maze were covered with 100% and 10% Fluon® (Insect-a-Slip PTFE30; BioQuip Products), respectively, to constrain the flies on the bottom. A rubber O-ring was placed between the elevator and each arm, and the arm was pushed by screws to minimize air leak. A funnel was used to load flies into the T-maze. The air current was created and controlled by the blower (RG130/0800-3612; ebmpapst) and by adjusting the input voltage, respectively.
Odor cups, whose diameter is 30 mm, were used as an odor source. Octan-3-ol (Merck) or 4-methylcyclohexanol (Sigma-Aldrich) as the two odors were diluted to 1.2% and 2%, respectively, with paraffin oil (Sigma-Aldrich) and were placed in the cups. Each side had two odor cups, one of which contained the diluted odor and the other contained the solvent. These two cups were equally channeled to the four arms, which is the same configuration as the conditioning apparatus (compare Figs. 1A and 2A).

Automatic aversive conditioning apparatus. (A) Schematics of the setup. Four groups of flies can be automatically trained in parallel. Constant airflow (arrow) is created by the blower to deliver the odors. The three-way solenoid valves switch the flow paths between the odor and the solvent (air). The presentations of odors and shocks are regulated by the same computer. (B) The conditioning setup.
For video-recording, the setup was illuminated by 120 infrared LEDs (Peak wavelength = 880 nm; Osram 720-SFH487P; Mouser electronics) from below. The point light sources were diffused by a piece of paper attached on the pedestal. The LEDs were embedded in a square grid pattern at an interval of 20 mm on an integrated circuit board. The CMOS cameras (FFMV-03M2M; Point Grey; 640 × 480 pixels) captured the shadows of the flies with a frame rate of 1 frame/sec and a shutter speed of 33 ms. Captured images were immediately transferred using IEEE 1394a and saved in a computer.
Image processing and calculation of the performance.The number of the flies in each arm in every frame was automatically counted, and the memory performance was calculated in every frame.
Automatic counting of flies was performed by a custom-made macro in ImageJ.20) A background image without flies was subtracted from each image to highlight shadows of the flies (Fig. 1D). The ‘Find Maxima’ function was applied to detect and count the flies in each arm. The average error of automatic counting was less than 5%. The first frame to start the counting was defined by the disappearance of experimenter’s hand that slid the elevator.
Based on the number of flies, the performance index (PI) for each frame was calculated with the following formula and the PI of two reciprocally trained groups was averaged:21)
| \begin{equation*} {\mathit{PI} = \frac{(\# \textit{flies in the CS} + \textit{odor}) - (\# \textit{flies in the CS} - \textit{odor})}{(\# \textit{flies in the CS} + \textit{odor}) + (\# \textit{flies in the CS} - \textit{odor})}} \end{equation*} |
This apparatus automatically conditioned flies with an odor and electric shock punishment. Constantly aspirated shock tubes were connected downstream to the odor channels and the odor delivery was controlled by solenoid valves (Figs. 2A and 2B). The timing of the odor and shock delivery was controlled by the computer.
Four of the custom-made shock tubes were plugged to the device with the air-tight couplings (75KB IW26 DPX; Parker). The shock tubes were manufactured as follows:22) Two copper wires were alternately coiled in grooves on a Plexiglas stick. The stick was glued inside the tube and was scraped away so that the wires appear on the surface. The copper wires were electrically connected to the custom-made shock generator.
Three-way solenoid valves (MFH-3-3/4-S; FESTO) were placed between the shock tubes and the odor cups to switch the airflow between the odor and solvent cups. The same odor cups and blower as in testing apparatus (see above) were used as odor sources and to create airflow, respectively.
To automatically control the delivery of the odor and the electric shocks, we constructed a program using Labview 2011 (National Instruments). The schedule to deliver the stimuli can be preset prior to the conditioning. The signals transmitted from the computer were electrically amplified to control the solenoid valves and the shock generator.
Conditioning procedures.Flies underwent standard differential conditioning with electric shock punishment or sugar reward, and two odors (Octan-3-ol and 4-Methylcylohexanol) unless otherwise described. A group of about 50 flies received one odor (CS+) with 12 pulses of electric shocks (90 V, 1.5-sec pulse every 5 sec) or dried filter paper having absorbed 2 M sucrose solution (Sigma-Aldrich). Subsequently, they received another odor (CS−) for 1 min, but without the reinforcement. Octan-3-ol and 4-Methylcylohexanol were reciprocally presented as CS+ and CS− and the performance was averaged. To cancel the effect of the order of the reinforcement,6) the first odor was paired with the reinforcement in half of the experiments and the second odor was paired with in the other half. Conditioning was performed in a dim red light. For aversive conditioning, presentation of the odors and electric shocks was controlled automatically with the setup described above. For appetitive conditioning, the odor and the sugar were presented manually using an odor cup with a diameter of 14 mm for each conditioning tube. After conditioning, flies were kept in a vial with moistened filter paper. Prior to appetitive conditioning flies were starved so that the mortality rate reaches 5–15%.
Testing procedures.Conditioned odor choice behavior of flies was video-recorded and analyzed. Flies were first loaded into the elevator with a funnel (Fig. 1B). Then the elevator was slid so that the flies were transported to the choice point, where the two odors converged. The flies were allowed to choose one odor between the two for 120 sec and the choice behavior was recorded with a frame rate of 1 frame/sec. Measurement was performed in the darkness. After testing, flies were sucked out using a vacuum cleaner.
Measurement of innate odor avoidance utilized the same apparatus but with one of the sides containing only the solvent. Flies were starved to an extent similar to the appetitive memory testing.
Statistics.Statistics were performed by StatPlus (AnalystSoft), Prism5 (Graphpad), and a custom-made JAVA script. For the data points that did not violate the assumption of normality and homogeneity of variance (Kolmogorov-Smirnov and Bartlett test), parametric statistics were applied. The data points that were significantly different from the normal distribution were analyzed with nonparametric statistics.
To estimate the choice dynamics, hyperbola curve fitting was applied:
| \begin{equation*} \mathit{PI} = \frac{A*t}{B + t} \end{equation*} |
We estimated the variability of thalf by generating a new dataset based on the measured data using the bootstrap method.23),24) Experimental dataset were randomly resampled for many times: from the original dataset of N samples, the computer randomly sampled N data points allowing duplication and made one “averaged curve.” The hyperbola function was fitted as described above to calculate thalf. The procedure was repeated for 1,000 times to generate the distribution of thalf.
We constructed a new T-maze that can measure conditioned odor choice at any given time point (Fig. 1; see Materials and methods for details). The principle of the apparatus is the same as the T-maze by Tully and Quinn.6) The improvements of our T-maze lie in the transparent wall allowing back-light illumination and video-recording. Video frames can be analyzed automatically.
To examine the utility of the new developments, we first measured the conditioned odor preference of the wild-type flies. Starved or sated flies were subjected to appetitive and aversive olfactory learning reinforced with a sugar reward or an electric shock punishment, respectively (Fig. 3A). The group trained with sugar showed strong conditioned approach to the associated odor in a starvation-dependent manner (Fig. 3B).25)–29) In contrast, the groups trained with electric shocks showed strong conditioned avoidance regardless of the feeding states (Fig. 3B). In the cases with robust conditioned odor preference, the choice was made relatively quickly, and reached the equilibrium state within 30 sec (Fig. 3B). This time course is consistent with the previous reports using single flies.11) The eventual behavioral performance was comparable to the previous reports,6),26),27) demonstrating the capability in measuring the odor choice at any given time point, and therefore the time course of the choice.

Temporal profiling of the conditioned odor choice. (A) Starved or sated wild-type flies are conditioned with sugar reward or electric shock punishment. Flies are immediately tested after conditioning. (B) Time course of the memory performance. Throughout this study, bold and transparent lines indicate the mean ± s.e.m. n = 4 for each group. Estimated thalf = 2.81 sec for appetitive protocol for the starved flies, 3.70 sec and 6.25 sec for aversive protocol for the starved and sated flies, respectively (see Materials and methods for details). (C) The performance indices averaged for the last 60 sec. Bars and error bars indicate the mean ± s.e.m. The performance of the sated groups is compared to the starved groups by a two-tailed unpaired t-test. ***: P < 0.001, n.s.: P > 0.05. (D) Wild-type flies are trained with different inter-stimulus-intervals (ISI). The negative ISI value means the odor presentation precedes the onset of the first shock. ISI = −150 sec is used as an unpaired control. Flies are tested 15 min after conditioning. (E) Time course of conditioned odor choice. n = 4, 4, 8. Estimated thalf = 6.65 sec and 3.27 sec for the groups of ISI = −15 sec and 45 sec, respectively. (F) Averaged performance over the last 60 sec. Groups trained with ISI = −15 sec (forward) and ISI = 45 sec (backward) are compared to the groups with ISI = −150 sec (unpaired). ***: P < 0.001, *: P < 0.05; a two-tailed unpaired t-test followed by Bonferroni correction.
Even the ‘plateau’ performance is not completely stable over time (Fig. 3B). Thus, to cancel out the noise, we took the mean of the performance indices over the last 60 sec of the testing (Fig. 3C). Indeed, it provides more stable dataset than the ‘snap shot’ performance that is measured by the widely-used setups (mean SD of PI in single frame in the last 60 sec = 0.1864 vs. mean SD of averaged PI for the last 60 sec = 0.1599; P < 10−6, paired t-test; data from Figs. 3–7). Therefore, our setup not only provides the time course but also improves the signal-to-noise ratio of the measurement of the memory performance.

Transient activation of serotonin neurons impairs the choice results. (A) Time course of conditioned odor approach upon thermo-activation of serotonergic neurons. Flies are trained at 24 °C and tested at 29.5 °C. Dots and lines indicate the mean performance indices and the fitted hyperbola functions, respectively (see Materials and methods for details; R2 = 0.920, 0.747, 0.856 for TrH-GAL4/+, TrH-GAL4/UAS-dTrpA1, UAS-dTrpA1/+, respectively). n = 15, 16, 14. (B) The half-maxima time (thalf) of the fitted hyperbola functions (see Materials and methods; n = 1,000). Boxes and whiskers indicate the 25–75% and the 5–95% tiles, respectively. (C) Averaged performance over the first and the last 10 sec of the test. *: P < 0.05, n.s.: P > 0.05; Kruskal-Wallis test followed by the Dunn’s multiple pairwise comparisons. (D and F) Time course of innate avoidance of the odors used in the learning experiments. The response is measured at 29.5 °C. R2 for TrH-GAL4/+, TrH-GAL4/UAS-dTrpA1, and UAS-dTrpA1/+: 0.865, 0.840, 0.731 (D); 0.910, 0.831, 0.892 (F), respectively. n = 19, 14, 20 (D), n = 23, 25, 27 (F). (E and G) The half-maxima time (thalf) of the fitted hyperbola functions (see Materials and methods; n = 1,000).
Some types of memory require repetitive conditioning that takes more than an hour.30),31) Experiments with the conventional setup with manual presentation of odors and electric shocks are thus laborious and amenable to handling errors. To circumvent these problems, we devised an automated aversive conditioning setup that can precisely control the timing of stimulus presentations and afford repetition without time-consuming work (Fig. 2).
To examine the compatibility of our conditioning setup and the T-maze, we performed spaced and repetitive conditioning with different inter-stimulus-intervals (ISI; Fig. 3D). When the odor precedes the shock (negative ISIs) flies are conditioned to avoid the odor, whereas they approach the paired odor if it is presented after the shock (positive ISIs).31),32) Consistently, flies conditioned with given positive and negative ISIs (+45 s and −15 s) showed quick and bi-directional conditioned odor responses (Figs. 3E and 3F). Training with a very long ISI (−150 s) did not cause significant conditioned odor preference, indicating the importance of a temporally paired presentation. Thus, our setup, together with the automatic analysis of the choice, enables precise high-throughput experiments and datasets with multiple parameters.
The improved T-maze is compatible with thermo-genetic manipulations.Genetic tools available with Drosophila enable precise circuit manipulations. Especially, thermo-genetic approaches using temperature-dependent proteins are widely applied to temporally control the manipulations. Therefore, we challenged our setups with those manipulations. We expressed a temperature sensitive dominant negative dynamin shibirets1 (shi)33) in aversive and appetitive reinforcement neurons using two GAL4 drivers: TH-GAL415) and R58E02-GAL4,14) respectively (Figs. 4A and 4D). Flies were conditioned and tested at a restrictive temperature (32 °C). Consistent with the previous reports,12),14),34)–38) we observed a severe impairment in 2-hour memory in both the cases (Figs. 4B, 4C, 4E, 4F). Therefore, our T-maze offers a possibility to study the neuronal control of choice speed using genetic manipulations.

Appetitive and aversive memories are impaired by blocking different subsets of dopamine neurons. (A) Schematic diagram of the mushroom body projections of dopamine neurons labelled by TH-GAL4. The ambient temperature is 32 °C throughout the experiment. (B) Time course of conditioned odor choice tested 2 hours after training with electric shock. n = 11, 8, 11. Estimated thalf = 2.55 sec, 5.36 sec for TH-GAL4/+, UAS-shi/+ flies, respectively. (C) Averaged performance over the last 60 sec. ***: P < 0.001; one-way ANOVA and a two-tailed unpaired t-test followed by Bonferroni correction (planned pairwise comparisons). (D) Schematic diagram of the mushroom body projections of dopamine neurons labelled by R58E02-GAL4. (E) Time course of conditioned odor choice tested 2 hours after training with the sugar reward. n = 4 for each. Estimated thalf = 12.16 sec, 4.46 sec for 58E02-GAL4/+, UAS-shi/+ flies, respectively. (F) Averaged performance over the last 60 sec. ***: P < 0.001; one-way ANOVA and a two-tailed unpaired t-test followed by Bonferroni correction (planned pairwise comparisons).
A pharmacological study using human subjects demonstrated that a selective serotonin reuptake inhibitor shortens a reaction time.39) By expressing shi with the TrH-GAL4 driver,17),18) we transiently blocked many, if not all, serotonin neurons during the test of appetitive memory. Interestingly, the transient blockade resulted in a lower performance in the initial phase of testing, but it eventually reached a similar, or even slightly improved, level compared to the control groups (Fig. 5A; dots).
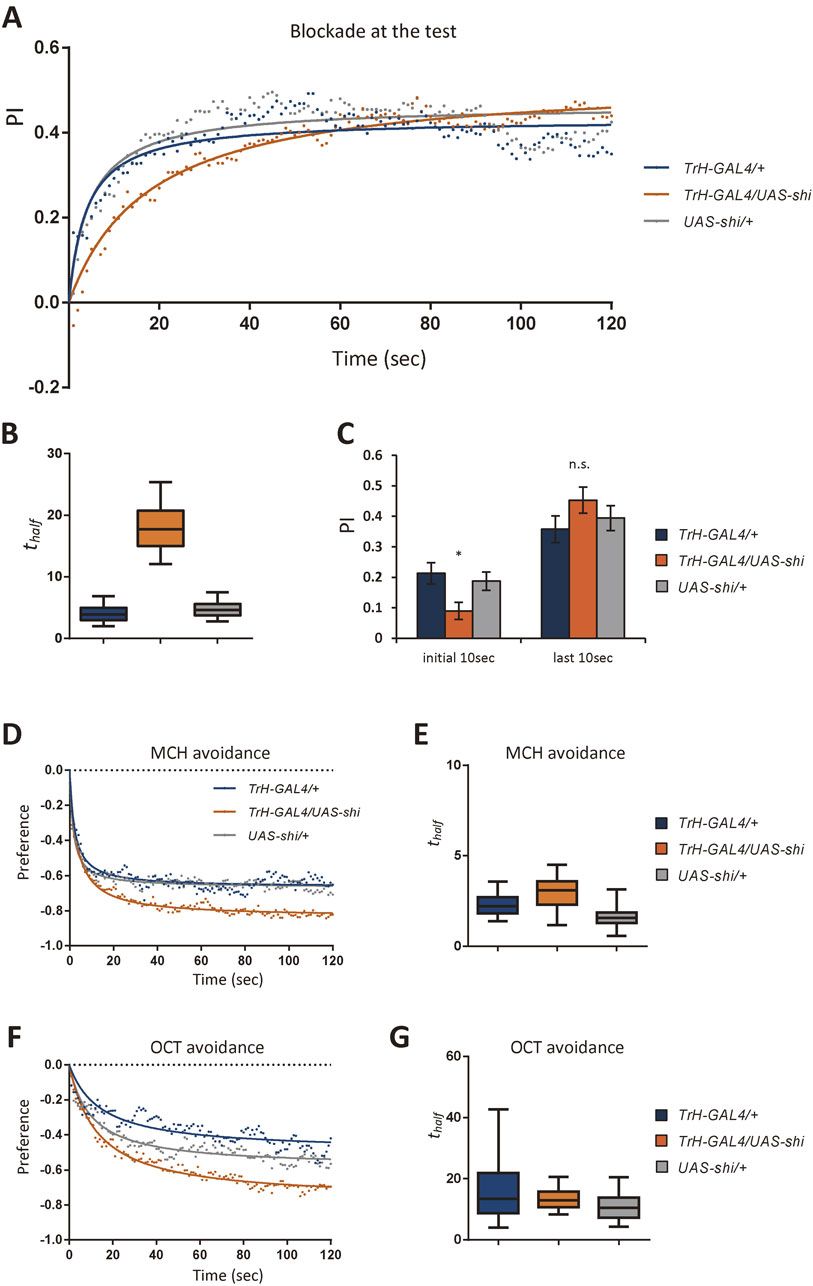
Transient serotonin blockade slows down the conditioned odor choice. (A) Time course of conditioned odor approach tested 10 min after training with the sugar reward. Flies are trained at 24 °C and tested at 32 °C. Dots and lines indicate the mean performance indices and the fitted hyperbola functions, respectively (see Materials and methods for details; R2 = 0.652, 0.958, 0.716 for TrH-GAL4/+, TrH-GAL4/UAS-shi, UAS-shi/+, respectively). n = 22, 26, 27. (B) The half-maxima time (thalf) of the fitted hyperbola functions (see Materials and methods; n = 1,000). Boxes and whiskers indicate the 25–75% and the 5–95% tiles, respectively. (C) Averaged performance over the first and the last 10 sec of the test. *: P < 0.05, n.s.: P > 0.05; one-way ANOVA and a two-tailed unpaired t-test followed by Bonferroni correction (planned pairwise comparisons). (D and F) Time course of innate avoidance of the odors used in the learning experiments. The response is measured at 32 °C. R2 for TrH-GAL4/+, TrH-GAL4/UAS-shi, and UAS-shi/+: 0.766, 0.942, and 0.827 (D); 0.685, 0.966, and 0.877 (F), respectively. n = 27, 25, 25 (D), n = 24, 25, 25 (F). (E and G) The half-maxima time (thalf) of the fitted hyperbola functions (see Materials and methods; n = 1,000).
To quantify the choice speed, we calculated the time to reach the half-maximum of the hyperbola function fitted to the experimental time course (Fig. 5A; lines; thalf = 3.88 sec, 17.78 sec, 4.93 sec for TrH-GAL4/+, TrH-GAL4/UAS-shi, UAS-shi/+; see also Materials and methods). The choice speed of flies with blocked serotonin neurons was significantly slower than those of controls (Fig. 5B; see also Materials and methods). Consistently, only the initial performance (1–10 sec) was significantly lower than the controls, but not later (111–120 sec; Fig. 5C). When flies of the same genotypes were tested at the permissive temperature, the choice dynamics was not significantly different (Fig. 6).

Flies behave normally at the permissive temperature. (A) Time course of conditioned odor approach tested at the permissive temperature (24 °C). Dots and lines indicate the mean performance indices and the fitted hyperbola functions, respectively (see Materials and methods for details). R2 = 0.942, 0.958, 0.915, 0.917, and 0.922 for TrH-GAL4/+, TrH-GAL4/UAS-shi, UAS-shi/+, TrH-GAL4/UAS-dTrpA1, and UAS-dTrpA1/+, respectively. (B) Averaged performances over the first and the last 10 sec of the test are not significantly different among genotypes (n.s.: P > 0.05 with Kruskal-Wallis test). (C) The half-maxima time (thalf) of the fitted hyperbola functions (see Materials and methods; n = 1,000).
The slow choice upon blocking serotonin neurons was specific for conditioned odor preference, because the speed of the innate odor response was not significantly impaired (Figs. 5D–G). These results together suggest the distinct circuit mechanisms to control the speed of innate and conditioned odor response.
We next asked whether activation of the same neurons in the test affects the speed and/or the eventual choice performance. By expressing the temperature-sensitive cation channel dTrpA1 with TrH-GAL4,19) we transiently thermo-activated the serotonin neurons during the test of appetitive memory. Notably, this activation, in contrast to the blockade, left the initial performance intact, but significantly impaired the eventual choice result (Figs. 7A and 7C). Accordingly, the choice speed tended to be faster, though not statistically significant (Fig. 7B; thalf = 7.01 sec, 4.14 sec, 6.40 sec for TrH-GAL4/+, TrH-GAL4/UAS-dTrpA1, UAS-dTrpA1/+, respectively; see also Materials and Methods). Performance at the permissive temperature and odor avoidance was not significantly impaired (Figs. 6, 7D–7G). Altogether, down- and up-regulation of serotonergic neurons has a significant impact on speed and eventual performance of the conditioned odor choice, respectively.
We successfully established a new T-maze, which visualizes the dynamics of odor choice (Fig. 1). The performance of wild-type flies started with relatively low values and reached the plateau at around 30–60 sec after the onset of testing (Fig. 3). This time course well explains the time point to measure olfactory choice in the conventional T-maze (typically 2 min). Furthermore, the choice speed of grouped flies was similar to the previous report that investigated the conditioned odor response of single flies.11) Therefore, our new setup measures olfactory choice of flies in the same way as the conventional T-maze, and offers a powerful possibility to study olfactory choice dynamics.
Video recording and automatic counting of flies provide another advantage in measuring the eventual performance. Taking the mean of the performance indices in different frames averages out noise, thereby improving the signal-to-noise ratio (Fig. 3; see also Results). The stability of data is critical in detecting subtle difference in the performance. For example in Fig. 3E, although comparing the averaged PI for the last 60 sec gave a statistically significant difference between ISI = −150 sec (unpaired) and 45 sec (backward) groups (P = 0.026), comparing the ‘snap shot’ PI gave P < 0.05 only in 35% of the cases (21 frames out of 60 frames). Therefore, our setup provides the noise-resistant measurement of the eventual performance, as well as the temporal dynamics. In addition to all these points, multiplexing T-mazes (Fig. 1A), automatic fly detection (Fig. 1D), and the automatic aversive conditioning device (Fig. 2) significantly reduced the human workload.
Associative learning may change the olfactory responses beyond their preferences. For example, flies modulate their locomotor activity in response to many stimuli, such as odors with different biological significance.40) Another recent study reported that locomotor activity influences sugar preference behavior.41) Advances in these studies are based on emerging computational image analysis techniques, which enable the measurement of multiple behavioral parameters of individual flies.42) Compared to the conventional T-maze, our setup is more amenable to those elaborate image analyses and may thus reveal hitherto-neglected behavioral parameters in conditioned odor responses.
Serotonin regulates the trade-off between speed and accuracy of conditioned odor choice.The newly developed setup revealed that activation and inhibition of serotonin neurons changes two different parameters of the conditioned odor choice behavior: the eventual performance and choice speed (Figs. 5–7). A trade-off between speed and accuracy exists in many behavioral tasks.7)–10) Therefore, serotonin might play a key role in balancing these two parameters. Interestingly, dysregulation of serotonin level in humans, rodents, and flies leads to various time-related disorders including impulsivity and hyperactivity.43)–46)
In contrast to the conditioned odor choice, modulation of serotonin neurons did not affect speed of innate odor response (Figs. 5 and 7). Although serotonin is reported to modulate peripheral olfactory processing positively,47) our results may be better explained by serotonin functions in higher-order brain areas. In Drosophila, a brain structure called the mushroom body is reported to be preferentially important in conditioned odor choice.48) Therefore, serotonin neurons projecting to the mushroom body17),49) might regulate the speed of conditioned odor choice.
Previous studies have shown that chronic blockade of serotonin neurons impairs the eventual choice of appetitive memory.18),50) In contrast, we did not observe such an impairment upon transient blockade during testing (Fig. 5C). Thus, serotonin should play a dual role in the acquisition and retrieval of appetitive memory. It will be important to understand how various behavioral parameters are regulated by a single neuromodulator, serotonin.
We thank Andreas Kucher (Max Planck Institute of Neurobiology), Ikuro Nagasawa, Kazuma Saito, Tomomi Onodera, Takayuki Hosokawa (Tohoku University), Takanobu Tagawa (Helmholtz Center Munich), and Tobias Straub (LMU Munich) for excellent technical assistance and/or invaluable advices. This work was supported by Max-Planck-Gesellschaft (to H.T.), Deutsche Forschungsgemeinschaft (TA 552/5-1 to H.T.), MEXT/JSPS KAKENHI (266646 to T. I., 25890003, 26120705, 26119503, 26250001, 16H01496, 15K14307 to H.T.) and Naito Foundation (to H.T.).