Regular Contribution
GINS Complex Subunit 2 Facilitates Gastric Adenocarcinoma Proliferation and Indicates Poor Prognosis
2021 年 255 巻 2 号 p. 111-121
詳細
2021 年 255 巻 2 号 p. 111-121
Gastric cancer is the one of the most lethal malignancies of digestive system. Identifying molecular biomarkers is invaluable in help predicting clinical outcomes and developing targeted chemotherapies. GINS complex subunit 2 (GINS2) plays an essential role in the initiation and elongation of DNA replication. Although there have been studies revealing the prognostic significance of GINS2 in breast cancer and lung cancer, its involvement and function in gastric cancer need to be elucidated. We retrospectively enrolled a cohort of gastric adenocarcinoma patients after surgical resection (n = 123). By analyzing the mRNA and protein levels of GINS2 in tissue samples, we found that GINS2 presented a higher expression in tumor tissues than in adjacent normal stomach tissues. Besides, GINS2 level was positively correlated with tumor size and gastric adenocarcinoma tumor stage, implying its potential role as a tumor promoter. Univariate and multivariate analyses identified that patients with lower GINS2 showed a better overall survival compared to those with higher GINS2 expression. In addition, cellular and xenograft experiments confirmed the role of GINS2 in facilitating tumor proliferation both in vitro and in vivo. To our knowledge, this is the initial finding on GINS2 in promoting gastric adenocarcinoma progression. In conclusion, our study revealed a pro-oncogenic role of GINS2 in gastric cancer.
Gastric cancer ranks the third leading cause of cancer death worldwide (Siegel et al. 2020). The incidence of gastric cancer is decreasing, however it is still one of the most common malignancies especially in Eastern Asia. Similar with other types of neoplasia, gastric cancer tumorigenesis depends on genetic and epigenetic abnormalities as well as environmental risk factors such as Helicobacter pylori (H. pylori) infection and EB virus infection (Mathers et al. 2010; You and Jones 2012). Although a significant progress has been achieved during the past decades in gastric cancer treatment, the current clinical outcomes remain disappointing. For example, the 5-year overall survival rate is only 20-30% worldwide due to the fact that a large proportion of patients are diagnosed at advanced stage, which lacks the opportunity of curative surgical intervention (Jim et al. 2017). Besides, the postoperative prognosis of gastric cancer patients is largely depending on tumor characteristics. Therefore, identifying specific and sensitive biomarkers of gastric cancer patients is invaluable for both personalized treatment and prognosis evaluation.
Tumor initiation and progression are affected by many biological processes such as DNA replication, cell proliferation, cell migration, immunology, etc. Among them, DNA replication plays nonnegligible roles (Boyer et al. 2016). DNA replication is critical for accurate transmission of genetic information to daughter cells and abnormal replication stress is responsible for tumorigenesis. DNA replication can be divided into several steps including initiation, elongation, and termination. Each step is finely regulated by numerous molecules, and their dysregulation will result in diseases such as malignancies (Newlon 2007).
Comprised of four subunits (GINS1, GINS2, GINS3, GINS4), GINS protein complex is essential to the eukaryotic DNA replication, which participates in the initiation and elongation steps of DNA replication. Interestingly, dysregulation of GINS subunits has been reported to participate in progression of pancreatic cancer and breast cancer (Bu et al. 2020a; Li et al. 2021). Among them, GINS2 interference can attenuate cell proliferation of pancreatic cell lines (Zhang et al. 2020) as well as invasion of non-small lung cancer cells (Liu et al. 2020). Bioinformatic mining also demonstrated GINS2 as a significant prognostic biomarker for breast cancer patients (Yu et al. 2020). However, the expression of GINS2 in gastric cancer remains unknown. In the current study, we initially explored the protein expression profile of GINS2 in human gastric adenocarcinoma and showed its clinical significance on predicting patients’ survival. Moreover, we conducted cellular assays to determine its involvement in gastric cancer proliferation, which was further validated by xenograft experiments.
This study was reviewed and approved by the Ethics Committee of Sanya Central Hospital (Hainan Third People’s Hospital). Each participant fully understood and signed an informed consent form. Animal studies were approved by the Ethical Committee of Sanya Central Hospital (Hainan Third People’s Hospital) and carried out in accordance with the UK Animals (Scientific Procedures) Act, 1986.
PatientsWe collected a retrospective cohort to analyze protein expression of GINS2 in gastric adenocarcinoma. The cohort inclusion criteria are regional gastric cancer patients who underwent curative R0 gastrectomy (D2) in Sanya Central Hospital (Hainan Third People’s Hospital) during March 1, 2012 to March 1, 2016. All patients were pathologically confirmed as gastric adenocarcinoma without distant metastasis. Exclusion criteria are patients that underwent preoperative radiotherapy, chemotherapy, or endoscopic treatment, or previous history of other malignancies. Accordingly, we randomly collected 123 cases to assess their clinicopathological characteristics and follow-up. Patients’ basic information and clinicopathological characteristics were obtained for all the cases. Briefly, the median age of all cases was 58 years old, ranging 39-80 years old. Among them, 45 cases were females, and 78 cases were males. Only 22 cases underwent total gastrectomy, while the other 101 cases underwent partial or subtotal gastrectomy. The tumor size was larger than 5.0 cm in 54 patients’ samples, while less than or equal to 5.0 cm in 69 cases. The tumor invasion depth (T stage) and lymph node metastasis were recorded in accordance with the American Joint Committee on Cancer (AJCC) released TNM staging system (7th edition). As for the differentiation grade, patients were sub-grouped into well differentiation group (n = 3), moderate differentiation group (n = 7), poor differentiation group (n = 67), or signet ring cell carcinoma (the ratio of signet ring cell was > 20% according to pathological test, n = 46).
The mRNA expression level of GINS2 (presented as transcripts per million, TPM) was obtained from GEPIA (http://gepia.cancer-pku.cn) website according to the RNAseq data from TCGA database and GTEx database, including 408 gastric cancer tissues and 211 normal stomach tissues.
Immunohistochemistry (IHC) stainingThe tumor samples from all the 123 cases were obtained and formalin-fixed and paraffin-embedded for IHC staining as described by others (Liu et al. 2017). Briefly, specimen sections were dewaxed and rehydrated, incubated in 3% H2O2 for blocking endogenous peroxidase activity. Next, the sections were incubated in citrate buffer (pH 6.0) for antigen retrieval. The sections were then incubated with GINS2 antibody (1:300, PA5-84331, Thermo Fisher Scientific, Pittsburgh, PA, USA) overnight at 4℃, followed by sequential incubation with secondary antibodies and diaminobenzidine (DAB). After counterstained with hematoxylin, stained sections were evaluated by two independent pathologists. The staining intensity was scored as 0 (no), 1 (mild), 2 (moderate), and 3 (strong). The percentage of positively stained cells was scored as 0 (0), 1 (1-25%), 2 (26-50%), 3 (51-75%), and 4 (76-100%). The total score was obtained by multiplying the two scores above, ranging 0-12. According to the median staining score, all patients were sub-grouped into low-GINS2 group (IHC score ≤ 8, n = 63) or high-GINS2 group (IHC score > 8, n = 60).
Cell culture and shRNA transductionHuman gastric adenocarcinoma cell lines, KATO-III and MKN45, were obtained from the American Type Culture Collection (ATCC). Both cell lines were maintained in RPMI-1640 medium supplemented with 10% fetal bovine serum (FBS) and penicillin-streptomycin. HEK293 cells were cultured in DMEM medium supplemented with 10% FBS and penicillin-streptomycin. All cells were incubated in an incubator with a humidified atmosphere of 5% CO2 at 37℃.
For the shRNA transduction, we purchased the Lenti particles containing specific shRNAs targeting GINS2, as well as control Lenti particles containing scrambled shRNA from Genechem (Shanghai, China). The shRNA transduction was conducted according to the manufacture’s standard procedure. The knockdown efficiency was tested by Western blotting.
Western blottingCells were lysed using radioimmunoprecipitation assay (PIPA) lysis buffer containing 1:50 proteinase inhibitor cocktail. After centrifugation, the protein solution was collected and quantified according to bicinchoninic acid assay (BCA) method. Total protein from each sample (30 μg) was loaded in 10% sodium dodecyl sulfate polyacrylamide gel electrophoresis (SDS-PAGE) gel to separate proteins and transferred to polyvinylidene difluoride (PVDF) membranes (Millipore, Burlington, MA, USA). Membranes were then incubated with anti-GINS2 (dilution 1:1,000; PA5-84331, Thermo Fisher Scientific), anti-CDK4 (1:1,000, D9G3E, Cell Signaling Technology, Boston, MA, USA), anti-Cyclin D1 (1:1,000, 92G2, Cell Signaling Technology) and anti-GAPDH (1:1,000, 14C10, Cell Signaling Technology) antibodies. After incubation with horseradish peroxidase-conjugated secondary antibodies for 1 hour, ECL reagent was utilized to visualize protein bands (Liu et al. 2021).
Cell proliferation analysesA total of 3,000 cells at logarithmic growth phase were seeded into 96-well plates at 100 μL per well. Following incubation for 6, 24, 48, 72, and 96 h at 37℃, fresh culture medium containing 10μl CCK-8 reagent was injected to each well. Then cells were cultured at 37℃ incubator for another 2 h. Finally, the absorbance of each well was detected in 450nm using a microplate reader.
Cell cycle and apoptosis assaysFor the cell cycle assay, transfected cells were collected and fixed in 70% ethanol at 4℃ overnight, and treated with 5 μg/ml RNase A at 37℃ for 30 min. Then cells were stained with propidium iodide (PI) solution (BD Biosciences, San Jose, CA, USA) for 30 min at 25℃ and analyzed by a flow cytometer (BD Biosciences).
For cell apoptosis assay, transfected cells were stained with the AnnexinV/PI apoptosis kit (Beyotime, Shanghai, China) according to the manufacturer’s instructions. Briefly, cells were trypsinized and re-suspended in 200 μL binding buffer, followed by addition of Annexin V-FITC/PI into the binding buffer, then the cells were incubated in the dark for 5 min at 25℃ before subjected to the flow cytometer.
In vivo studiesBALB/c nude mice at 4 weeks old were selected for in vivo xenograft assay. Briefly, 5 × 10⁵ stable-transfected KATO-III or MKN45 cells were subcutaneously injected into the mice (Chen et al. 2021). After five days, the tumor diameter was measured by a vernier caliper every 5-days for one month, and the tumor volume was calculated according to the following formula: Volume = (π × length × width2)/6. After one month, all mice were sacrificed, and the subcutaneous xenografts were isolated and pictured.
StatisticsFollow-up was conducted for all patients to obtain the overall survival information. Statistical analyses were performed using SPSS 20.0 software (IBM, Armonk, NY, USA). The correlations between expression levels of GINS2 with various clinicopathological factors were analyzed using Pearson Chi-square test. The Kaplan-Meier method was used to generate overall survival curves, and log-rank test was used to compare the significance. The Cox proportional-hazards regression model was used for multivariate analysis. Data were presented as mean ± SD. A P value less than 0.05 was considered statistically significant.
The mRNA levels of GINS2 expression in gastric adenocarcinoma tissues and normal stomach tissues were firstly retrieved from GEPIA online database. Accordingly, GINS2 mRNA level was significantly higher in gastric adenocarcinoma tissues than normal stomach tissues (Fig. 1A; P < 0.001). This indicated that GINS2 may be upregulated in tumor tissue compared to adjacent tissue in gastric cancer patients. The remarkable difference engaged us to test its protein expression level. Using the retrospective cohort collected from our hospital, we conducted IHC staining to explore GINS2 protein expression and subcellular localization. GINS2 mainly localized in the tumor cell nucleus with slight staining in cytoplasm (Fig. 1B), however, GINS2 exerts negative staining in certain tumor sample tissues (Fig. 1C).

GINS2 was highly expressed in gastric adenocarcinoma tissues.
(A) The mRNA level of GINS2 was retrieved from GEPIA online server according to TCGA database and GTEx database, showing a remarkable higher level in gastric adenocarcinoma tissues (T, n = 408) than that in normal stomach tissues (N, n = 211). The Y-axis was presented as TPM (transcripts per million). The Y-axis was showed as log2(1 + TPM).
*indicates P < 0.05 by Student’s t-test. (B) Representative high expression of GINS2 in clinical gastric adenocarcinoma specimen by IHC staining. (C) Representative low GINS2 expression gastric adenocarcinoma tissues by IHC staining.
We next focused on investigating the clinical involvement of GINS2 in gastric adenocarcinoma. Chi-square test was used to analyze the correlations between GINS2 expression with the clinicopathological characteristics of gastric adenocarcinoma patients (Table 1). Accordingly, GINS2 is positively correlated with the tumor size (P = 0.016), tumor T stage (P < 0.001), and lymph node metastasis (P < 0.001). Therefore, GINS2 seems to increase with the progression of gastric adenocarcinoma, indicating that GINS2 may participate in gastric adenocarcinoma progression. In contrast, GINS2 showed no statistically significant correlation with patients’ age, sex, resection pattern, nor differentiation grade (all P > 0.05).
In addition, we conducted Kaplan-Meier analyses to identify prognostic factors (Fig. 2, Table 2). As expected, higher GINS2 was correlated with a poorer overall survival (mean survival time 52.5 ± 2.9 months) compared to those with lower GINS2 (mean survival time 71.4 ± 2.7 months). Meanwhile, patients underwent total gastrectomy exhibited lower 5-year overall survival (OS) (44.0%) than those underwent partial gastrectomy (65.9%). Tumor size of larger than 5.0 cm was also an unfavorable prognostic factor in our cohort (P = 0.035). Similarly, the overall survival time of patients with positive lymph node metastasis was shorter than those with negative lymph nodes (P < 0.001).
To further validate whether GINS2 can act as an independent prognostic factor, we assessed the significant factors using a Cox regression model. The covariates include tumor resection patter, tumor size, T stage, lymph node (LN) metastasis, and GINS2 expression level. As shown in Table 3, gastrectomy pattern [hazard ratio (HR) = 0.352, 95% confidence interval (CI) 0.171-0.724, P = 0.005], lymph node metastasis (HR = 2.964, 95% CI 1.217-7.219, P = 0.017), as well as GINS2 protein expression (HR = 1.952, 95% CI 1.021-3.733, P = 0.043), were all independent prognostic factors for gastric adenocarcinoma patients.
We also compared the prognostic accuracy of each significant predictors using the area under the curve (AUC) of the time-dependent curve (Fig. 3A). Among them, GINS2 level exhibited the highest AUC on the predicting accuracy before 46 months and then decreased to the second highest one following the LN metastasis. In other words, GINS2 showed better prognostic predicating power than all other parameters in the first 46 months after surgical resection according to our cohort. The detailed data for their prediction power regarding 3-year OS, 4-year OS, and 5-year OS were exhibited in Fig. 3B, C and D. As reflected by the AUC values, GINS2 level was the best one for predicting 3-year OS (Fig. 3B), while GINS2 and LN metastasis showed similar prediction power for the 4-year OS (Fig. 3C), however LN metastasis became the best predictor for 5-year OS (Fig. 3D). Therefore, our data highlighted that clinical application of GINS2 may improve the prediction power of early overall survival for gastric cancer patients.

Correlations between GINS2 expression with patients’ characteristics.
GINS2, GINS complex subunit 2; LN, lymph nodes.
*indicates P < 0.05.
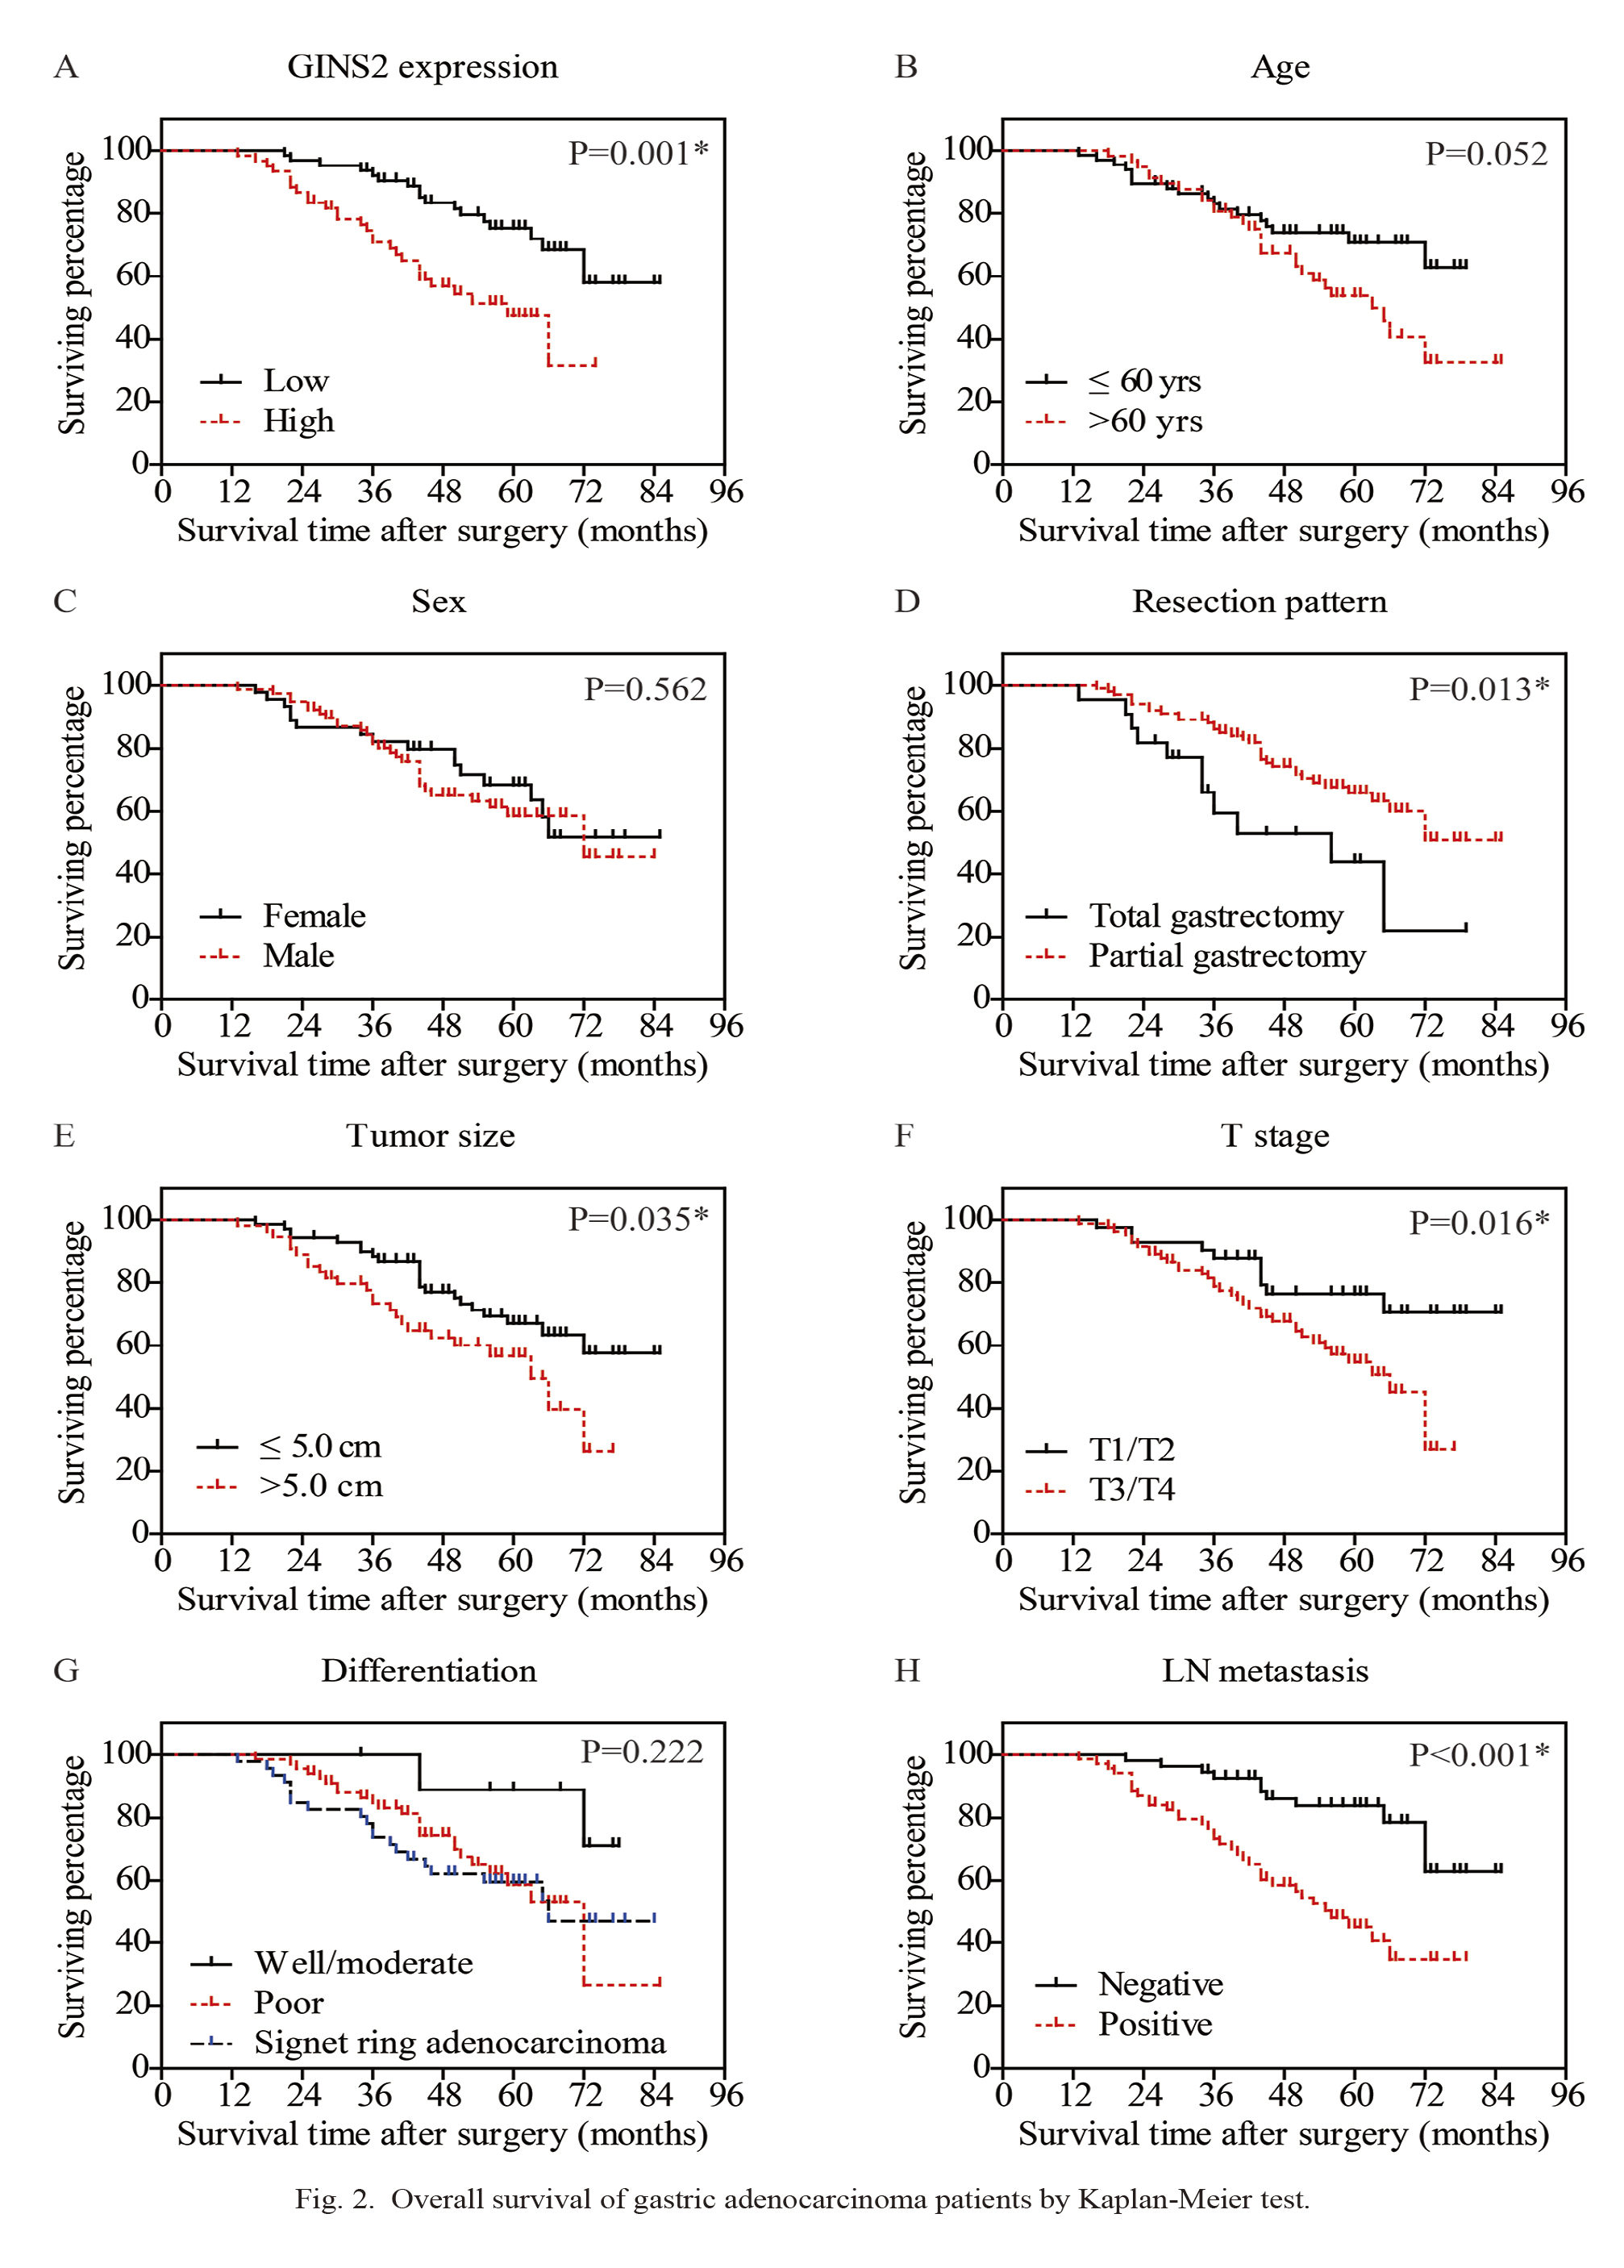
Overall survival of gastric adenocarcinoma patients by Kaplan-Meier test.
The overall survival curves were plotted according to different clinicopathological characteristics, including GINS2 protein level (A), age (B), sex (C), resection pattern (D), tumor size (E), T stage (F), differentiation grade (G), and lymph node (LN) metastasis (H). *indicates P < 0.05 by log-rank t-test.

Kaplan-Meier overall survival analysis.
GINS2, GINS complex subunit 2; LN, lymph nodes; OS, overall survival.
*indicates P < 0.05.

Multivariate analysis.
CI, confidence interval; GINS2, GINS complex subunit 2; HR, hazard ratio; LN, lymph nodes.
*indicates P < 0.05.
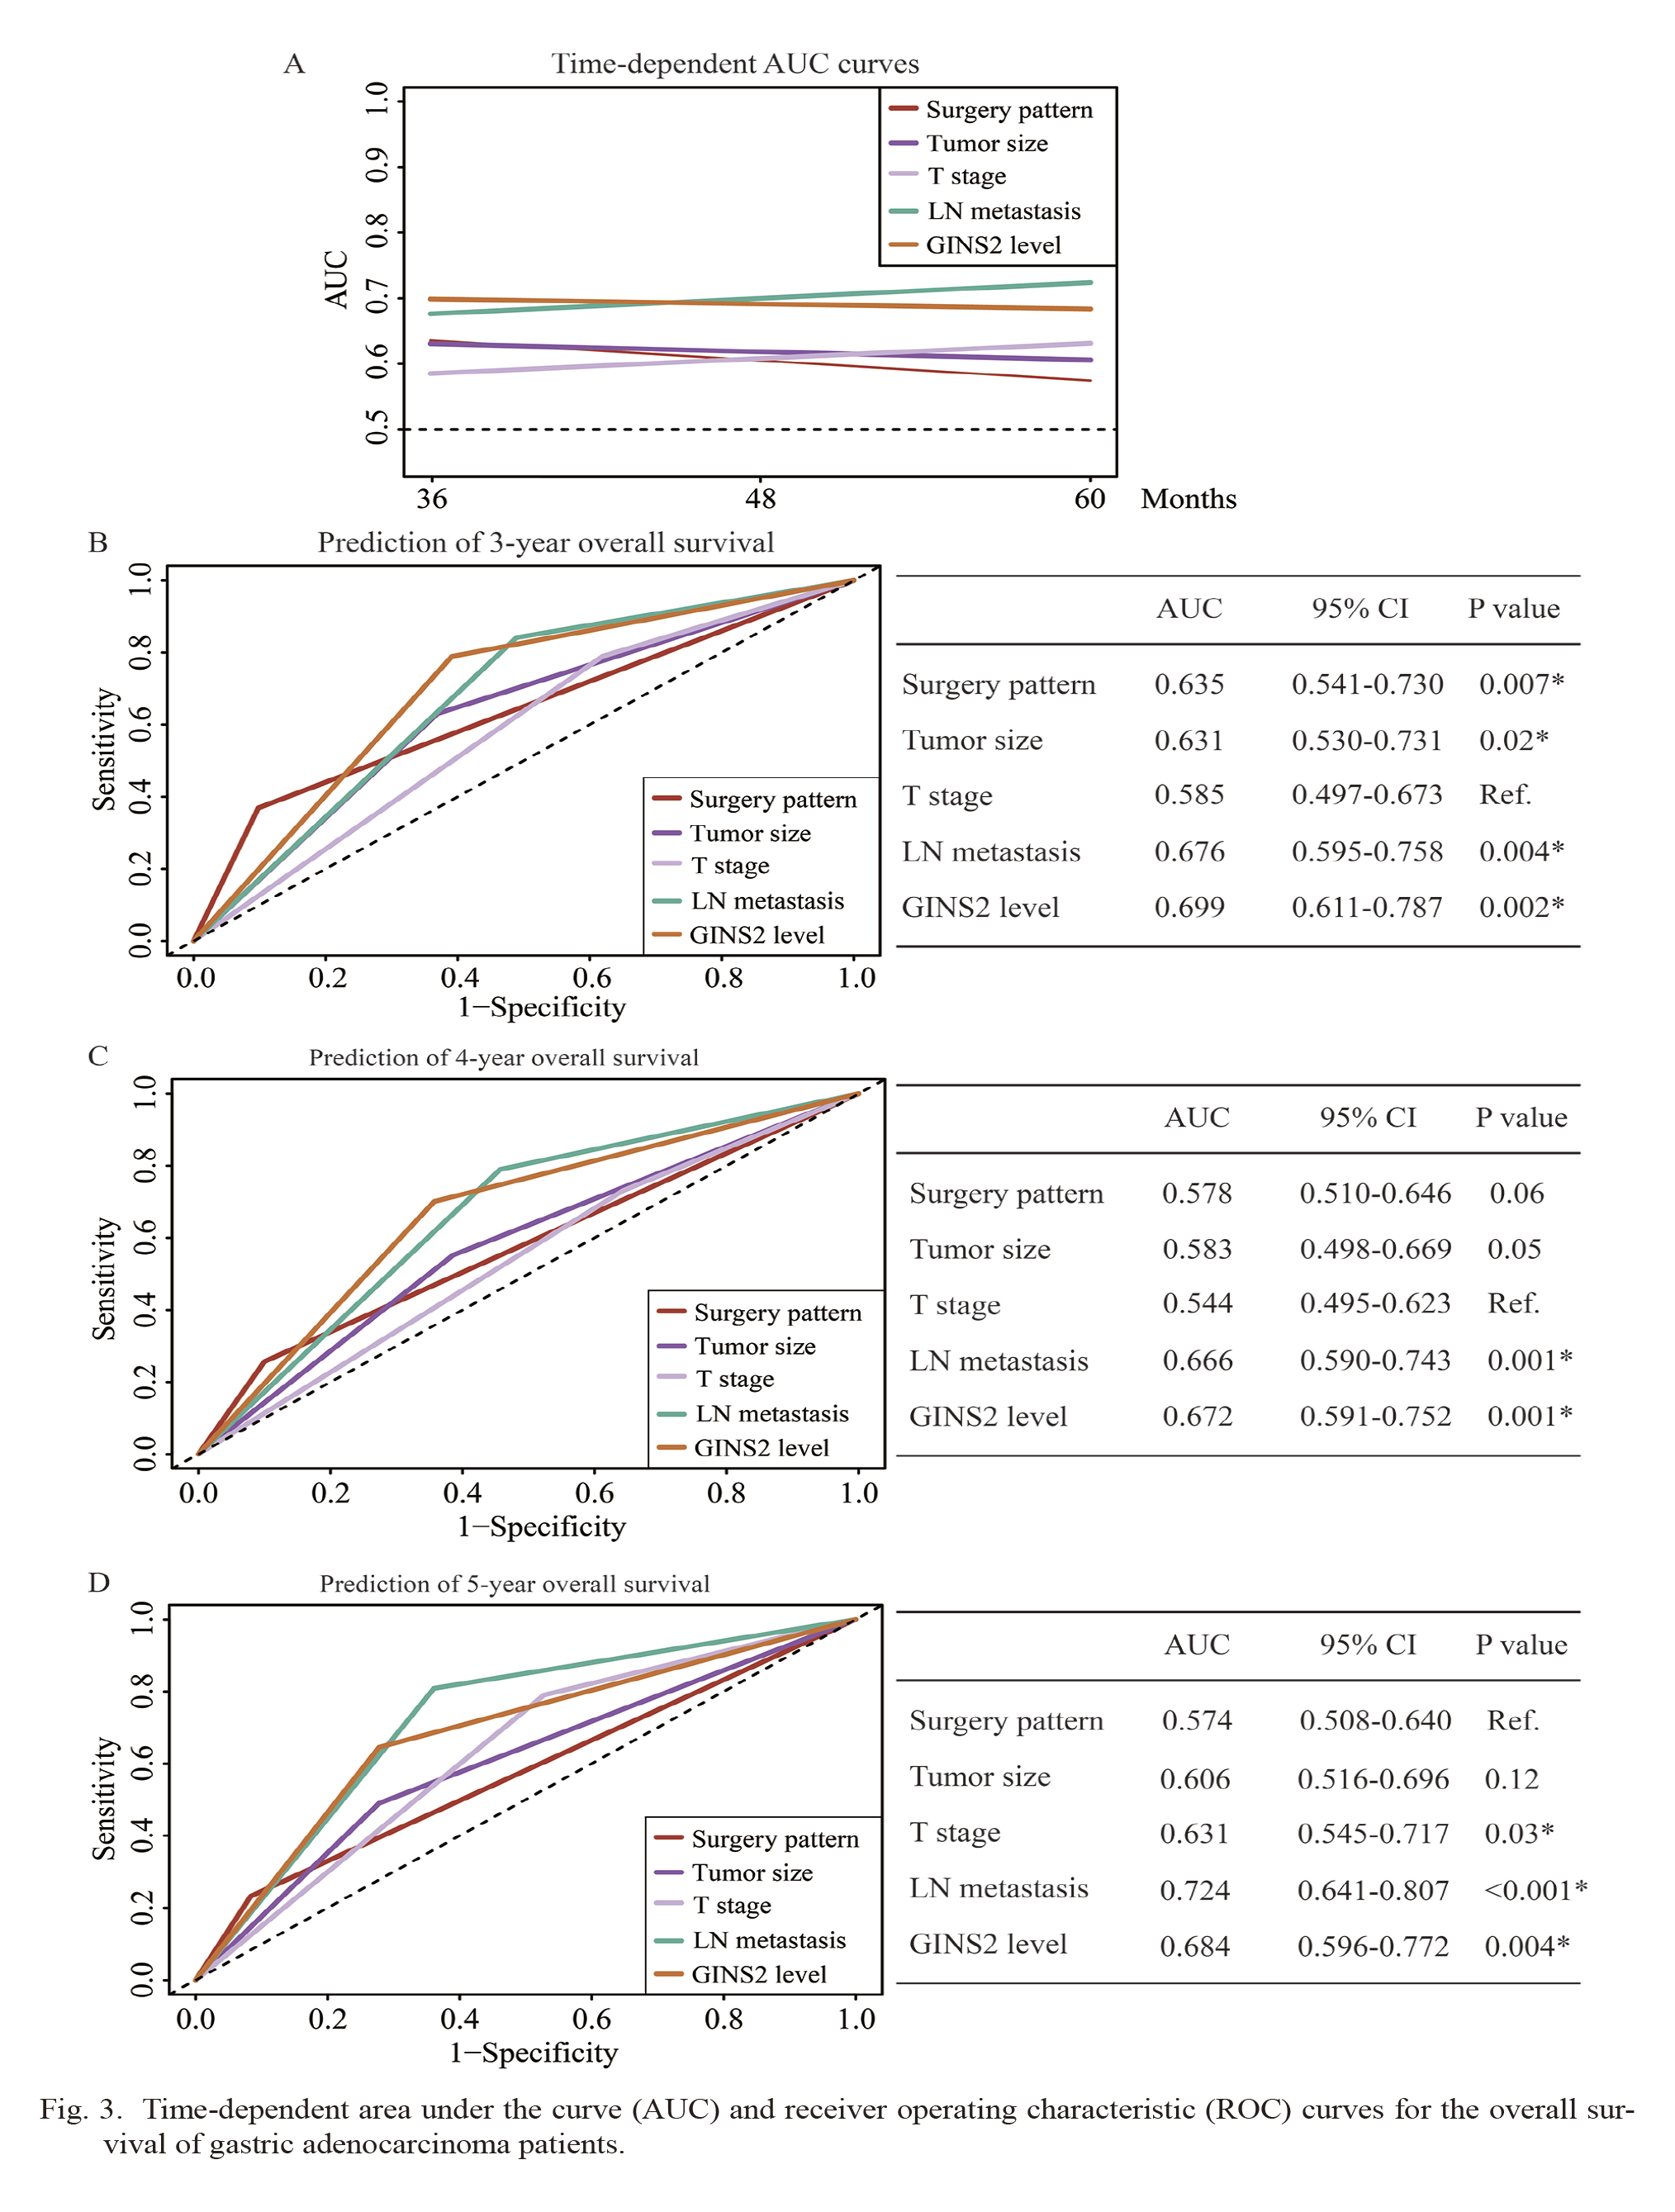
Time-dependent area under the curve (AUC) and receiver operating characteristic (ROC) curves for the overall survival of gastric adenocarcinoma patients.
(A) Time-dependent AUC curves of surgery pattern, tumor size, T stage, LN metastasis, and GINS2 level for the prediction of overall survival. The time dependence of each AUC for overall survival is shown for the period up to five years after surgery.
(B-D) Time-dependent ROC curves of surgery pattern, tumor size, T stage, LN metastasis, and GINS2 level for the prediction of 3-year overall survival (B), 4-year overall survival (C), and 5-year overall survival (D). P values were compared to the reference (ref.) parameter whose AUC was smallest. *P < 0.05.
To further investigate the function of GINS2 in gastric adenocarcinoma, we conducted in vitro analyses with the human gastric adenocarcinoma cell lines KATO-III and MKN45. Stable cell lines were established by lentivirus-mediated transduction with scrambled control shRNA or GINS2-shRNAs (GINS2-shRNA#1 and GINS2-shRNA#2). Western blotting analyses revealed the relative GINS2 protein expression levels in scrambled-, GINS2-shRNA#1-, and GINS2-shRNA#2-KATO-III cells were 1.00 ± 0.16, 0.33 ± 0.12, 0.24 ± 0.15, respectively (Fig. 4A, P < 0.001). Similarly, the relative fold changes were 1.00 ± 0.21, 0.35 ± 0.12, 0.28 ± 0.19 in transduced MKN45 cells (Fig. 4B, P < 0.001).
We next tested the effects of GINS2 on modulating gastric adenocarcinoma proliferation using CCK-8 assay. According to the data, compared with scrambled-shRNA cells, knockdown of GINS2 with GINS2-shRNA#1 or GINS2-shRNA#2 significantly inhibited the cell proliferation after 48 hours in KATO-III cells (Fig. 4C). Comparable results were observed in MKN45 cells (Fig. 4D). The possible underlying mechanisms can be partially reflected by the alterations of CDK4 and cyclin D1 in Fig. 4A and B. Since GINS2-shRNA#2 showed a more significant effect on knocking-down the expression of GINS2 in both cell lines, we next selected GINS2-shRNA#2 stable cells to conduct in vivo assays. We subcutaneously injected the stable transduced cells into nude mice to obtain xenograft models. Compared with xenografts generated by scrambled-shRNA-transduced cells, the xenografts generated by GINS2-shRNA#2-transduced cells showed significantly slower growth in both KATO-III and MKN45 xenografts (Fig. 4E, F). Consistently, the isolated tumors were macroscopically smaller in GINS2-shRNA#2 groups than those in scrambled-shRNA groups (Fig. 4G, H). Therefore, similar with the in vitro experiments, we found that silencing GINS2 attenuates gastric adenocarcinoma growth in vivo.
To further investigate the underlying mechanisms, we conducted cell cycle and apoptosis assays. GINS2 knockdown induced a significant increase in the percentage of cells in G0/G1 phase as well as a concomitant decrease in the percentage of cells in S phase in both KATO-III and MKN45 cells (Fig. 5A, B), indicating that GINS2 interference induced cell cycle arrest in G1 phase. Meanwhile, GINS2 interference remarkably upregulated the proportion of apoptotic cells in both KATO-III and MKN45 cells (Fig. 5C, D).

Silencing GINS2 inhibits gastric adenocarcinoma cell proliferation both in vitro and in vivo.
(A, B) Protein levels of GINS2 were tested by immunoblotting after shRNA transduction in both KATO-III cells (A) and MKN45 cells (B), thus confirmed the knockdown efficiency. In addition, expression of CDK4 and cyclin D1 were both downregulated after silencing GINS2 in the two cell lines.
(C, D) CCK-8 assay confirmed the significant effect of GINS2-shRNA on inhibiting KATO-III and MKN45 cell proliferation, respectively.
(E, F) KATO-III and MKN45 cells stably transfected with GINS2-shRNA#2 or scrambled-shRNA were subcutaneously seeded into nude mice. The tumor volumes were measured every five days. The tumor growth curve showed that GINS2-shRNA#2 significantly suppressed tumorigenicity in vivo. (G, H) After one month, all mice were sacrificed, and xenografts were isolated, showing a macroscopical difference between the two groups. Data were presented as mean ± SD from three independent repeats. *P < 0.05.

GINS2 interference induced cell cycle arrest and apoptosis of gastric cancer cells.
(A, B) After GINS2 interference by shRNAs, flow cytometry revealed cell cycle conditions in KATO-III and MKN45 cells.
(C, D) After GINS2 interference by shRNAs, cells were stained with Annexin-V/FITC and PI, and flow cytometry assessed the percentage of apoptotic cells. Data were presented as mean ± SD from three independent repeats. *P < 0.05.
The involvement of GINS subunits in malignancies has been reported in recent studies. For example, high expression of GINS1 promotes drug resistance in leukemia cells (Hsieh et al. 2020) and help predicts clinical outcomes of colorectal cancer patients (Bu et al. 2020b). On the other hand, high GINS4 results in tumorigenesis of human bladder cancer, colorectal cancer, and hepatocellular carcinoma (Yamane et al. 2016; Rong et al. 2020; Zhang et al. 2021). However, our knowledge regarding the role of GINS2 in gastric cancer is limited.
Based on the RNAseq data from TCGA database, GINS2 is highly expressed in gastric adenocarcinoma tissues compared to nontumorous gastric tissues, indicating a dysregulated expression of GINS2 during gastric adenocarcinoma tumorigenesis and progression. Furthermore, we collected a retrospective gastric adenocarcinoma cohort from our hospital and tested the protein expression pattern of GINS2 in gastric adenocarcinoma tissues. According to the distinct expression levels in different tumor samples, we sub-grouped our cohort into low-GINS2 expression group and high-GINS2 expression group. Statistical analyses revealed that GINS2 is positively correlated with gastric adenocarcinoma progression and is a risk factor for poor survival of gastric adenocarcinoma patients. Consistent with our findings, bioinformatic data mining revealed that increased GINS2 mRNA levels were associated with a worse prognosis for relapse-free survival of breast cancer patients (Zheng et al. 2014; Yu et al. 2020). A similar conclusion was obtained regarding to the pancreatic cancer by Bu et al. (2020a) using multiple online bioinformatics databases. An upregulated expression of GINS2 had also been reported in early-stage cervical cancer. According to the independent cohort from Ouyang’s group, higher GINS2 expression was significantly associated with stromal invasion, lymph node metastasis, tumor recurrence, and shorter overall survival time (Ouyang et al. 2017). The clinical significance of GINS2 in various malignancies emphasized its potential role as a prognostic predictor for cancer patients.
Interestingly, we found that patients underwent total gastrectomy showed poorer overall survival in our retrospective cohort. This may be partially explained by the fact that the selection of gastrectomy pattern was not only determined by the tumor location, but also affected by other clinical features of tumors. For example, cases with linitis plastica, or signet-ring cell carcinoma by preoperative biopsy in gastric body, or with abnormal 14th lymph nodes during operation were more prevalent to underwent total gastrectomy instead of partial gastrectomy in our practice. We have to admit that our conclusion may contain bias due to limited percentage in total gastrectomy (22/123, 17.9%) in a single medical center.
Besides clinical findings, we analyzed the tumor related effects of GINS2 in gastric adenocarcinoma cells by using shRNA knockdown strategy. As expected, silencing GINS2 resulted in significant inhibition on gastric adenocarcinoma growth both in vitro and in vivo. Of note, the expression of CDK4 and cyclin D1, two well-recognized cell-cycle biomarkers, were both downregulated by GINS2-knockdown, indicating that GINS2 has significant effect on tumor cell proliferation. Similarly, it has been reported that GINS2 can sustain proliferation and prevent apoptosis in gliomas, ovarian cancers, and leukemias (Zhang et al. 2013; Yan et al. 2018; Shen et al. 2019). Consistent with Zhang’s results regarding the role of GINS2 in pancreatic cancer cells (Zhang et al. 2020), our data revealed that GINS2 interference can induce cell cycle arrest and promoted cell apoptosis of gastric adenocarcinoma cells. As for the potential signaling mechanisms, GINS2 seems to affect various signaling pathways. For example, in thyroid cancer and pancreatic cancer cells, GINS2 interference inhibited key proteins in the MAPK signaling pathway, including MEK, JNK, ERK and p38 (Huang et al. 2020; He et al. 2021). On the other hand, GINS2 knockdown was reported to induce an increase of p53 protein expression in non-small-cell lung cancer cells (Chi et al. 2020). Interestingly, Zheng et al. (2014) indicated that mutated p53 promotes expression of GINS2 in MDA-468 and MDA-MB-231 breast cancer cells, further highlighting the crosstalk between p53 and GINS2. Other reported mechanisms of GINS2 in tumors include STAT signaling pathway in lung cancer and TGF-β1 downstream pathways in thyroid cancer (Ye et al. 2019; Sun et al. 2021).
Cellular senescence refers to an irreversible form of cell cycle arrest which can prevent proliferation of cells that have surpassed their capacity to proliferate. Interestingly, it has been reported that oncogene can induce senescence to prevent transformation of nontumorous cells unless overridden by the presence of a cooperating oncogene, such as Myc (Cagnol and Chambard 2010). In other words, precise cellular senescence is essential to restrain carcinogenesis. However, overexpression of c-Myc in normal human melanocytes suppressed B-Raf- or N-Ras-induced senescence, thus promoted carcinogenesis (Zhuang et al. 2008). Considering the important functions of GINS2 on promoting initiation and elongation of DNA replication, it is high likely that GINS2 may also suppress cell senescence, resulting in imbalanced cellular senescence and leading to the development of gastric cancer. However, the possible correlation between GINS2 and senescence has not been well established and need further investigation.
Our study has certain limitations. Firstly, our retrospective cohort was obtained from our hospital and focused only on localized or regional stage gastric cancers. Therefore, our data may contain bias and whether the conclusion can be applied to advanced stage gastric cancers should be further investigated. Secondly, our data did not retrieve the information about postoperative adjuvant therapy, thus the correlations between GINS2 expression and chemotherapy resistance in gastric adenocarcinoma was unknown. Similarly, we did not obtain the postoperative complication information. For example, the complication rate of total gastrectomy was reported to be higher than that of subtotal gastrectomy, thus may result in different prognosis (Ji et al. 2017). Finally, this study focused on exploring the clinical significance and prognostic value of GINS2 in gastric adenocarcinoma, and we did not fully illustrate the underlying signaling mechanism of GINS2 although we tested the proliferation and CDK4, cyclin D1 expression in two gastric adenocarcinoma cell lines. Further studies are essential to validate the detailed effects of GINS2 on gastric adenocarcinoma pathogenesis and development.
In conclusion, we identified that GINS2 is significantly related to the prognosis of gastric adenocarcinoma, and higher GINS2 can serve as an independent unfavorable prognostic indicator for gastric adenocarcinoma patients. This study contributes to our novel understanding of GINS2’s role in gastric adenocarcinoma progression and suggests a new potential direction for prognosis prediction and therapy development.
The authors declare no conflict of interest.