- Issue 6 Pages 565-
- Issue 5 Pages 479-
- Issue 4 Pages 393-
- Issue 3 Pages 289-
- Issue 2 Pages 125-
- Issue 1 Pages 1-
- |<
- <
- 1
- >
- >|
-
2022 Volume 131 Issue 5 Pages Cover05_01-Cover05_02
Published: October 25, 2022
Released on J-STAGE: November 10, 2022
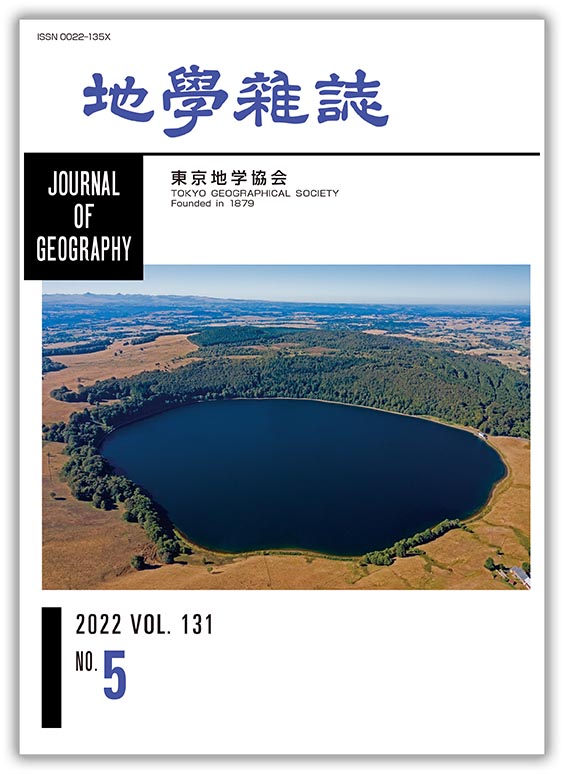
JOURNAL FREE ACCESSAlpine orogeny has made several rifts with associated volcanism in the European continent since the end of the Mesozoic Era. Some of these volcanoes have continued to erupt even into the Quaternary period. The Chaîne des Puys volcano group consists of about 100 scoria cones, maars, and lava domes distributed along the western margin of the Limagne rift in the French Central Massif, which extends west of Lyon, the third largest city in France, from north to south. The latest eruption is considered to be that of Lac Pavin maar, located near its southern end, 7,000 years ago. The photo shows Le Lac Chauvet maar (diameter 600 m, depth 73 m), which is adjacent to the southwestern edge of Lac Pavin maar. It is slightly older than the Lac Pavin maar and is considered to have formed at the end of the last ice age.
(Photograph: © Motomaro SHIRAO; Explanation: Masato KOYAMA)
View full abstractDownload PDF (2111K)
-
Yukitoshi FUKAHATA, Tomohisa OKAZAKI, Takuya NISHIMURA2022 Volume 131 Issue 5 Pages 479-496
Published: October 25, 2022
Released on J-STAGE: November 10, 2022
JOURNAL FREE ACCESSHow to estimate a strain-rate field from spatially discrete geodetic data has been a longstanding issue. In this paper, a method based on basis function expansion with Akaike's Bayesian information criterion (ABIC) is introduced, by which strain-rate fields can be obtained objectively and stably. By applying the method to GNSS data in Japan, strain-rate fields are obtained for three periods: 1997-1999, 2006-2009, and 2017-2020. Except for deformation related to volcanic activity and large earthquakes, the obtained strain-rate fields are roughly stationary in time, while showing large variations in space. In order to interpret such spatially heterogeneous deformation, a framework of inter-arc and intra-arc deformation is used, considering Japanese Islands to be composed of five island arcs (Kuril, northeast Japan, west Japan, Izu–Bonin, and Ryukyu) and that these island arcs are defined with little ambiguity, though the northeast- and west-Japan arcs are collectively treated as the Honshu arc in this study. Inter-arc deformation between the Kuril and Honshu arcs is characterized by EW contraction, the Izu–Bonin and Honshu arcs by NS to NW–SE contraction, and the Ryukyu and Honshu arcs by NS extension with EW contraction. Regarding intra-arc deformation, the Kuril arc shows high strain rates from the Pacific coast to the back of the volcanic arc, the northernmost part of the Izu–Bonin arc shows significant EW to NE–SW extension, and the Ryukyu arc shows NS extension with EW contraction similar to the inter-arc deformation with the Honshu arc, although the EW contraction is weaker to the south. The Honshu arc shows zones of high strain rates along the eastern margin of the Japan Sea via the Niigata–Kobe tectonic zone (NKTZ) to the Median Tectonic Line and along the Ou-backbone Range, while it also shows low strain rates in the Chugoku district and in the zone from northern Ibaraki prefecture via the northern Kanto district to northern Aichi prefecture, which is named the Hitachi–Mikawa forearc low strain-rate zone (HMLSZ).
View full abstractDownload PDF (6050K) -
Takeshi YOSHIDA, Osamu KAZAOKA, Takashi KUSUDA, Kunio FURUNO, Atsushi ...2022 Volume 131 Issue 5 Pages 497-519
Published: October 25, 2022
Released on J-STAGE: November 10, 2022
JOURNAL FREE ACCESSAt Kujukuri Beach, Chiba, Japan, the Holocene series unconformably overlies the Pleistocene Kazusa Group, which was deposited mainly in the deep sea and contains natural gas (methane) dissolved in water. These conditions allow gas to emerge from the ground as it moves upward through faults and sandy layers. In 2007, some tidal pools at Kujukuri Beach became cloudy white, and water clouding still persists in areas where the tidal pools overlap with methane gas emissions on the beach at low tide. Water clouding occurs when yellow groundwater in a strongly reducing state is produced because underground methane gas is discharged through the beach surface into tidal pools, and comes into contact with the atmosphere or seawater. A survey conducted in April 2009 confirmed that tidal pools change from being transparent to yellowish white, then become white, yellowish white, yellow, and yellowish white, and again transparent. Accordingly, in this study, this phenomenon is analyzed and elucidated using groundwater level measurements. The rate of discharge of yellow groundwater declined as tide level decreased, and the water turned white at the lowest tide. As the tide level increased, the water again turned yellow as yellow groundwater emerged from the bottoms of the tidal pools. Seawater flowed into the tidal pools as the tide level further increased, causing seawater in the pools to become yellowish white and transparent.
View full abstractDownload PDF (5096K) -
Makoto YANAGIDA, Michiharu IKEDA, Naoki NISHIZAKA, Kozo ONISHI, Kazuna ...2022 Volume 131 Issue 5 Pages 521-544
Published: October 25, 2022
Released on J-STAGE: November 10, 2022
JOURNAL FREE ACCESS
Supplementary materialTerrace profiles along rivers based on accurate correlations of terraces and geochronological examination are needed to reveal regional crustal deformation from the distribution of river terrace surfaces. Tephra beds, which are intercalated or cover terrace sediments, are used as beneficial information to correlate terrace surfaces accurately. On the other hand, in cases lacking tephric sediments, the correlation of terrace surfaces is mainly based on geomorphic characteristics, such as degree of dissection, relative elevation, and geologic properties, such as facies of sediments and weathered degree of terrace gravels. A terrace surface correlation based on qualitative indicators may cause uncertainty or variability depending on the criteria defined in each study. In this research, weathered degree of gravels in terrace sediments is introduced as another quantitative indicator to validate or compensate for the terrace surface correlation. The examination process is as follows. The research target is the Hiji-kawa River in western Shikoku, along which many terrace surfaces (P, HH, H, M, and L) are distributed. Few tephric sediments exist in terrace sediments. The 0.6 Ma tephra is intercalated at the upper part of P Surface deposits. 0.3 Ma tephra is intercalated at the upper part of Hf1 Surface deposits. An analysis of volcanic ash grains suggests that M surfaces are covered with Aso-4 tephra (85 to 90 ka). First, the ages of other non-aged-terrace surfaces are estimated based on height differences from aged-terraces. Second, real density values are measured for several gravels collected from 15 stages of terrace sediments. Finally, measured real density values are normalized by measured values of current riverbed gravels. Relative density values (RDV) show a negative correlation with ages of terrace surfaces. The research results suggest that RDV is very useful for estimating the ages of terrace surfaces without tephric sediments. The average uplift rates of the middle stream and downstream along the Hiji-kawa River are calculated to be 0.17-0.18 mm/yr. There are no nick points in the current riverbed slope and the spatial distribution of each terrace surface. These results indicate that there is no local topographic deformation due to faulting and folding around the Hiji-kawa River valley.
View full abstractDownload PDF (5824K)
-
Michio NOGAMI2022 Volume 131 Issue 5 Pages 545-556
Published: October 25, 2022
Released on J-STAGE: November 10, 2022
JOURNAL FREE ACCESSM. Hoyanagi pointed out a position deviation of Kyushu Island on an Inoh map with a scale of 1 to 216000. He explained it referring to the map projection adopted by Inoh and the magnetic declination at the beginning of 19th century. In this study, the correlation between the coordinate value of an astronomical observation point on the map and the corresponding location (latitude and longitude) on the actual map is statistically analyzed. The coefficients of determination (R2) are calculated for maps rotated by small degrees. As a result, anticlockwise rotation of the map by 0.975 degree gave the max value of R2 (0.9995). This value corresponds to a magnetic declination of about 1.0 degree to the west at that time in the central region of Kyushu Island. It is concluded that the position deviation on the map is caused by magnetic declination, because Inoh considered magnetic north to be true north when surveying and mapping.
View full abstractDownload PDF (1350K)
-
Yuichi NIWA, Toshihiko SUGAI2022 Volume 131 Issue 5 Pages 557-563
Published: October 25, 2022
Released on J-STAGE: November 10, 2022
JOURNAL FREE ACCESS
Supplementary materialTo present meaningful information about the progress of flood hazard prediction at the alluvial plain, first, the relationships between geomorphological land classifications of the Hachinohe plain, Aomori Prefecture, conducted for three different periods, are considered; then, the relationships between landforms and flood hazards are discussed through a comparison of geomorphological land classification maps with flood hazard maps of the plain. All three landform classification maps show the distribution of lowlands, which consist of floodplain, natural levee, present and abandoned channel, and beach ridge, and surrounding terrace surfaces. However, the geomorphological land classification in the older two maps (published in 1977 and 2015), conducted mainly by interpreting aerial photographs, provides a different interpretation; part of floodplain in the 2015 map is shown as a terrace surface in the 1977 map. The newest map, dated 2021, which incorporates sedimentary facies and formation age of the geomorphic surface, indicates that the difference in interpretation between the older two maps can be explained by the lowland of the Hachinohe plain being divided into Middle to Late Holocene fluvial terrace surface (alluvial surface I) and Late Holocene to modern lowermost floodplain (alluvial surface II). A comparison of the geomorphological land classification map with the flood hazard map shows that both alluvial surfaces I and II are correlated with the conceivably flooded area at the assumed highest precipitation, and that these surfaces are divided into areas where rapid evacuation is necessary (alluvial surface II) and unnecessary (alluvial surface I). These investigations suggest that the lowermost terrace can be flooded at the assumed highest precipitation and that identifying the lowermost terrace can contribute to predicting the spatial distribution of degree of flooding. To understand general features of flooding at the lowermost terrace, further examinations are necessary at other alluvial plains on the relationship between landform and flooding.
View full abstractDownload PDF (4987K)
- |<
- <
- 1
- >
- >|