Magnetic Resonance in Medical Sciences
Online ISSN : 1880-2206
Print ISSN : 1347-3182
ISSN-L : 1347-3182
20 巻, 2 号
選択された号の論文の12件中1~12を表示しています
Reviews
  • Mami Iima
    2021 年 20 巻 2 号 p. 125-138
    発行日: 2021年
    公開日: 2021/06/01
    [早期公開] 公開日: 2020/06/15
    ジャーナル オープンアクセス

    Recent developments in MR hardware and software have allowed a surge of interest in intravoxel incoherent motion (IVIM) MRI in oncology. Beyond diffusion-weighted imaging (and the standard apparent diffusion coefficient mapping most commonly used clinically), IVIM provides information on tissue microcirculation without the need for contrast agents. In oncology, perfusion-driven IVIM MRI has already shown its potential for the differential diagnosis of malignant and benign tumors, as well as for detecting prognostic biomarkers and treatment monitoring. Current developments in IVIM data processing, and its use as a method of scanning patients who cannot receive contrast agents, are expected to increase further utilization. This paper reviews the current applications, challenges, and future trends of perfusion-driven IVIM in oncology.

    Editor's pick

  • Yasuo Amano, Yuko Omori, Chisato Ando, Fumi Yanagisawa, Yasuyuki Suzuk ...
    2021 年 20 巻 2 号 p. 139-151
    発行日: 2021年
    公開日: 2021/06/01
    [早期公開] 公開日: 2020/05/11
    ジャーナル オープンアクセス

    Late gadolinium enhancement (LGE) magnetic resonance imaging (MRI) is valuable for diagnosis and assessment of the severity of various myocardial diseases owing to its potential to visualize myocardial scars. T1 mapping is complementary to LGE because it can quantify the degree of myocardial fibrosis or edema. As such, T1-weighted imaging techniques, including LGE using an inversion recovery sequence, contribute to cardiac MRI. T2-weighted imaging is widely used to characterize the tissue of many organs. T2-weighted imaging is used in cardiac MRI to identify myocardial edema related to chest pain, acute myocardial diseases, or severe myocardial injuries. However, it is difficult to determine the presence and extent of myocardial edema because of the low contrast between normal and diseased myocardium and image artifacts of T2-weighted images and the lack of an established method to quantify the images. T2 mapping quantifies myocardial T2 values and help identify myocardial edema. The T2 values are significantly related to the clinical symptoms or severity of nonischemic cardiomyopathy. Texture analysis is a postprocessing method to quantify tissue alterations that are reflected in the T2-weighted images. Texture analysis provides a variety of parameters, such as skewness, entropy, and grey-scale non-uniformity, without the need for additional sequences. The abnormal signal intensity on T2-weighted images or T2 values may correspond to not only myocardial edema but also other tissue alterations. In this review, the techniques of cardiac T2 mapping and texture analysis and their clinical relevance are described.

Major Papers
  • Yasuo Takatsu, Masafumi Nakamura, Satoshi Kobayashi, Tosiaki Miyati
    2021 年 20 巻 2 号 p. 152-159
    発行日: 2021年
    公開日: 2021/06/01
    [早期公開] 公開日: 2020/05/27
    ジャーナル オープンアクセス

    Purpose: To investigate whether the contrast enhancement effect in hepatobiliary phase (HBP) images can be predicted using transitional phase (3-min delay) images on liver magnetic resonance imaging (MRI) based on the quantitative liver–spleen contrast ratio (Q-LSC) and albumin–bilirubin (ALBI) grade.

    Methods: Overall, 212 patients (124 men and 88 women; mean age 66.7 ± 11.1 years) who underwent blood tests (assessed within 1 month of performing MRI) were included; patients with diffuse tumor, hepatectomy, splenectomy, Gamna–Gandy bodies in the spleen, and movement artifacts were excluded. Q-LSC was calculated using the signal intensity of the liver divided that of the spleen. Q-LSC > 1.5 (cut-off value) indicates a relatively higher sensitivity for detecting of hepatic lesions. To predict the contrast enhancement effect in HBP using Q-LSC of 3-min delay images, Q-LSC of 10- and 15-min delay images were compared for each ALBI grade based on Q-LSC of 3-min delay images. Furthermore, to verify the accuracy of this prediction, the proportion of cases with Q-LSC > 1.5 in 10- and 15 min delay images was calculated based on Q-LSC on 3-min delay images.

    Results: The higher the Q-LSC on the 3-min delay image, the higher was the Q-LSC on its 10- and 15-min delay images. The proportion of cases with Q-LSC > 1.5 in 10- and 15-min delay images was higher for ALBI grade 1 than for ALBI grades 2 and 3 even in the same Q-LSC on 3-min delay images. Q-LSC was <1 in a 3-min delay image and <1.5 in a 15-min delay image in 62.2% of patients with ALBI grade 1 and 82.1% of patients with ALBI grades 2 and 3.

    Conclusion: The liver contrast enhancement effect in HBP images could be predicted using a 3-min delay image based on Q-LSC and ALBI grade.

  • Shigeyoshi Soga, Taro Koyama, Ayako Mikoshi, Tatsuhiko Arafune, Makoto ...
    2021 年 20 巻 2 号 p. 160-165
    発行日: 2021年
    公開日: 2021/06/01
    [早期公開] 公開日: 2020/05/01
    ジャーナル オープンアクセス

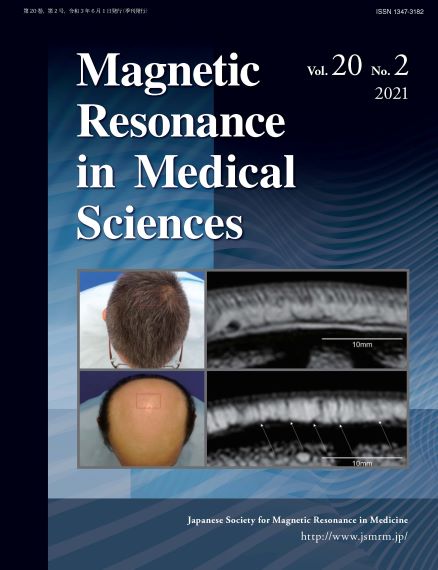
    Purpose: Although androgenetic alopecia (AGA) is a common cause of hair loss, little is known regarding the magnetic resonance imaging (MRI) of the AGA or scalp. This study aimed to analyze whether MRI for hair and scalp (MRH) can evaluate anatomical changes in the scalp caused by AGA.

    Methods: Twenty-seven volunteers were graded for the severity of AGA using the Hamilton–Norwood Scale (HNS), commonly used classification system. All subjects underwent MRH; two radiologists independently analyzed the images. As a quantitative measurement, the number of hair follicles was analyzed and compared with the HNS. As a qualitative analysis, each MRH scan was visually graded in terms of the severity of alopecia, using a 4-point MR severity score. The scores were compared with the HNS.

    Results: The volunteers were divided into two groups of 12 and 15 males without and with AGA at their vertex, respectively. Inter-observer agreements for the hair count and the MR severity score were excellent. The mean hair count on MRI in the normal group was significantly higher than that in the AGA group (P < 10−4). The MR severity score in the AGA group was significantly more severe than that in the control group (P < 10−4). In terms of the presence or absence of thinning hair, the MR severity score was consistent with the HNS determined by a plastic surgeon in 96% of cases. MR severity scores of clinically moderate AGA cases were significantly lower than those of severe cases (P = 0.022).

    Conclusion: MRH could depict scalp anatomy showing a clear difference between AGA and normal scalps, in both hair count and subjective visual assessment. The MR severity score was in good agreement with the clinical stages by HNS. The results support the potential of MRH as a promising imaging technique for analyzing healthy and pathological scalps.

  • Naoya Furuhashi, Shiho Okuhata, Tetsuo Kobayashi
    2021 年 20 巻 2 号 p. 166-174
    発行日: 2021年
    公開日: 2021/06/01
    [早期公開] 公開日: 2020/05/11
    ジャーナル オープンアクセス

    Purpose: To analyze subcortical brain volume more reliably, we propose a deep learning segmentation method of subcortical brain based on magnetic resonance imaging (MRI) having high generalization performance, accuracy, and robustness.

    Methods: First, local images of three-dimensional (3D) bounding boxes were extracted for seven subcortical structures (thalamus, putamen, caudate, pallidum, hippocampus, amygdala, and accumbens) from a whole brain MR image as inputs to the neural network. Second, dilated convolution layers, which input information of variable scope, were introduced to the blocks that make up the neural network. These blocks were connected in parallel to simultaneously process global and local information obtained by the dilated convolution layers. To evaluate generalization performance, different datasets were used for training and testing sessions (cross-dataset evaluation) because subcortical brain segmentation in clinical analysis is assumed to be applied to unknown datasets.

    Results: The proposed method showed better generalization performance that can obtain stable accuracy for all structures, whereas the state-of-the-art deep learning method obtained extremely low accuracy for some structures. The proposed method performed segmentation for all samples without failing with significantly higher accuracy (P < 0.005) than conventional methods such as 3D U-Net, FreeSurfer, and Functional Magnetic Resonance Imaging of the Brain’s (FMRIB’s) Integrated Registration and Segmentation Tool in the FMRIB Software Library (FSL-FIRST). Moreover, when applying this proposed method to larger datasets, segmentation was robustly performed for all samples without producing segmentation results on the areas that were apparently different from anatomically relevant areas. On the other hand, FSL-FIRST produced segmentation results on the area that were apparently and largely different from the anatomically relevant area for about one-third to one-fourth of the datasets.

    Conclusion: The cross-dataset evaluation showed that the proposed method is superior to existing methods in terms of generalization performance, accuracy, and robustness.

  • Toshio Ohashi, Shinji Naganawa, Saeko Iwata, Kayao Kuno
    2021 年 20 巻 2 号 p. 175-181
    発行日: 2021年
    公開日: 2021/06/01
    [早期公開] 公開日: 2020/07/09
    ジャーナル オープンアクセス

    Purpose: Leakage of a small amount of intravenously administered gadolinium-based contrast agents (GBCAs) into the cerebrospinal fluid (CSF) space has been reported, even in healthy subjects without blood–brain barrier disruption. Several candidates including the choroid plexus and cortical veins have been proposed as the source of the leakage. The purpose of this study was to evaluate the distribution of intravenously administered GBCA leakage into the CSF by comparing the contrast enhancement of the cerebral cisterns to the lateral ventricles (LVs).

    Methods: In 26 patients with a suspicion of endolymphatic hydrops (21–80 years old), a three-dimensional real inversion recovery (3D-real IR) image was obtained at pre-, and at 5 min, and 4 h post-intravenous administration of a single dose of GBCA (IV-SD-GBCA). In the 3D-real IR image, the signal intensities (SIs) in the anterior horn of the LV (LVante), the trigone of the LV (LVtri), the Sylvian fissure (SyF), the ambient cistern (Amb), the prepontine cistern (PPC), the cerebellopontine angle cistern (CPA), and the vitreous (Vit) were measured. The differences in the SI at pre-, and at 5 min and 4 h post-IV-SD-GBCA were evaluated for each region. The change in the SI pre- to post-IV-SD-GBCA (SIchange) were calculated for each region. The differences in the SIchange in each region were evaluated at 5 min and 4 h post-IV-SD-GBCA. A Steel-Dwass’s test was applied to correct for multiple comparisons.

    Results: The SIs of all regions at 4 h post-IV-SD-GBCA were significantly higher compared with pre-IV-SD-GBCA (P < 0.05). The SIchange in the SyF, Amb, PPC, and the CPA were significantly higher compared with those of the LVante, LVtri, and the Vit at 4 h post-IV-SD-GBCA (P < 0.05).

    Conclusion: The contrast enhancement in the cerebral cisterns was greater than that in the LVs.

  • Yasuo Takatsu, Rei Yoshida, Kenichiro Yamamura, Yuya Yamatani, Tsuyosh ...
    2021 年 20 巻 2 号 p. 182-189
    発行日: 2021年
    公開日: 2021/06/01
    [早期公開] 公開日: 2020/06/26
    ジャーナル オープンアクセス

    Purpose: To determine which sequence for frequently used general contrast-enhanced brain MRI shows the least radiofrequency shielding effect of a titanium mesh in cranioplasty using a phantom.

    Methods: A 1.5T MRI scanner was used. Frequently used general 2D and 3D spin-echo sequences (SE) and T1 spoiled gradient echo sequences (GRE) used for MRI in clinical settings were adopted in this study. A titanium mesh was placed above a cubic phantom containing manganese chloride tetrahydrate and sodium chloride. The signal attenuation ratio and normalized absolute average deviation (NAAD) were calculated. Moreover, the flip angle (FA) dependency in SE and area of excitation dependency in 3D sequences were analyzed using NAAD.

    Results: The signal attenuation ratio at the position nearest to the titanium mesh for 2D SE was 71.8% larger than that at the position nearest to the titanium mesh for 3D GRE. With regard to NAAD, 3D GRE showed the highest values among the sequences. When FA was increased, radiofrequency shielding effect was improved. There were no significant differences between the narrow and wide area of excitation. 3D GRE showed the least radiofrequency shielding effect, and it was considered as the optimal sequence for MRI in the presence of a titanium mesh.

    Conclusion: 3D GRE shows the least radiofrequency shielding effect of a titanium mesh after cranioplasty among frequently used general sequences for contrast-enhanced brain MRI.

  • Shohei Ouchi, Satoshi Ito
    2021 年 20 巻 2 号 p. 190-203
    発行日: 2021年
    公開日: 2021/06/01
    [早期公開] 公開日: 2020/07/02
    ジャーナル オープンアクセス

    Purpose: A deep residual learning convolutional neural network (DRL-CNN) was applied to improve image quality and speed up the reconstruction of compressed sensing magnetic resonance imaging. The reconstruction performances of the proposed method was compared with iterative reconstruction methods.

    Methods: The proposed method adopted a DRL-CNN to learn the residual component between the input and output images (i.e., aliasing artifacts) for image reconstruction. The CNN-based reconstruction was compared with iterative reconstruction methods. To clarify the reconstruction performance of the proposed method, reconstruction experiments using 1D-, 2D-random under-sampling and sampling patterns that mix random and non-random under-sampling were executed. The peak-signal-to-noise ratio (PSNR) and the structural similarity index (SSIM) were examined for various numbers of training images, sampling rates, and numbers of training epochs.

    Results: The experimental results demonstrated that reconstruction time is drastically reduced to 0.022 s per image compared with that for conventional iterative reconstruction. The PSNR and SSIM were improved as the coherence of the sampling pattern increases. These results indicate that a deep CNN can learn coherent artifacts and is effective especially for cases where the randomness of k-space sampling is rather low. Simulation studies showed that variable density non-random under-sampling was a promising sampling pattern in 1D-random under-sampling of 2D image acquisition.

    Conclusion: A DRL-CNN can recognize and predict aliasing artifacts with low incoherence. It was demonstrated that reconstruction time is significantly reduced and the improvement in the PSNR and SSIM is higher in 1D-random under-sampling than in 2D. The requirement of incoherence for aliasing artifacts is different from that for iterative reconstruction.

  • Ayami Ohno Kishimoto, Masako Kataoka, Mami Iima, Maya Honda, Kanae Kaw ...
    2021 年 20 巻 2 号 p. 204-215
    発行日: 2021年
    公開日: 2021/06/01
    [早期公開] 公開日: 2020/07/02
    ジャーナル オープンアクセス

    Purpose: We aimed to investigate the performance of high resolution-diffusion-weighted imaging (HR-DWI) using readout-segmented echo-planar imaging in visualizing malignant breast lesions and evaluating their extent, using pathology as a reference.

    Methods: This retrospective study included patients who underwent HR-DWI with surgically confirmed malignant breast lesions. Two radiologists blinded to the final diagnosis evaluated HR-DWI independently and identified the lesions, measuring their maximum diameters. Another radiologist confirmed if those lesions were identical to the pathology. The maximum diameters of the lesions between HR-DWI and pathology were compared, and their correlations were calculated using Spearman’s correlation coefficient. Apparent diffusion coefficient (ADC) values of the lesions were measured.

    Results: Ninety-five mass/64 non-mass lesions were pathologically confirmed in 104 females. Both radiologists detected the same 93 mass lesions (97.9%). Spearman’s correlation coefficient for mass lesions were 0.89 and 0.90 (P < 0.0001 and 0001) for the two radiologists, respectively. The size differences within 10 mm were 90.3% (84/93) and 94.6% (88/93) respectively. One radiologist detected 35 non-mass lesions (54.7%) and another radiologist detected 32 non-mass lesions (50.0%), of which 28 lesions were confirmed as identical. Spearman’s correlation coefficient for non-mass lesions were 0.59 and 0.22 (P = 0.0002 and 0.22), respectively. The mean ADC value of mass lesions and non-mass lesions were 0.80 and 0.89 × 10⁻³ mm2/s, respectively.

    Conclusion: Using HR-DWI, malignant mass lesions were depicted with excellent agreement with the pathological evaluation. Approximately half of the non-mass lesions could not be identified, suggesting a current limitation of HR-DWI.

Technical Note
Brief Communications
feedback
Top