Abstract
Hydrogen ingressed into steels has been treated as one of detrimental factors causing the hydrogen-induced damages or failures and its concentrations is generally measured by a hot extraction system calibrated with references. High concentration references above 50.00 wppm is proposed to solve the bottlenecks of conventional references such as thermal instability and lower hydrogen concentrations at room temperature; by varying a mixing amount of titanium hydride as a hydrogen source with its balancing iron bead, the synthesized reference has freely controlable hydrogen concentration and also showed a good thermal stability at room temperature. Hydrogen residue in the iron bead was controlled less than 0.13 wppm by an optimized procedure including wet cleaning and thermal soaking at 300°C for 3 minute. Hydrogen weight fraction in the titanium hydride was calculated by 0.04 based on the assumption of the stoichiometric composition (or TiH2). Hot extraction measurements and theoretical calculations of the hydrogen concentrations were done for the hydride-containing iron beads. Both data showed a good linear correlation each other and a validity of the proposed concept is confirmed emprically.
1. Introduction
High-strength steels used in the fields of petro-chemical plants, steel-making facilities, natural gas transmission pipelines, and new energy facilities are often subjected to catastrophic failures.1) These failures have been generally attributed to the hydrogen-induced damages implying absorption, diffusion, trapping, and interactions of hydrogen atoms in steels.2,3) Furthermore, complex microstructures due to severe deformation,4,5) microalloying6) and local welding7) imply significant hydrogen trapping sources and also can contain bulk hydrogen concentrations higher than 10 wppm. An amount of the hydrogen penetration is measured by a hot extraction method; by heating a testing sample rapidly, hydrogen atoms located in lattices and trapped in defects are activated and diffuse out from the metallic sample. The released hydrogen is measured with the precise detectors such as thermal conductivity cell, pulsed discharge detector, flame ionization detector, etc. A calibration of the detectors with reference materials (RMs) is of importance for measuring the hydrogen concentrations quantitatively. Hydrogen gas quantitatively mixed with an inert gas can be used as the hydrogen reference material. However, its flammability and handling difficulties lead to limited uses for the hot extraction test. The other kind of the commericalized reference material is produced by a thermal hydrogen-charging method; metal chips are exposed to the hydrogen gas at elevated temperatures higher than 500°C.8) Hydrogen molecules attached on the metal surface disassociate into atoms and diffuse into the metal chips. The hydrogen atoms locate among the metal lattices as interstitial defects and this type of the hydride is called as a solid solution. If the hydrogen atoms does not form covalent or ionic bonds with the host atoms, a hydrogen weight fraction of the solid solution is limited less than 50 wppm due to the rare hydrogen solubility in metals at ambient temperature. For example, the maximum solubility of hydrogen in pure iron has been reported by 0.9 wppm in the temperature range 80 to 140°C.9) A significant diffusivity of the hydrogen even at room temperature makes the RMs thermally unstable. It means that durability of the hydrogen RM can be an important issue. Electropositive metals including Ti, Zr, Hf and Zn form strong compounds with a stoichiometic hydrogen composition and thus resulting metal hydrides shows a good thermal stability at room temperature. They are decomposed into pure metals and hydrogen gas by heating10) and can be hydrogen sources for the reference materials. If the stoichoimetric compositions are considered, several weight percents of hydrogen are attainable with the metal hydrides. Thus, higher hydrogen concentrations above 50 wppm are easily achieveable with a metal hydride by controlling its balancing weight.
In this study, a metal hydride-containing, reference material was realized by encapsulating a titanium hydride powder into balancing iron beads. Hydrogen concentrations of the suggested reference materials were estimated by a theoretical calculation and compared with empirically released results; a linear proportional relationship was identified and quantitative concentrations were comparable between theoretical and empirical results. A slight discrepancy was discussed from the viewpoint of a non-stoichiometry of the metal hydride and a possiblity of its correction was considered from a thermogravimetric analysis.
2. Experimental Procedures
A bead less than 8 mm in diameter was machined from a 99.99% pure iron rod (LTS Research Lab., Inc, United States) and a straight hole with 2 mm in diameter and 4 mm in depth was formed on the bead surface for encapsulating a hydride powder. A series of surface cleanings were done for the iron bead to remove hydrogen-related contaminants and hydrogen residue in the bead was measured after each cleaning step; ultrasonic cleanings were done in acetone and etyl-alcohol for 5 minute each successively and then thermal soakings in a nitrogen gas were done for 3 minute with different temperatures from 100°C to 500°C. In order to determine the lowest hydrogen concentrations and saturation temperature, a series of hot extraction tests was done for the cleaned iron beads with an OH-900 hydrogen determinator (ELTRA GmbH, Germany).
A 98.0% pure titanium hydride (Sigma-Aldrich Co., United States) was selected for charging into the iron bead and its chemical stoichiometry was considered for calculating the hydrogen weight fraction. Main and impurity phases in the titanium hydride were analysed with a Dmax 2200 X-ray diffractometer (Rigaku, Japan). X-ray diffraction data were measured over the scattering angle range 30° ≤ 2θ ≤ 120° at a 2θ step of 0.02° using CuKα radiation with a graphite monochromator in the reflection geometry at room temperature. The EXPGUI program, which is a graphical user interface for the General Structure Analysis System (GSAS) using the pseudo-Voigt function as a profile function, was used to perform the structural refinement.12,13) A thermal dissociation of the titanium hydride was measured using a SDT Q600 thermogravimetric analyser (TA Instruments, United States). A small amount of hydride powder loaded on an alumina pan was heated up to 800°C with the heating rate of 0.17°C/s under an argon gas environment. 99.9997% argon gas used as a carrier gas contains water residue less than 0.5 vppm and has its dew point at –80.4°C. The dew point is low enough to avoid moisture effects on the thermal dissociation. The titanium hydride powder was charged into the iron bead and carefully capped with a plug. An amount of the titanium hydride and its weight fraction compared to the whole iron bead were measured from both weights of the iron bead before and after the hydride encapsulation. The microbalance used was a WX-26 model (Mettler Toledo Int’l Inc., Italy) with a resolution of 1 μg and calibrated with the standards weights from 10 mg to 20 g in the KRISS. For the hydride-containing iron beads, the hot extraction tests were carried out using the OH-900 hydrogen determinator.
3. Results and Discussion
3.1. Optimized Preparation for the Iron Beads and Impurity Analysis in the Hydride
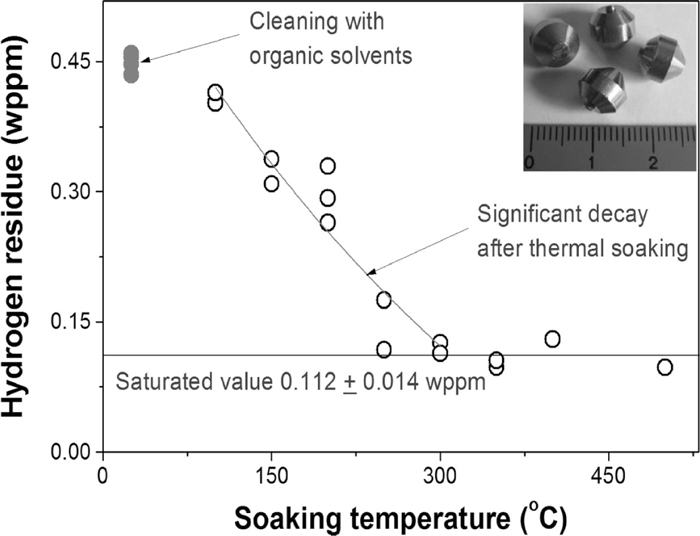
Hydrogen residue in the iron beads were measured after each cleaning step with a series of the hot extraction experiments. The surface cleanings with two organic solvents (solid circles in Fig. 1) leaded to hydrogen residue of 0.449±0.011 wppm in the iron beads. The subsequent thermal soaking reduced the hydrogen residue drastically and finally resulted in less than 0.13 wppm above 300°C. The saturated hydrogen residue at high temperatures was 0.112±0.014 wppm. This means that the hydrogen residue less than 0.13 wppm cannot be effectively removed by the wet- and dry-cleaning procedures and this value is attributed to the inherent hydrogen residue of the pure iron rod.
To characterize impurity phases except for TiH2 as a main phase, X-ray diffraction patterns were measured for the titanium hydride powder and plotted in Fig. 2. Plus marks (+) representing the observed intensities are overlapped with the calculated solid line. All reflection peaks of the TiH2 powder whose locations were marked with ticks in Fig. 2 were indexed via the Pawley refinement using the lattice parameters and the space group for the cubic crystal system with the space group Fm-3m. The Pawley refinement showed that the lattice parameter of TiH2 was a(=b=c)=4.5222(2) Å. Impurity peaks marked with triangles in Fig. 2 matched well with those of the Ti phase which has the hexagonal crystal system with the space group P6/mmm. The lattice parameters of the Ti phase were a(=b)=4.6582(1) and c=2.8256(2)) Å. Origin of the Ti impurity could be explained from non-hydrogenated cores in the titanium hydride particles.
3.2. Synthesis of the Hydrogen References and their Thermal Extractions
The iron beads cleaned with an optimized procedure including the cleaning with organic solvents and thermal soaking at 300°C were charged with the titanium hydride powder. Both weights of the iron beads before and after the hydride charging were measured with the microbalance. Hydrogen concentration of each bead was calculated by considering a weight fraction of the hydrogen to the whole hydride-charged iron bead shown in Eq. (1).
|
C
H
Cal
=
W
H
W
MH
+
W
B
=
W
H
W
M
+
W
H
+
W
B
| (1) |
where W
MH and W
B mean the weights of the metal hydride, and iron bead, respectively. In detail, the weight of the metal hydride consists of both weights of the metal and hydrogen included. Conclusively, the theoretical hydrogen weight W
H is expressed by 0.040 W
MH by considering the stoichiometric composition of the TiH
2. At the same time, the hydride-containing iron beads were degassed using the hot extraction system and the released hydrogen was quantitatively measured with a thermal conductivity detector. This thermal conductivity detector was calibrated with 10 and 50 wppm hydrogen gas references diluted with a nitrogen gas. Both hydrogen concentrations determined from the theoretical calculations and the experimental measurements are compared in
Fig. 3. As might be expected, a linear proportional relationship was identified between both data. However, the linear relationship showed a slight deviation from the ideal line shown as a dashed line in
Fig. 3. The measured slope higher than 1.0 means that the calculated hydrogen concentrations is somewhat overestimated and this is attributed to a non-stoichiometry of the hydride;
6) actually the titanium hydride is expressed by TiH
2–x and the location and deficit of the hydrogen atoms in the hydride lattices are generally analysed using a low-temperature neutron spectroscopy. However, an extractable weight fraction of the hydrogen in the metal hydride is of interest in this study.
3.3. Hydrogen Concentrations Re-calculated Based on the Calorimetric Analysis of the Titanium Hydride
A thermogravimetric analysis was carried out for the titanium hydride powder. Weight variation of the hydride powder was profiled with the temperature increase (see Fig. 4). A significant weight loss and corresponding peak of the heat flow in the differential scanning calorimetry explained that the de-hydrogenation reaction started around 515°C. The extractable hydrogen fraction calculated from the hydride weight loss in Fig. 4 is 0.017±0.001 which is too low to compare with the theoretical fraction of 0.040. This is attributed to a continuous weight gain due to oxidation of the pre-existing and the de-hydrogenated titanium particle was identified higher than 400°C. Thus the weight loss due to the de-hydrogenation can be partially compensated with the weight gain due to the oxidation and it causes the underestimates in the extractable hydrogen fraction. While the differential scanning calorimetry produced a clear heat flow peak corresponding to the de-hydrogenation reaction and also showed a monotonically increasing background before and after the hydrogen release. A constant slope can be fitted from 250°C to 800°C excepting the de-hydrogenation regime between 420°C and 680°C (see Fig. 4). Generally, an oxidation reaction produces heat and can form a heat flow peak along to the opposite direction of the de-hydrogenation heat peak. However, exothermic heat flow peaks related to the titanium oxidation cannot be found and thus it is considered that the oxidation effects are implicit in the background surrounding the de-hydrogenation heat flow peak. Thus, it is assumed that the decomposition or formation enthalpy of the titanium hydride can be measured from an integrated area inside of the endothermic heat flow peak by extracting the background signals properly. The integrated heat flow was –106.15±3.61 kJ/mol. This experimental heat flow increases with a decrease of x value and finally saturates to the theoretical formation enthalpy for the stoichiometric titanium hydride or TiH2. From a Herbst’s previous study,11) the theoretical enthalpy for TiH2 formation is calculated by –111.00 kJ/mol. If the heat flow varies linearly with the compositional factor, (2–x), the nonstoichiometric factor, x can be estimated from a ratio of the integrated heat flow and the theoretical enthalpy for the stoichiometric hydride. The enthalpy ratio determined was 0.96±0.03 and thus the non-stoichiometric factor x was 0.087±0.065. It means that the titanium hydride used in this study has an equivalent chemical composition of TiH1.913.

The extractable hydrogen fraction re-calculated from Eq. (1) based on that the predicted chemical composition TiH1.913 was 0.039. Finally, the hydrogen concentrations from the synthesized references were re-calculated by replacing WH by 0.039 WMH in Eq. (1). The re-calculated values are overlapped on the data obtained from Section 3.2 in Fig. 3; fitting slope of the linear proportional relationship approach to the unity and this means the effective chemical composition estimated from the calorimetric data of the titanium hydride was successful.
4. Conclusions
A concept of the hydride-mixing reference was proposed instead of conventional hydrogen gas reference and it was realized by adopting titanium hydride and iron bead as a hydrogen source and its balance weight, respectively. By encapsulating given amounts of the metal hydride into actually hydrogen-free iron beads, hydrogen references with high hydrogen concentrations up to 150 wppm were synthesized. Theoretical and experimental analyses for the synthesized references were done with a series of thermo-physical measurements and the stochiometric consideration. The important results are summarized as below:
(1) By a series of wet-cleanings and thermal soaking experiments, hydrogen residue less than 0.13 wppm could be obtained for the iron beads.
(2) Hydrogen concentration in the synthesized reference was calculated using both weights of the metal hydride and the iron bead by assuming the stoichiometric composition of the titanium hydride (TiH2).
(3) The theoretically calculated hydrogen concentrations were linear proportional to the hot extraction data, however their quantitative values were slightly higher than the empirically measured values.
(4) This discrepancy was attributed to the non-stochiometry of the metal hydride and the effective hydride composition estimated from the ratio of the de-hydrogenation heat flux to the theoretical hydride formation enthalpy was TiH1.913.
(5) The hydrogen concentrations in the synthesized references re-calculated by considering the effective hydride composition were very close to the experimentally measured values.
Acknowledgement
This research was partly supported by the Converging Research Center Program funded by the Ministry of Education, Science and Technology (2014048831) and by the Korea Research Council of Fundamental Science and Technology (KRCF) through National Agenda Project.
References
- 1) E. Dabah, T. Kannengiesser, D. Eliezer and T. Boellinghaus: Mater. Sci. Eng. A, 528 (2011), 1608.
- 2) Y. Takahashi, J. Sakamoto, M. Tanaka, K. Higashida and H. Noguchi: Scr. Mater., 64 (2011), 721.
- 3) J. Song and W. A. Curtin: Acta Mater., 59 (2011), 1557.
- 4) B. A. Szost, R. H. Vegter and P. E. J. Rivera-Diaz-del-Castillo: Metall. Mater. Trans. A, 44 (2013), 4542.
- 5) L. Zhang, B. An, S. Fukuyama, T. Iijima and K. Yokogawa: J. Appl. Phys., 108 (2010), 063526.
- 6) H. Asahi, D. Hirakami and S. Yamasaki: ISIJ Int., 43 (2003), 527.
- 7) Y. D. Park, I. S. Maroef, A. Landau and D. L. Olson: Weld. J., 81 (2002), 27-S.
- 8) National Institute of Standards and Technology, Gaithersburg, MD, (2005), URL: https://www-s.nist.gov/srmors/certificates/2452.pdf., (accessed 2014-7-25).
- 9) W. Y. Choo, J. Y. Lee and C. G. Cho: J. Mater. Sci., 16 (1981), 1285.
- 10) H. R. Z. Sandim, B. V. Morante and P. A. Suzuki: Mater. Res., 8 (2005), 293.
- 11) J. F. Herbst: J. Alloys Compd., 337 (2002), 99.
- 12) A. C. Larson and R. B. Von Dreele: Los Alamos National Laboratory Report LAUR 86-748, Los Alamos National Laboratory, Los Alamos, (2004).
- 13) B. H. Toby: J. Appl. Cryst., 34 (2001), 210.

