Abstract
Experiments were carried out to measure mixing time and slag eye area in two different water model ladles with gas injection nozzle located at the mid bath radius position. Within the range of experimental conditions studied, the following correlations (in SI unit), for 95% mixing time and slag eye area, were found to work satisfactorily:
In the above equations, Q is the gas flow rate (corrected to mean height and temperature of the liquid)(m3/s), L is the liquid depth (m), R is the vessel radius (m), ΔL is the slag layer thickness (m), υs is the kinematic viscosity (m2/s) of the upper phase, ρL is the bulk liquid density (kg/m3), τmix,95% is the mixing time (s), Aes is the slag eye area (m2), UP is the average plume rise velocity (m/s), g is the gravitational acceleration (m/s2) and Δρ is the metal-slag density differential (kg/m3). Based on the above and a set of four different bounds on (i) specific energy input rate, (ii) ladle aspect ratio, (iii) amount of liquid in ladle and (iv) slag layer thickness, a multi-objective, constrained optimization problem was formulated to investigate inert gas injection in steelmaking ladles. To this end, a Genetic Algorithm based optimisation procedure embodied in MATLAB™ was applied. Due to the conflicting nature of the objective functions, a Pareto optimal front, comprising many optimal solutions resulted from which the desirable range of operating parameters was identified. Present study has also indicated that desirable optimal operating conditions are likely to be a function of the location of the porous plug in a ladle. Finally, for the sake of validation, three arbitrarily chosen experimental conditions were evaluated against the relevant Pareto front and it is shown that the chosen conditions are, by and large, sub-optimal.
1. Introduction
The remarkable rate of conversion of liquid steel into a solidified product via continuous casting demands shorter refining periods in primary steelmaking furnaces. This as a consequence necessitates that only decarburization and too some extent, dephosphorisation is carried out in BOF/EAF and final adjustment of composition, cleanliness and temperature, carried out in a separate vessel i.e., a ladle, beyond the primary steelmaking reactor. Such requirements have produced the necessary impetus for the development and growth of a variety of object specific downstream molten steel treatment processes, now integrated routinely with primary steelmaking and casting processes. Collectively, these are referred to as the “ladle metallurgy steelmaking”.
All ladle metallurgy steelmaking operations have one thing in common: these, in one way or other, utilize gas (mostly argon), injected into the melt through one or more porous plugs. The gas rising through the liquid induces a turbulent recirculatory motion which provides the necessary bath agitation for exacerbating the rates of various heat and mass transfer controlled processes such as, melting of deoxidizer and alloying additions as well as their dissolution and dispersion and so on. Depending on the end requirements, a wide range of argon flow rate is used in the industry. Thus, if an intense mixing condition is desired (say, for deep de-sulfurization), a relatively high argon flow rate is typically used (~1 Nm3 /hr/tonne). On the other hand, for thermal and material homogenization, somewhat smaller argon flow rates are applied (~0.1 Nm3/hr/tonne). Intermediate flow rates are generally used during chemistry adjustment and heating in ladle refining furnace (LRF). Pertinent argon flow rate regimes are summarized in Table 1.
Table 1. (a) Argon flow rates during ladle metallurgy steelmaking at two different Indian steel plants and (b) Ladle capacity, aspect ratio, argon flow rates as practiced in five different Indian steel plants.
(a)
| Steelmaker | Ladle Size, tonne | Process | Operating flow rates, Nm3/hr | Actual flow rates, m3/s# | Specific energy input rate, w/kg |
|---|
| # actual flow rates were worked out on the basis of an ambient temperature of 1600°C and a pressure corresponding to the mean bath height, considering ρsteel = 7200 kg/m3. |
| Plant A | 44
(D=2010 mm and L=1814 mm) | Rinsing (Homogenizations) | 5–8 | 53.8×10⁻⁴ to 86.1×10⁻⁴ | 0.015 to 0.024 |
| Arcing | 20–25 | 21.5×10⁻³ to 26.9×10⁻³ | 0.060 to 0.075 |
| Desulphurization in LRF | Not practiced |
| Plant B | 185
(D=3580 mm and L=2625 mm) | Rinsing (homogenization) | 20 | 18.3×10⁻³ | 0.017 |
| Arcing | 80 | 73.2×10⁻³ | 0.068 |
| Desulphurization in LRF | 200 | 18.3×10⁻² | 0.17 |
(b)
| Steelmaker | Ladle capacity and dimensions | L/D | Argon flow rate, Nm3/hr | Specific argon flow rate, Nm3/hr/T | Specific energy input rate, w/kg |
|---|
| Plant A | 44 T(D~2 m & L~1.8 m) | 0.9 | 5–8 | 0.11–0.18 | 0.01–0.019 |
| Plant B | 130 T(D~2.9 m & L~2.8 m) | 0.97 | 24–40 | 0.18–0.30 | 0.02–0.034 |
| Plant C | 160 T(D~3.25 m and L~2.9 m | 0.89 | 18 | 0.1125 | 0.012 |
| Plant D | 185 T(D= 3.5 m & L= 2.6 m) | 0.75 | 20 | 0.11 | 0.012 |
| Plant E | 285 T(D= 3.4 m & L= 4.6 m) | 1.35 | 33 | 0.115 (per plug data) | 0.029 |
As the injected gas escapes to the surrounding, the redirected bulk flow from the spout region (i.e., plume eye) pushes the overlying slag radially outwards, exposing the melt surface to the ambient. The uncovered area of the melt thus created is typically referred to as the “slag eye”. It is to be noted here that slag eye is a potential site for re-oxidation of steel, nitrogen pick-up and slag entrainment/entrapment and hence can influence quality of steel profoundly particularly, beyond vacuum degassing (VD). Therefore, during the final stage of ladle refining and immediately prior to continuous casting, where objective of gas stirring is to primarily prevent material or thermal stratification and exacerbate inclusion floatation, gentle stirring (commonly termed in the industry as “rinsing”) is practiced. This helps contain slag eye area and ensures a moderate mixing efficiency in the bath.
Numerous previous studies1,2,3,4) on argon stirred ladles have indicated that for a given system (bath depth, diameter and slag characteristics remaining unchanged), mixing time decreases according to a third power (i.e., τmix ∞Q−0.33) as gas flow rate is increased. Similarly, more recent works on slag covered ladles5,6,7,8) appear to suggest that slag eye area increases with the increase in argon flow rate and varies as Aeye ∞Q0.88. These functional relationships essentially imply that any attempt to use more than the required argon flow rate (say, to enhance mixing or shortening of processing time), particularly during the final stages of ladle refining, may prove counterproductive since relatively large slag eye area created as a result high gas flow may lead to melt re-oxidation, affecting steel quality adversely. It is instructive to note here that more than the required gas injection not only increases the possibility of atmospheric re-oxidation but also adversely influences phenomena such as refractory dissolution, slag entrainment and so on. This necessitates engineering and optimisation of argon flow rates in order to maximize beneficial effects of argon injection into steelmaking ladles.
Necessary guidelines on optimal argon flow rate can be obtained by formulating and solving a constrained, multi-variable optimization problem given the relationships for mixing times and slag eye area as a function of key operating variables, namely gas flow rates, liquid depth vessel radius, slag thickness and characteristics and so on. Although numerous correlations for mixing time and slag eye area have been reported in the literature,1,2,3,4,5,6,7,8,9,10) these have limited applicability as these were derived for axi-symmetrical gas injection con figuration without any distinct upper phase liquid. Given such, one might therefore anticipate that appropriate correlations for mixing time as well as slag eye area, required to formulate a realistic constrained optimization problem for industrial, ladle metallurgy steelmaking operation (i.e., slag covered ladle with a porous plug located at the mid-bath radius position) are currently not available in the literature.
Consequently, the purpose of the present study has been to develop appropriate mixing time and slag eye area correlations for slag-covered, asymmetrically stirred ladles (plug located at 0.5R) and thereby, formulate and solve a constrained optimization problem to deduce the regime of optimal argon injection rate during inert gas stirring in ladles. In the following, details of physical modelling and experimental measurements of mixing time and slag area are first presented. On the basis of such, a constrained optimization problem has been formulated and solved via the commercially available software MATLAB™. Finally, a few additional water model results are applied and assessed against corresponding optimization calculations to investigate optimality/sub-optimality of the arbitrarily chosen operating conditions.
2. Present Work
2.1. Physical Modeling
The present study, as pointed out already, involves physical modeling of gas stirred ladles containing two immiscible liquids, water and an appropriate buoyant, upper phase. The objective has been to experimentally measure mixing time and slag eye area as a function of operating variables (L, R and Q) as well as various characteristics of the upper phase liquid. To these ends, two different, cylindrical shaped, Perspex™ ladles, available in the author’s laboratory, were applied where-in air was introduced through a basal nozzle, located at the mid bath radius position. Physical dimensions and operating parameters in the model ladle systems vis a vis those in the full scale 50 tonne ladle are summarized in Table 2. There, appropriate range of gas flow rates for the model systems has been deduced in accordance with the Froude scaling criterion10) and represented as:
Table 2. Physical dimensions and operating conditions in full scale and model ladle systems.
| Geometric characteristics | Prototype-(50 ton ladle) | 0.28 scale Model | 0.14 scale Model |
|---|
| Liquid depth (mm) | 2000 | 705 | 359 |
| inner dia. in top (mm) | 2318 | 600 | 300 |
| Inner dia. in bottom (mm) | 2132 | 600 | 300 |
| Argon flow rates, m3/s | 60×10−4 −30×10−3 | 2.5×10⁻⁴ −12×10−4 | 0.44×10⁻⁴ −2.2×10⁻⁴ |
| Purging block location from centre (r/R) | 0.5 | 0.5 | 0.5 |
| Angle of wall inclination, degree | 5 | 0 | 0 |
For geometrically and dynamically similar systems, corresponding mixing times are related via:8)
|
τ
mix,mod
=
λ
0.5
τ
mix,f.s
| (2) |
As demonstrated elsewhere,8) these relationships correspond reasonably well for slag covered gas stirred ladles as well.
In the present study, several different types of liquids were employed to simulate the buoyant slag layer. Key properties of the liquids used in this study are summarisedin Table 3. Although, relevant thermo physical properties of steel–slag system cannot be exactly replicated in water models, experimentation with different buoyant liquids allow us to study the influences the overlying phase are likely to exert on mixing time as well as slag eye area. As seen from Table 3, kinematic viscosity of ladle slag at 1873 K and kinematic viscosity of coconut oil at room temperature are both nearly the same. Similarly, density ratio of water –petroleum ether and steel-slag system are also nearly equivalent. Although, water-mustard oil and water-coconut oil systems have similar density ratio, kinematic viscosity of the two oils used are substantially different from that of ladle slag. Surface tension is not likely to be a critical parameter since slag eye diameter is substantially large and surface tension effects are generally important at smaller dimensions. Mixing time, on the other hand tends to depend more on the thickness rather than thermo physical properties of the upper phase liquid, as previous studies (e.g., see Ref. 11)) have appeared to indicate.
Table 3. Properties of different liquids used in physical modeling investigation.
| S. No | Fluid | Viscosity Pa.s | Density kg/m3 | Density ratio relative to water/steel | Kinematic Viscosity, m2/s |
|---|
| 1 | Water | 0.9125×10⁻³ | 1000 | 1 | 0.912500×10⁻⁶ |
| 2 | Petroleum ether | 0.38×10⁻³ | 640 | 0.640 | 0.593750×10⁻⁶ |
| 3 | Mustard oil | 70×10−3 | 895 | 0.895 | 78.212291×10⁻⁶ |
| 4 | Coconut oil | 21×10−3 | 843 | 0.843 | 24.911032×10⁻⁶ |
| 5 | Steel* | 6×10⁻³ | 7014 | 1 | 0.855432×10⁻⁶ |
| 6 | Slag* | 85×10−3 | 3150 | 0.45 | 26.984127×10⁻⁶ |
*At 1873 K and the rest are at room temperature
A large number of experiments were carried out to study the dependence of mixing time and slag eye are on operating parameters as well as thermo-physical properties of the upper phase liquid. Towards measurement of mixing time, electrical conductivity measurement technique was employed. In a typical experiment, water was filled up to the desired level and the conductivity measurement probe CYBERSCAN CON 200™ was placed near the vicinity of bottom and vertical walls of the vessel (i.e., probe tip displaced by 30 to 40 mm from the bottom and side walls and located diametrically opposite to the plug/injection nozzle), which is known to be the slowest mixing region in such system. Placement of the probe in the slowest mixing region allowed us to interpret the measured local mixing time as the bulk mixing time, since by the time the slowest mixing region attains 95% homogeneity, the bulk of ladle’s content is practically homogeneous. Subsequent to the placement of the probe, a pre-determined amount of the upper phase liquid (viz. Table 3) was added carefully over the aqueous phase to achieve the desired ΔL/L ratio. The conductivity probe was connected to a desk top computer via a conductivity meter for continuous monitoring of water’s local conductivity (i.e., conductivity prevalent at the probe location) as a function of time. A schematic of the gas stirred vessel showing probe’s location and its linkage to the conductivity probe is presented in Fig. 1. Once the experimental set-up was made ready, air was introduced at the desired rate through a single bore (diameter 5 mm) vertical nozzle located at the base of the vessel. A few minutes, beyond the flow establishment period, which in gas stirred ladle system is known to be typically small,12.13) a measured quantity of tracer (saturated solution of NaCl) was added over the exposed plume eye. It is instructive to note here, from experiment to experiment for any given set of operating conditions, progressively increasing amount of tracer was required to be added over the exposed eye to obtain a well amplified, conductivity versus time response that could be used to estimate mixing time accurately. The amount of tracer needed to fulfill the above was obtained a priori through a set of calibration experiments. These indicated while the first experiment in the smaller tank, could produce an acceptable tracer response with about 25 ml of the tracer solution, the fifth and the final experiment, on the other hand, needed substantially more tracer solution, almost six fold higher, to produce a response of equivalent magnitude. As the amount of tracer increased, the duration of addition also increased somewhat but the latter always remained much smaller than the duration of the mixing time.

As a requisite amount of tracer was added to the bath, simultaneously conductivity meter was switched on to measure changes in local conductivity as a function of time. Initially, conductivity of the bath corresponded to that of pure water at room temperature however, from the moment of tracer addition, local electrical conductivity increased progressively with time attaining eventually a constant, steady state, value. Transient conductivity data registered by the conductivity probe was stored in a desk top computer with the help of the CYBERCOMM™ data acquisition software. Experimental data were finally exported to Microsoft Excel™ to graphically depict the variation of conductivity with time. The latter formed the basis of estimation of 95% bulk mixing time. A typical tracer response curve is shown in Fig. 2, wherein, the procedure for estimation of 95% mixing time is also illustrated. A minimum of three and a maximum of five experiments were conducted for any given experimental condition. On the basis of such, an average, representative 95% bulk mixing time was estimated.

For slag eye are measurements different altogether experimental arrangements were made. During a typical measurement, the model ladle was filled with water up-to the desired level and a measured quantity of upper phase liquid was gently poured over bath. As air, supplied from a compressed air reservoir, was introduced through the bottom nozzle at the desired rate, the evolution of slag eye area as a function of time was captured through a digital SONY video camera (120x-DCR-PC109E PAL model), positioned over the vessel, as shown schematically in Fig. 1. An instantaneous photographic view of slag eye area in the smaller vessel (Rsmall=0.15 m) is shown in Fig. 3. For each experiment, video photography was typically continued for about five minutes. The recording was processed via the Windows movie maker™ and there from, a large number of snap shots or frames were captured at a regular interval of 5 s. Appropriately calibrated Image-J software™ was employed to estimate slag eye area from the snapshots. A representative slag eye are, for any given experimental condition, was estimated from several instantaneous snap shots since, wandering of bubble plume tend to make slag eye area time dependant. It was found that no more than ten frames/snap shots were required to arrive at a representative, near constant slag eye area for any particular set of operating conditions. It is to be emphasized here that calibration is crucial for accurate estimation of slag eye area as it is difficult to infer actual area from a photograph. Moreover, for a fixed camera setting, slag eye area as recorded can be expected to be a function of camera location, from where a photograph is captured. Consequently in all experiments, camera settings were pre-fixed setting and the same was placed vertically above the bath, at a fixed location. Prior to any measurements of slag eye area, calibration experiments were carried out in which, standard card board pieces of known area, floating freely over the water bath were photographed and there from, an estimate of corresponding area made via an image processing software. The ratio between the actual area of card board pieces to that estimated via the software is the calibration or scale factor and the same was applied always to infer actual slag eye area from photographs. For cross checking, scale factor was also estimated by comparing actual Perspex vessel diameter against the one in a photograph.

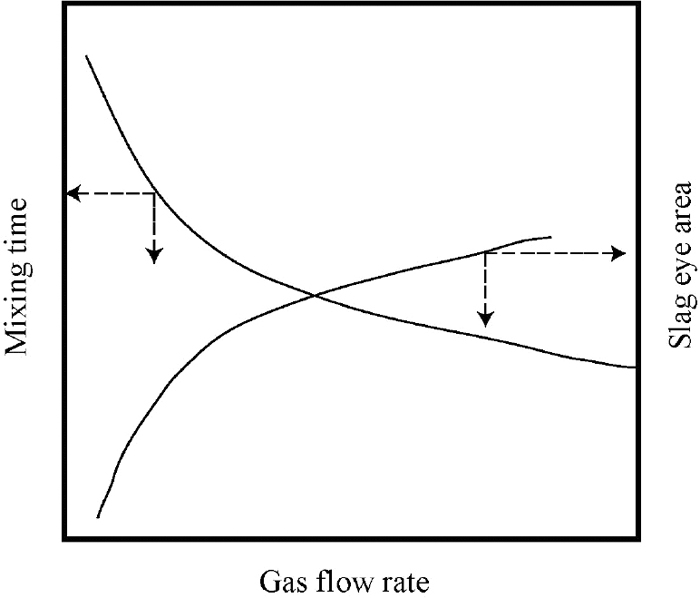
It is rather well known that a relatively large argon flow rate ensures faster liquid mixing (or shorter mixing times) in ladles. On the other hand, a large argon flow rate creates relatively large exposed slag eye, making steel susceptible to re-oxidation in actual practice. Thus, while mixing times decreases with increasing gas flow rate, slag eye area on the other hand, increases with increasing gas flow rate. This is illustrated schematically in Fig. 4. Re-oxidation, as is well known, must be contained for production of clean steel. Desirable operating conditions are therefore those ensuring shorter mixing times as well as smaller slag eye area. Looked at from such standpoints, engineering of argon flow rates in ladle metallurgy steelmaking operations becomes a multi objective, multivariable, optimization problem. In such context, it is instructive to note here that unlike a single objective, optimization problem, a multi-objective problem does not lead to a single, optimal value or solution, rather a set of values or solutions is produced. Such solutions are known to constitute what is referred to as a Pareto front and every solution therein is referred to as a Pareto optimal solution.
As a starting point, correlations for mixing time and slag eye area in terms of operating variables were derived (see later). On the basis of such and a set of constraints, a multi objective optimization problem is formulated to estimate possible values of gas flow rate Q, liquid depth L, slag layer thickness ΔL and vessel radius R in the search space, such that minimum mixing time coupled with small slag eye area result. The constraints defining the search space are known from industrial scale operating conditions and can be expressed in terms of the various decision parameters which are synonymous to operating variables (e.g., Q, L, R and ΔL). Applicable constraints are described in the following in details.
(i) Ladle metallurgy operations typically embody a limited range of gas flow rates or specific potential energy input rate. As shown in Table 1(a), during argon rinsing operation, maximum specific potential energy input rate is generally of the order of 0.01 W/kg. Therefore, a constraint on specific energy input rate is set according to (in SI unit),
|
0.001≤
gQ
π
R
2
(W/kg)≤0.03
| (3) |
(ii) Industrial ladles are typically cylindrical in shape and as filled, their aspect ratio (=L/2R) tend to vary between 0.75 and 1.35 (see Table 1(b), for example). Consequently, the following applies:
(iii) Capacity of industrial ladles vary widely from one plant to another. Depending on BOF/EAF heat size, holding ladle in a present day steel mill generally varies between 50 and 500 Tonne. Thus, considering Msteel = ρsteelπR2L, (in which, Msteel is the mass of steel contained in a ladle (kg)) an additional constraint is derived and expressed as:
|
2.27≤
R
2
L(
m
3
/s)≤22.73
| (5) |
(iv) Finally, thickness of slag in a ladle varies substantially depending on refining practice. A large number of data collected from the industry indicated that thickness of slag layer is typically 1–10% of the bath depth. Given such, a constraint on the decision variable ΔL is formulated as:
Properties of ladle slag generally vary over a narrow range. Consequently, optimisation calculations were carried out considering specific slag properties for water-oil analogue as well as an actual industrial scale ladle.
To solve the multi variable constrained optimization problem thus formulated, the multi-objective, genetic algorithm (GA) function GAMULTIOBJ embodied in MATLAB™ was applied. The former uses a controlled, elitist genetic algorithm, a variant of non dominated sorting genetic algorithm (i.e., NSGA-II14)). Elitist non-dominated sorting genetic algorithm uses elite as well as explicit diversity preservation mechanisms. The offspring population is created using the parent population through selection, crossover and mutation operators. Fitness is assigned by performing non-dominated sorting to the global (parent + offspring) population. To preserve diversity, a crowding distance is used. More details of these can be found in Ref. 11) and consequently not re-iterated here. The scheme of genetic algorithm based optimization calculation is shown in Fig. 5.
3. Results and Discussion
3.1. Mixing and Slag Eye Area
Prior to developing correlations and carrying out optimization calculations, adequacy and appropriateness of the experimental procedures were assessed. Mixing time measurements were carried out in the bigger tank (Dbig =0.60 m) in the absence of any upper phase liquid for an axi-symmetrical gas injection configuration. On the basis of such, 95% bulk mixing times were determined as a function of gas flow rates for different vessel aspect ratios and compared directly with equivalent estimates deduced from a previously reported empirical correlation.2) This is illustrated in Fig. 6. There, reasonable agreement between measurements and predictions evidently indicates reliability of the present experimental procedure and approach. It is important to mention here that tracer addition as well as the monitoring point locations in these experiments were kept similar to those for which the empirical correlation2) was originally developed.

Location of slag eye on the liquid free surface as well as the associated area changes continuously due to long and short term wandering of a bubble plume.15) Thus, instantaneous eye area is expected to be different from its time average value. Instantaneous slag eye areas and their corresponding average (obtained on the basis of several successive snap shots) in the smaller model ladle (Dsmall=0.30 m) is shown in Fig. 7 for a particular set of operating condition. There, it is evident that while instantaneous area fluctuates continuously with time, average area estimated on the basis of ten to twelve successive snap shots/images yield a near constant time average value. Consequently, for each experiment, at least fifteen successive snapshots were extracted from continuous video recording and there from, a representative, time average slag eye area was estimated. In addition to these, for water-petroleum ether system (L/D=1, ΔL/L=0.02 and Q=3.33×10⁻⁵ m3/s) several experiment were carried out to assess reproducibility of such measurements/inferences. Successive experiments, following the procedure outlined already, produced estimates of slag eye area which were found to be practically identical (0.01327, 0.01323 and 0.01335 m2 respectively). Adequacy of measurements was also carefully evaluated by comparing measured area against actual area of a standard card board specimen floating freely over an un-stirred water bath.

To formulate mixing time correlation in terms of operating variables and thermo-physical properties, large number of experiments were carried out in which, 95 pct. bulk mixing times were measured as a function of gas flow rate for different bath depths. These experiments were carried out primarily in the bigger diameter ladle (Dbig=0.60 m) with a plug located at the mid bath radius (R/2) position. Gas flows were restricted to the inertial force dominated flow regime8) and accordingly, restricted within the range 1.3334×10⁻⁴ to 3.6667×10⁻⁴ m3/s. As a sample illustration, variation of mixing time with gas flow rate and liquid depth are shown in Figs. 8(a) and 8(b) respectively. These indicate that with the increase in gas flow rate and liquid depth, mixing time decreases following the functional relationships τmix∞L−1.0 and τmix∞Q−0.33 respectively. On the basis of such and a previous study,2) it is concluded that similar functional relationships between mixing time and gas flow rate as well as mixing time and liquid depth are largely obeyed for nozzle/plug located at r=0 as well as r=0.5R. Additional experimental results also indicated that mixing time increases with the increase in slag layer thickness and varies according to a third power, as has been reported in the literature.11)

In a previous study published in this journal,16) derivation of mixing time correlation for a slag covered, twin plug fitted ladle was considered elaborately. Adopting the same methodology (i.e., dimensional analysis, experimental measurements and non-linear regression), an appropriate mixing time correlation for a plug located at the mid-bath radius position could be derived and represented in dimensionless form as:
|
(
τ
mix
Q
R
3
)
=222
(
Q
2
g
R
5
)
0.33
(
L
R
)
-1.0
(
ΔL
R
)
0.3
(
ν
s
2
g
R
3
)
0.016
(
Δρ
ρ
L
)
-0.044
| (7) |
It is important to mention here that regression correlation coefficient associated with Eq. (7) was found to be greater than 0.9. In terms of key operating variables, the preceding relationship has been re-cast in the following explicit form, viz.,
|
τ
mix,95%
≈112
Q
-0.33
L
-1.0
R
2.0
(
ΔL
)
0.3
ν
s
0.033
(
Δρ
ρ
L
)
-0.044
| (8) |
or, in terms of a dimensionless slag depth
η
(
=
ΔL
L
)
, as:
|
τ
mix,95%
≈112
Q
-0.33
L
-0.7
R
2.0
η
0.3
ν
s
0.033
(
Δρ
ρ
L
)
-0.044
| (9) |
The previous work16) also indicated that mixing times between slag-less and slag-covered ladles, for any given set of operating conditions can be correlated reasonably well via:
|
τ
mix,95%,slag
≈
τ
mix,95%,no-slag
[
6
η
0.3
ν
s
0.033
(
Δρ
ρ
L
)
-0.044
]
| (10) |
This as a consequence implies that for a plug located at the mid-bath radius position, a reasonable estimate of mixing time, in the absence of any slag (or, at best a thin slag), could be estimated from:
|
τ
mix,95%
≈18.7
Q
-0.33
L
-0.7
R
2.33
| (11) |
The effectiveness of the two correlations (viz., for slag-less and slag-covered ladles, with plug located at 0.5R; Eqs. (8) and (11) respectively) is illustrated in Figs. 9(a) and 9(b) respectively. Considering uncertainty to the tune of 20 to 25% inherent in experimental measurements due to flow transients etc., the proposed correlations appear to work satisfactorily.
For similar range of operating conditions and upper phase characteristics, a dimensionless empirical correlation for slag eye area was deduced experimentally for an axi-symmetrical gas stirred ladle system8) viz.,
|
(
A
es
LΔL
)
=3.25
(
U
P
2
gΔL
)
1.28
(
ν
s
ΔL
U
P
)
-0.05
(
ρ
L
Δρ
)
0.55
| (12) |
However, for mid bath radius position of the plug, the following version of the “slag eye area correlation” was found to work satisfactorily.
|
(
A
es
LΔL
)
=2.67
(
U
P
2
gΔL
)
1.28
(
ν
s
ΔL
U
P
)
-0.05
(
ρ
L
Δρ
)
0.55
| (13) |
in which,
17)
|
U
P
=3.1
Q
0.25
L
0.25
R
-0.58
| (14) |
The effectiveness of Eq. (13) is illustrated in Fig. 10. There, excellent agreement between prediction and measurements is readily evident.
It is instructive to note here that the empirical correlations for mixing time and slag eye area presented above (viz., Eqs. (8) and (13)) have been specifically formulated for gas stirred ladle systems with a plug located at mid-bath radius position. Therefore, these are truly applicable to Froude dominated ladle flows subject to the following restrictions: (i) 0.75 L/D < 1.35, (ii) εm–0.01 W/kg, (iii) νL=10−6 m2/s, (iv) 0.01 < η < 0.10, (v) 0.01 < Δρ/ρL < 0.46 and (vi) (0.004×10⁻⁴) <
γ
S
(
m.m
s
)
< (1.002×10⁻⁴). Generalization of Eqs. (8) and (13) and similar equations presented in the text to conditions beyond the currently validated range, is not certain.
3.2. Optimization
On the basis of correlations developed for mixing time and slag eye area (viz. Eqs. (8) and (13) respectively), a constrained, multi-objective optimisation problem was formulated to find out the favourable operating window for ladle metallurgy steelmaking operations. As pointed out already in sec.2.2, a set of constraints or bounds were imposed on the two objective functions (namely, Eqs. (8) and (13)) in accordance with the industrial ladle refining practices.
The present constrained optimization problem was solved via MATLAB™ embodying the built- in, genetic algorithm (GA) based optimization tool, i.e., the ‘GAMULTIOBJ’. Since solution is expected to be a function of various genetic operators, consequently prior to carrying out actual optimization calculations, effect of genetic operators such as, selection function, mutation function, mutation rate, crossover function and crossover rate on predicted results have been extensively studied computationally and results independent of these established.
Pareto optimal solutions derived for a water model ladle (i.e., D=0.30 with plug at mid-bath radius position) subject to the set of constraints mentioned earlier viz., (i) 0.75 ≤ L/D ≤ 1.35; (ii) 0.001 ≤ gQ/πR2 ≤ 0.03 (iii) 0.01 ≤ ΔL/L ≤ 0.1) is shown in Fig. 11. There, while each point on the Pareto front represents an optimum solution, these are not equally desirable from the view point of efficient ladle processing. For example, the two extreme solutions on the Pareto-front represent best solution for only one of the two objectives (i.e., mixing or slag eye area) involved. Given this, the point at the left hand extreme is the best solution as far as mixing time is concerned. In contrast, the point at the extreme right hand extreme represents the best solution for slag eye area. However, from a multi-objective perspective, decision makers, in practice, would like to have not just the extreme solutions but a wide range of uniformly distributed, trade-off solutions, between the objectives considered. The very nature of the Pareto front indicates a good compromise in the range where slope of the curve changes rather rapidly. Given such, it appears that the range 30 s <τmix <44 s and 0.005 m2 <Aes <0.01 m2 is suitable as this is associated with moderate slag eye area as well as reasonable mixing time. Each point on the Pareto corresponds to a given set of operating parameters. Representative set of Pareto optimal conditions embodied in Fig. 11 are summarized in Table 4. There as shown, for D=0.30 m, the suggested range (30 s <τmix <44 s and 0.005 m2 <Aes <0.01 m2) is associated with a bath height of 28 cm (or L/D=0.93, slag depth of about 10 mm (or ΔL/L=0.036) and a gas flow rate of about 0.1666×10⁻⁴ m3/s (or, gQ/πR2 =0.0024 W/kg).

Table 4. Representative set of Pareto-optimal solutions for plug at mid bath radius location in a 0.30 m diameter model ladle.
In Fig. 12, Pareto optimal fronts for two different plug configurations (central vs. mid-bath radius positions) for the smaller water model (Dsmall=0.30 m) have been compared. Evidently, the two predicted Pareto fronts differ somewhat indicating essentially that favorable operating regimes in ladle metallurgy steelmaking are expected to be a function of plug position. Referring back to the results presented in Fig. 12, it is to be noted here that the Pareto front for axi-symmetrical plug location was deduced on the basis of already reported mixing time and slag eye area correlations reported in the literature2,8,16) viz.,
|
τ
mix,95%
≈152
Q
-0.33
L
-1.0
R
2.0
(
ΔL
)
0.3
ν
s
0.033
(
Δρ
ρ
L
)
-0.044
| (15) |
|
(
A
es
LΔL
)
=3.25
(
U
P
2
gΔL
)
1.28
(
ν
s
ΔL
U
P
)
-0.05
(
ρ
L
Δρ
)
0.55
| (16) |
These, as one would normally anticipate, bear striking similarity with their counterparts, valid for the mid radius position of the plug. Three dimensional flows generated due to an asymmetrically placed plug expedites mixing making the pre-exponent in Eq. (15) somewhat pronounced in comparison to that in Eq. (8). Similarly, Eqs. (13) and (16), indicate that under identical operating conditions, slag eye area for axisymmetrical condition is somewhat bigger than that for the mid-bath radius position of the plug. This is expected and is due to the lateral constriction of the rising surfacing plume, in the proximity of the vessel side wall.
Finally, to assess a few arbitrarily chosen experimental conditions vis a vis the corresponding Pareto front, slag eye area and mixing times were experimentally measured in the smaller vessel (Dsmall=0.30 m) for mid-bath radius position of the plug. In these, Petroleum ether was used as the upper phase liquid and gas flow rates were so chosen that mixing times of about ~40 s result. Slag layer thicknesses as well as ladle aspect ratio (L/D) were arbitrarily fixed respecting the relevant constraints mentioned in the preceding section. Experimental data points, superimposed over the relevant Pareto front, is shown in Fig. 13. There, clearly, the chosen conditions are sub-optimal and as a result, produce greater slag eye area than desirable. Currently, the optimisation procedure developed in the study is being applied to assess argon rinsing operations in a domestic special steel plant and thereby improve, if required, the inert gas stirring operation.
4. Conclusions
From the present work the following general conclusions can be drawn:
(1) For gas stirred ladles fitted with a plug located at the mid-bath radius position (L/D~1, 0.01<ΔL/L <0.1, εm~0.01 W/kg), 95% bulk mixing time and slag eye area can be reasonably approximated via:
|
(
τ
mix
Q
R
3
)
=222
(
Q
2
g
R
5
)
0.33
(
L
R
)
-1.0
(
ΔL
R
)
0.3
(
ν
s
2
g
R
3
)
0.016
(
Δρ
ρ
L
)
-0.044
|
|
(
A
es
LΔL
)
=2.67
(
U
P
2
gΔL
)
1.28
(
ν
s
ΔL
U
P
)
-0.05
(
ρ
L
Δρ
)
0.55
|
in which, Q is the gas flow rate, L is the liquid depth, R is the vessel radius, ΔL is the slag layer thickness,
τmix is the 95% mixing time and A
es is the slag eye area.
(2) Based on the above correlations and a set of constraints i.e., viz.,
0.001≤
gQ
π
R
2
(w/kg)≤0.03
;
0.75≤
L
2R
≤1.35
; 2.27 ≤ R2L(m3) ≤ 22.73 and
0.01≤
ΔL
L
≤0.10
, a multi-variable, constrained optimization problem has been formulated to study the efficacy of argon injection in ladle metallurgy steelmaking operations.
(3) The optimisation problem was solved for a geometrically and dynamically similar water model system (D=0.30 m). It is shown that due to the conflicting nature of the objective functions, a Pareto front embodying a number of optimal solutions, result.
(4) Pareto optimal fronts for two different plug positions (axisymmetrical and mid-bath radius position) indicate that desirable optimal argon injection rate is likely to be dependant on the position of the gas injection nozzle/plug.
(5) Arbitrarily chosen operating conditions in the small water model ladle were evaluated against the corresponding Pareto front. Sub-optimality of such arbitrarily chosen conditions essentially demonstrates the adequacy and effectiveness of the present formalism.
List of Symbols
Aes slag eye area, m2
D diameter of ladle, m
Dbig diameter of the bigger model ladle, m
Dsmall diameter of the smaller model ladle, m
g gravitational acceleration, m/s2
L liquid depth, m
M mass of steel contained in the ladle, kg
Q gas flow rate (corrected to mean height and temperature of the liquid), m3/s
Qf.s gas flow rate in full scale ladle, m3/s
Qmod gas flow rate in the model, m3/s
R vessel radius, m
UP average plume rise velocity, m/s
ΔL slag layer thickness (m),
Δρ metal-slag density differential, kg/m3
εm rate of specific potential energy input to the system, w/kg
λ geometrical scale factor (=Lmodel /Lfull scale)
η dimensionless slag depth (=ΔL/L)
υs kinematic viscosity of the upper phase, m2/s
ρL bulk liquid density, kg/m3
τmix mixing time, s
τmix,95% 95% mixing time, s
References
- 1) S. Asai, T. Okamoto, J. C. He and I. Muchi: Trans. Iron Steel Inst. Jpn., 23 (1983), 43.
- 2) D. Mazumdar and R. I. L. Guthrie: ISIJ Int., 35 (1995), 1.
- 3) M. Iguchi, K. Nakamura and R. Tsujino: Metall. Trans., 29B (1998), 569.
- 4) G. Irons, A. Senguttuvan and K. Krishnapisharody: ISIJ Int., 55 (2015), 1.
- 5) K. Yonezawa and K. Schwerdtfeger: Metall. Trans., 30B (1999), 411.
- 6) D. Mazumdar and J. W. Evans: Metall. Trans., 35B (2004), 400.
- 7) K. Krishnapisharody and G. A. Irons: Metall. Trans., 37B (2006), 763.
- 8) M. Peranandhanathan and D. Mazumdar: ISIJ Int., 50 (2010), 1622.
- 9) J. H. Grevet, J. Szekely and N. El-Kaddah: Int. J Heat Mass Transf., 25 (1981), 487.
- 10) D. Mazumdar, H. B. Kim and R. I. L. Guthrie: Ironmaking Steelmaking, 27 (2000), 302.
- 11) D. Mazumdar and R. I. L. Guthrie: Metall. Mater. Trans., 41B (2010), 976.
- 12) M. Iguchi, T. Kondon and K. Nakajima: Metall. Mater. Trans., 28B (1997), 605.
- 13) D. Mazumdar, C. Seybart, D. Steingart and J. W. Evans: ISIJ Int., 43 (2003), 2003.
- 14) K. Deb: Multi-Objective Optimization using Evolutionary Algorithms, John Wiley & Sons, New Jersey, (2001).
- 15) K. H. Tacke, H. G. Schubert, D. J. Weber and K. Schwerdfeger: Metall. Trans., 16B (1985), 263.
- 16) S. P. Patil, D. Satish, M. Peranandhanathan and D. Mazumdar: ISIJ Int., 50 (2010), 1117.
- 17) D. Mazumdar: Metall. Mater. Trans., 33B (2002), 937.


;%0A%09%09%09newWindow.document.open();%0A%09%09%09newWindow.document.write('<img src=%22./Graphics/57_286_tbl_4.jpg%22>');%0A%09%09%09newWindow.document.close();%0A%09%09)

