Abstract
In the steel refining process, a metal emulsion in which metal droplets are dispersed in the slag phase plays an important role in improving the reaction efficiency. In a previous study, the formation of metal emulsions was experimentally evaluated using Pb or Al alloys as the metal phase and chloride salt as the slag phase. In this study, the formation of metal emulsions was investigated by using a Sn alloy-salt system, and the influence of the density was clarified. The results revealed that the number, surface area, volume, and mass of emulsified metal droplets were largest in the Al/salt system, while those in the Sn/salt system were similar to those in the Pb/salt system. The formation and sedimentation rates of metal droplets were analyzed based on a mathematical model. The formation rate was also largest in the Al/salt system, while that in the Sn/salt system was similar to that in the Pb/salt system. The bubble rupture frequency showed a similar difference according to the metal phase, and it was shown that the formation rate was strongly influenced by the bubble rupture frequency. In addition, a clear relation between the formation rate by a single gas bubble and the density ratio of the upper and lower phases was found.
1. Introduction
In the steelmaking process, the reaction rate between molten steel and slag is generally controlled by mass transfer. The mass transfer between both phases is significantly improved by strong gas injection, in which the injected gas is accompanied by the physicochemical reactions passing through the interface. One effective method to increase the reaction rate is to emulsify the slag into the metal phase (which is called a “slag emulsion”) or to emulsify the metal into the slag phase (which is called a “metal emulsion”). Since the slag particles in the metal phase are not stable and the residence time in the metal phase is not long,1) a metal emulsion is more effective method to make large interfacial area per unit volume of slag.
Several researchers have attempted to evaluate the influence of metal droplets emulsified into the slag phase and to clarify the formation mechanism. Han and Holappa2,3,4) carried out experiments in a steel/slag sytem using an X-ray transparency technique and classified the droplet formation mechanism into two cases: “film emulsification” and “jet emulsification”. In the former mechanism, fine metal droplets are formed by the rupture of the metal film around the bubble at the interface. In the latter mechanism, a metal column was observed under the bubble and comparably large droplets appeared due to the disintegration of the column. They also investigated the influence of the bubble diameter, the slag viscosity, and the interfacial tension on the total mass of emulsified metal droplets in slag.
Reiter and Schwerdtfeger5,6) observed the formation of droplets when the metal film around the bubble is ruptured in a mercury and water system. After analysis of the results of experiments using various materials for the upper and lower phases, they proposed a non-dimensional equation to express the total volume of droplets formed by a bubble as a function of the viscosity, the density, the bubble size, and the gas flow rate. Lin and Guthrie7) conducted experiments using water/oil and aqueous solutions of ZnCl2/oil systems and also proposed a non-dimensional equation. Uemura et al.8) reported the mechanism of the formation of micro-sized droplets in the water-oil system by using a high-speed camera. The droplets appeared when the water film around the bubble ruptured due to the instability of the capillary wave. Poggi et al.9) carried out experiments using a Pb and molten salt system. In this system, the emulsified metal droplets can be extracted because molten salt can be dissolved in water. They observed many very fine Pb droplets and found an increase in the overall concentration of entrapped Pb droplets as the gas flow rate increased.
In previous studies on water-based system,5,6,7,8) the formation behavior of metal emulsions was easily observed, but the physical properties were very different than those of the actual steel-slag system. However, the details could not be observed by the X-ray technique because of its low resolving power. Therefore, to clarify the behavior of metal emulsions in molten steel and slag systems, it is necessary to understand the influences of the physical properties of metal/slag phases and the gas bubbling rate on the formation mechanism of the metal droplets by using the metal phase as the lower phase. In our previous studies,10,11,12,13) the influence of the bottom bubbling rate on the formation of metal emulsions was experimentally investigated in Pb/salt10) and Al alloy/salt11) systems. As already proposed by Poggi et al.,9) in these systems, the emulsified droplets were able to be extracted by the dissolution of salt into water. The number, surface area, and mass of metal droplets increased with the gas flow rate until a gas flow rate of 500 NmL/min and subsequently decreased from the local maximum value. This result indicates that a higher gas flow rate is not always effective for the formation of metal emulsions. However, the densities of the metal phases in these systems were different than that of steel. Therefore, in this study, an experiment on the formation of metal emulsions was carried out by using a Sn alloy as the metal phase because its density is similar to that of steel. The density ratio between the Sn alloy and the salt was intermediate between that of the Al alloy-salt and Pb-salt systems. The size distribution of metal droplets emulsified in the salt phase and the influence of the density on the emulsion behavior were investigated by the same method used in our previous studies.10,11)
2. Experimental Procedure
The experimental apparatus and procedure have already been described in previous papers.10,11) Figure 1 shows the schematic of the experimental setup. It mainly consisted of a vertical electric resistance furnace, an Ar–H2 gas cylinder, a drying device, a mass flow controller, a Pyrex container (60 mm I.D. × 180 mm), and a gas injection tube. The following experimental procedures were adopted. The 90.5 mass% Sn–7.5 mass% Sb–2 mass% Cu alloy was used as lower phase, and a KCl–LiCl–NaCl (= 50:42.1:7.9 mass%) salt was used as the upper phase. The heights of the Sn alloy and molten salt phases were 60 and 70 mm, respectively. The mixed Ar-3%H2 gas was injected from the bottom center of the container. The gas injection tube, composed of Pyrex glass (1 mm I.D.), was placed at the bottom center of the container. The physical properties, which are compared with those from previous studies, and the actual process are summarized in Table 1. Table 2 shows the experimental conditions and the physical properties of the materials used in this study.

Table 1. Comparison of the physical properties of Fe/slag, Al/salt, Sn/salt, and Pb/salt systems.
| Actual process | Model study |
|---|
| Metal phase | Fe | Al-5%Cu alloy | Sn-7.5%Sb alloy | 99.999%Pb |
| Slag phase | Slag | 50%KCl-42.1%LiCl-7.9%NaCl |
| Working temp. (K) | ≒ 1873 | 973 | 723 |
| Density (kg/m3) | Metal | 7000 | 2375 | 7058 | 11340 |
| Slag | 2700 | 1530 |
| Density difference (ρm-ρs, kg/m3) | 4300 | 845 | 5528 | 9810 |
| Density ratio (ρm/ρs, -) | 2.6 | 1.6 | 4.6 | 7.4 |
Table 2. Experimental conditions and physical properties of materials used in this study.
| Metal phase | Slag phase |
|---|
| Sn alloy | Chloride salt |
|---|
| Compositions (%) | Sn–Sb–Cu = 90.5:7.5:2 | KCl–LiCl–NaCl = 50:42.1:7.9 |
| Density (kg/m3) | 7058 | 1530 |
| Viscosity (Ns/m2) | 0.00135 | 0.0015 |
| Melting point (K) | 513 | 628 |
| Working temperature (K) | 723 |
| Height (m) | 0.06 | 0.07 |
| Amount (kg) | 1.1 | 0.3 |
| Gas flow rate (NmL/min) | 50, 100, 300, 500 and 800 |
| Sampling time (min) | 1, 3, 5, 10, and 15 |
First, 300 g of salt mixed with high-purity powder reagents were melted in a Pyrex container at 723 K in an electric resistance furnace. Second, 1.1 kg of Sn alloy tablets were charged in the molten salt phase and melted. After the complete melting of salt and metal, the gas injection was started. During the bubbling, approximately 1 g of molten salt was collected using a quartz tube with a 4-mm inner diameter from the center position of the salt phase at certain intervals during the experiment. The bubbling was continued for 15 min, and then gas bubbling was stopped. After that, salt sampling was continued for 20 min.
The collected salt sample was quenched in a beaker, and the metal droplets in the sampled salt were separated by the same method used in the Pb/salt system.10) The number and diameter of each metal droplet on the filter were measured by using an optical digital microscope (NAKADEN MX-1200 II). Only a quarter area of the filter was used to measure the number of droplets and their diameters, because a large number of droplets were present over the entire area of the filter. The number (N), the surface area (S), the volume (V), and the mass (W) of the droplets in 1 g of salt were calculated using Eqs. (1), (2), (3), (4), respectively:
|
N={
n×(
A
Whole
/
a
Analyzed
)
}/w [g-sal
t
-1
]
| (1) |
|
S=[
(
4π
∑
k=1
n
r
k
2
)
(
A
Whole
/
a
Analyzed
)
]/w [
m
2
g-sal
t
-1
]
| (2) |
|
V=[
(
4π
3
∑
k=1
n
r
k
3
)
(
A
Whole
/
a
Analyzed
)
]/w [
m
3
g-sal
t
-1
]
| (3) |
|
W=[
(
4π
3
ρ
m
∑
k=1
n
r
k
3
)
(
A
Whole
/
a
Analyzed
)
]/w [-]
| (4) |
where
n is the observed number of droplets (–),
AWhole is the area of the filter (m
2),
aAnalyzed is the analyzed area of the filter (m
2),
w is the mass of the sampled salt (g),
r is the radius of each droplet (m), and
ρm is the density of the metal droplets (kg/m
3).
The formation behaviors of metal emulsion and bubble detachments at the interface between the Sn alloy and the salt were observed by a high-speed camera (Casio EX-F1, frame rate 1200/s).
3. Results
Figure 2 shows a photograph of the Sn droplets placed on the membrane filter with a pore size of 2 μm, observed by an optical digital microscope. The metal droplets are separately placed on the filter and have a spherical shape.
Figure 3 shows the size distribution of the metal droplets with time after the start of bubbling at a gas flow rate of 500 NmL/min. As the droplet diameter decreased, the number of droplets increased. The peak size class was 3–4 μm in diameter regardless of bubbling time. The peak height increased with time.
Based on the results of the size distribution, the influence of the bottom bubbling rate on the formation of metal emulsions was investigated with the changes in the total number (N), surface area (S), and mass (W) of the metal droplets. Figure 4 shows the change in N, S, and W with time after the start of bubbling. The number of droplets was about 1300–11000/g-salt in this system. The N, S, and W values gradually increased with bubbling time and reached a steady state at 15 min.

Figure 5 shows the size distribution of metal droplets sampled in the steady state, i.e., 15 minutes after the start of bubbling, at various gas flow rates. The diameters of the metal droplets were mainly distributed in the range below 20 μm and were concentrated in the ranges of 2–10 μm for all gas flow rates. The amount of metal droplets increased continually with the gas flow rate from 50 to 800 NmL/min. A peak in the size distribution appeared in the range of 3–4 μm for all of the gas flow rates. The same trends were observed even when the sampling time or the gas flow rate changed.

Figure 6 shows the influence of the gas flow rate on N, S, V, and W in the steady state. In this figure, the results obtained for the Pb-salt system10) and the Al/salt system11) are shown for comparison. In every case, N, S, V, and W increased with the gas flow rate, but in the Pb/salt and Al/salt systems, local maximum values were observed at a gas flow rate of 300–500 NmL/min. A comparison of these values for different metal phases showed that the values for the Al/salt system were greater than those for the Sn/salt and Pb/salt systems. Figure 7 shows the arithmetical mean diameter of metal droplets sampled at 15 min after the start of bubbling as a function of the gas flow rate. The mean diameter was in the range of 6–10 μm and gradually decreased with the gas flow rate. At a low gas flow rate, the mean diameter of the Sn/salt system was larger than those of the other systems, but at higher gas flow rates, the difference was not significant.

Figure 8 shows the change in N, S, and W with time after the bubbling stopped. The values of all parameters decreased drastically by about 20–70% within 1 min because of the sedimentation of metal droplets. The gradient of the decreasing rate decreased with time and reached a constant value at about 10 min after the gas bubbling stopped. Metal droplets still existed in the salt phase at 10 min or later.

Figure 9 shows captured images of bubble detachments from the salt phase and the rupture of the metal film around the bubble observed by the high-speed camera. The lower part is the molten Sn alloy, and the upper part is the molten salt phase. The bubble detachment and film rupture were classified into the two types, modes A and B, similar to the Pb/salt system.10) In mode A, the gas bubble reaches the interface and forms a bubble in the salt phase with a metal film. When the metal film around the bubble becomes thin and ruptures, metal droplets form near the interface. Some metal film adheres to the rising bubble surface and detaches from it at some distance. In mode B, the rising gas bubble drains the metal film into the salt phase, and a metal column is formed. The rupture of the film around the bubble causes the disintegration of the metal column, and metal droplets are dispersed in the salt phase. The height of the film rupture in mode B is higher than that in mode A. The frequencies of modes A and B were determined by analyzing the movie recorded by the high-speed camera. Figure 10 shows the frequency of film rupture modes as a function of the gas flow rate. The frequencies of modes A and B increased with the gas flow rate. Figure 11 shows the comparison of the total frequency (modes A and B) of the film rupture modes. In the Al/salt system, another mode was observed, in which the succeeding bubbles reach the interface before the previous bubble is detached from the interface and form the connected bubbles with elongated metal dome.11) In this case, the metal droplets are formed when the metal film around the connected bubbles disintegrates. However, in this case, sometimes the dome reaches the top surface of the molten salt phase, and the metal film around the connected bubbles returns to the metal phase directly. Thus, in this figure, the frequency of this mode was not counted. In the Pb/salt and Al/salt systems, the total frequency increased with the gas flow rate and reached a local maximum value at a gas flow rate of 300–500 NmL/min. However, in the Sn/salt system, it increased gradually with the gas flow rate. The total frequency of film rupture in the Al/salt system was about two times greater than those in the Pb/salt and Sn/salt systems.

Figure 12 shows the average height (HAV) of film rupture in the salt phase as a function of the gas flow rate in each system. The value of HAV increased gradually with the gas flow rate, and its value in the Sn/salt system was similar to that in the Pb/salt system but smaller than that in the Al/salt system.
4. Discussion
A comparison of the three systems showed that every characteristic related to the formation of the emulsion (N, S, V, and W) depended on the density of the metal phases. Furthermore, the bubble rupture frequency and the height also reflected the density. This result indicates the strong influence of the density of the lower phase on the emulsion formation and the bubble detachment behavior.
The metal droplets were formed by gas bubbling and settled in the lower metal phase simultaneously. The formation rate (vf) and the sedimentation rate (vs) were analyzed by the same method reported in a previous study.11,13) In this analysis, the formation rate (vf) is assumed to be constant, and the sedimentation rate (vs(t)) at time t is assumed to be in proportion to the total weight of the droplets. They can be expressed by the following equations:
|
v
s
(
t
)
=d
W
Sedim
/dt=
C
′
×W(
t
)
| (6) |
where,
WForm and
WSedim are the mass of the metal droplets in 1 g of salt formed by bubbling and settling in the lower phase, respectively.
C is a constant (min
–1), and
C′ is the sedimentation coefficient (min
–1).
W(
t) is the mass of the metal droplets in 1 g of salt at time =
t. The accumulation rate,
va, is represented by subtracting
vs from
vf,
i.e.,
|
v
a
=dW/dt=
v
f
-
v
s
| (7) |
By substituting Eqs. (5) and (6) into Eq. (7), the following equation for W is obtained as a function of time.
|
W=(
1-
e
-
C
′
t
)
(C/
C
′
)
| (8) |
When t = ∞, Eq. (8) can be represented as
where
Wsteady is the weight of the metal droplets per 1 g of salt after reaching the steady state (–). By substituting
Eqs. (9) to
(8),
W can be represented by
Eq. (10).
|
W=(
1-
e
-
C
′
t
)
×
W
Steady
| (10) |
By applying Eq. (10) to the experimental results of the change in mass with time during gas bubbling, as shown in Fig. 13, C′ can be obtained, and the formation and sedimentation rates of droplets can be calculated using Eqs. (5), (6) and (7). Figure 14 shows the relation between the formation rate of metal droplets and the gas flow rate in the Sn-salt system compared with those in the Al-salt11) and Pb-salt13) systems. In the case of Al-salt system, the experiments have been conducted at 973 K, i.e. 250 K higher than the other systems. By the ideal gas law, the gas volume is 1.3 times larger in this system than the other systems. However, as the residence time of gas bubble is very short, especially in the high gas flow rate, the influence of the temperature was not considered. The formation rate in the Al/salt system was about 10 times higher than that in the Pb/salt and Sn/salt systems. At a lower gas flow rate, the formation rate in the Sn/salt system is higher than that in the Pb/salt system. To discuss the influence of the density of the lower phase, the formation rate, vf ((g/g-salt)/min), is converted to the volumetric formation rate of metal droplets, Vf ((m3/m3-salt)/s), by the following equation.
|
V
f
=
v
f
(
ρ
s
ρ
m
)
/60
| (11) |
where
ρm and
ρs are the densities of the metal and salt phases, respectively. As shown in
Figure 15, the volume rate of formation in the Al/salt system is still 10–100 times higher than that in the Pb/salt and Sn/salt systems. As shown in
Fig. 10, the total frequency of film rupture in the Al/salt system was about two times greater than those in the Pb/salt and Sn/salt systems. The relationship between
Vf and the frequency of rupture,
Fq(A+B), is shown in
Fig. 16. With increasing frequency of rupture,
Vf increased, and a linear relation was observed. This result demonstrates that one of the reasons for the difference between the three systems is the difference in bubble rupture frequency.
The formation rate in the Sn/salt system increased continually with the gas flow rate. However, the formation rate had a local maximum value at a gas flow rate of around 300–500 NmL/min in the Pb/salt and Al/salt systems. The cause of this difference may be that the frequency of the total rupture mode did not have a local maximum value in the Sn/salt system. Thus, the rupture mode had a strong influence on Vf. The rupture mode depends on the gas flow rate, the interfacial tension, the difference in density between the metal and salt phases, and so on. Clarifying the effects of these factors on Vf is future work.
However, this study revealed the significant influence of the lower-phase density on the emulsion formation. Reiter et al.6) proposed a non-dimensional equation to show the non-dimensional total volume of droplets formed by a bubble (Vd*=Vd/Vb) and concluded that Vd* is proportional to (ρs/ρm)1.7, where Vd is total volume of droplets formed by a bubble that has a volume of Vb. Lin et al.7) also shows a similar non-dimensional equation and concluded that Vd* is in proportion to (ρs/(ρm−ρs))1.66. In this experiment, the total droplet formation rate (Vd,Total) is calculated by the volume rate of metal droplet formation (Vf) with the volume of the salt phase (Vsalt), as shown in Eq. (12), and the total bubble formation rate (Vb,Total) is calculated by the average bubble diameter (DAv) with the frequency of bubble rupture in modes A and B (Fq,A+Fq,B), as shown in Eq. (13). The ratio of Vd,Total to Vb,Total is used as the non-dimensional total volume of droplets formed by a bubble (Vd*), as described in Eq. (14). If Vd* is constant, according to Eq. (14), Vf is in proportion to Fq,A+Fq,B, and this relation agrees with the linear relation shown in Fig. 15, independent of the metal phase.
|
V
d,Total
=
V
f
×
V
Salt
| (12) |
|
V
b,Total
=(
4
3
)
π
(
D
Av
2
)
3
(
F
q,A
+
F
q,B
)
| (13) |
|
V
d
*
=
V
d,Total
/
V
b,Total
=(
V
f
×
V
Salt
)
/[
(
4
3
)
π
(
D
Av
2
)
3
(
F
q,A
+
F
q,B
)
]
| (14) |
The relation between Vd* and (ρs/ρm) is shown in Fig. 17, and a fairly good relation is found. Because the measured droplet sizes in this study and in the study by Reiter et al.6) were very different, a direct comparison using the non-dimensional equation proposed by Reiter et al.6) is inappropriate.14) However, the dependence on the density observed in this study was very similar to their result.
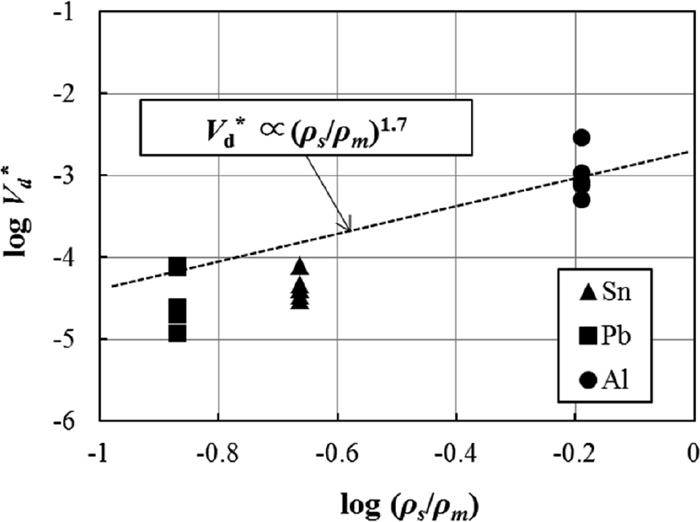
Figure 18 shows the sedimentation coefficient in the Sn/salt system compared with the Pb/salt10) and Al/salt11) systems. The influence of the gas flow rate on C′ is small under these gas bubbling conditions in all systems. The values of C′ in the Al/salt system was the smallest, and those in the Sn/salt and Pb/salt systems showed similar values. According to the mathematical model12,15) in which the balance of the gravitational force, the buoyancy force, the drag force, and the added mass force were considered, the terminal velocity of a droplet of 5 μm diameter in the salt bath is about 40–90 μm/s for Sn and Pb and about 5–7 μm/s for Al. Therefore, the observed difference in C′ in this study is qualitatively reasonable.
5. Conclusions
The formation of metal emulsions was experimentally investigated using a Sn alloy as the metal phase and chloride salt as the slag phase, and the results were compared with those for Pb/salt and Al/salt systems. The following conclusions were obtained.
(1) A large number of metal droplets were observed. The size distribution of the metal droplets was mainly in the range of 2–10 μm, and the peak size was in the range of 3–4 μm in diameter under all experimental conditions.
(2) The number, surface area, and mass of the metal droplets increased gradually with time up to 15 min after the start of bubbling and then reached a steady state. The values of these parameters in the steady state increased with the gas flow rate; those in the Al/salt system were the largest, and those in the Sn/salt system were similar to those in the Pb/salt system.
(3) Metal film rupture around the bubble was observed by a high-speed camera and classified into two types, modes A and B. The total frequency of bubble rupture increased with the gas flow rate; that in the Al/salt system was the largest, and those in the Sn/salt and Pb/salt systems showed similar values.
(4) The formation rate and sedimentation coefficient of the metal droplets were evaluated by a mathematical model. The formation rate in the Al/salt system was about 10 times higher than that in the Pb/salt and Sn/salt systems, and a linear relation between the frequency of rupture and the volumetric formation rate was observed.
(5) The good relation between total mass of droplets formed by a bubble and the density ratio of salt and metal was found.
Acknowledgments
The authors would like to gratefully acknowledge the financial support provided by Nippon Steel Corporationon, and Grant-in-Aid for challenging Exploratory Research (23656473), Japan Society for the Promotion of Science (JSPS).
References
- 1) N. Maruoka, T. Maeyama, H. Shibata and S. Kitamura: Proc. Asia Steel Int. Conf., Korean Institute of Metals, Seoul, (2009), s3.
- 2) Z. Han and L. Holappa: ISIJ Int., 43 (2003), 292.
- 3) Z. Han and L. Holappa: ISIJ Int., 43 (2003), 1698.
- 4) Z. Han and L. Holappa: Metall. Mater. Trans. B, 34B (2003), 525.
- 5) G. Reiter and K. Schwerdtfeger: ISIJ Int., 32 (1992), 50.
- 6) G. Reiter and K. Schwerdtfeger: ISIJ Int., 32 (1992), 57.
- 7) Z. Lin and R. I. L. Guthrie: Metall. Mater. Trans. B, 25B (1994), 855.
- 8) T. Uemura, Y. Ueda and M. Iguchi: J. Vis., 15 (2012), 119.
- 9) D. Poggi, R. Minto and W. G. Davenport: J. Met., 21 (1969), 40.
- 10) D. Y. Song, N. Maruoka, T. Maeyama, H. Shibata and S. Kitamura: ISIJ Int., 50 (2010), 1539.
- 11) D. Y. Song, N. Maruoka, G. S. Gupta, H. Shibata, S. Kitamura, N. Sasaki, Y. Ogawa and M. Matsuo: ISIJ Int., 52 (2012), 1018.
- 12) D. Y. Song, N. Maruoka, G. S. Gupta, H. Shibata and S. Kitamura: Metall. Mater. Trans. B, 43B (2012), 973.
- 13) N. Maruoka, D.-Y. Song, G. S. Gupta, H. Shibata and S. Kitamura: Jpn. Soc. Exp. Mech., 14 (2014), s200.
- 14) H. Yoshida1, J. Liu, S-J. Kim, X. Gao, S. Ueda and S. Kitamura: ISIJ Int., 56 (2016), 1902.
- 15) D. Y. Song, G. S. Gupta, N. Maruoka, H. Shibata, S. Kitamura and V. Rudolph: Trans. Indian Inst. Met., DOI: 10.1007/s12666-016-1023-4.


