Abstract
Interfacial free energy of solid iron was experimentally evaluated for solid/liquid interface and grain boundary of austenite phase in solid Fe/liquid FeO–SiO2 system. Multi-phase equilibrium method was adopted and two kinds of angles such as dihedral angle between solid/liquid interface and grain boundary, and contact angle of sessile drop of molten oxide on solid iron were measured. On the basis of experimental results and literature data of activity of FeO, surface tension of liquid FeO–SiO2 oxide and solid Fe, interfacial tension (interfacial free energy) of solid/liquid interface and grain boundary of γ–Fe were evaluated. Oxygen partial pressure in the experimental atmosphere was evaluated as 1 × 10⁻¹²~10−11atm. Under this condition, solid/liquid interfacial free energy was evaluated as 1440–1500 mJ/m2 and grain boundary free energy of γ–Fe as 860–940 mJ/m2 at 1350°C. The evaluated value for the grain boundary was agreed well with the data of previous works.
1. Introduction
In the continuous casting process, solid iron or steel makes various interface between liquid iron or steel, grain boundary in δ phase or γ phase, and between liquid oxide. And the interfacial free energies are important properties in consideration phenomenon such as transformation between δ and γ phases, generation and separation of scale from the surface of strand in secondary cooling region.
But there are not adequate evaluations of interfacial free energy concerned with solid iron or steel, especially at high temperature of continuous casting process.1,2,3)
In this study, interface between solid iron and liquid iron oxide including SiO2 was focused, and interfacial free energy was experimentally evaluated by multi-phase equilibrium method.4,5)
2. Experimental Methods and Conditions
2.1. Principle of Measurement
Multi-equilibrium method is schematically shown in Fig. 1. Under existence of three phases of solid, liquid and gas, surface of solid or liquid in contact with gas, solid/liquid interface and grain boundary in the solid phase are formed. In the case that more than two kinds of interface are in contact with others, tension of each interface balances along their tangential lines. The balancing conditions are expressed as follows;
|
σ
S
=
σ
SL
+
σ
L
cosθ
| (1) |
|
σ
GB
=2
σ
SL
cos(
α
2
)
| (2) |
Here,
σ indicates tension,
θ indicates contact angle of sessile drop on the solid substrate,
α or
β indicates dihedral angles of solid phase in contact with liquid or gas phase. Subscript of S, L, SL and GB indicate solid surface, liquid surface, solid/liquid interface and grain boundary, respectively.
The Eqs. (3)–(4) can be derived from the Eqs. (1)–(2), in terms of σSL and σGB.
|
σ
SL
=
σ
S
-
σ
L
cosθ
| (3) |
|
σ
GB
=2(
cos
α
2
)
⋅(
σ
S
-
σ
L
cosθ)
| (4) |
Thus, tension of solid/liquid interface and grain boundary can be obtained if the surface tensions and angles θ and α, experimentally.
Here, interfacial tension concerned with solid phase is not strictly equivalent with interfacial free energy. Then, it is supposed that average value of interfacial free energy for crystal orientation is equal to interfacial tension, and treat interfacial tensions which were evaluated experimentally as interfacial free energy.
2.2. Experimental Conditions
Compositions of specimens are shown in Tables 1 and 2. Ultra-low-carbon steel with general composition was adopted as solid iron in this study. On the other hand, molten oxide of FeO–SiO2 system was also adopted and mixing content of SiO2 was changed in three conditions of 10, 20 and 30 mass%.
Table 1. Contents of alloying elements in iron.
| C | Si | Mn | P | S | Nb | Ti | Al |
|---|
| 0.002 | 0.006 | 0.17 | 0.014 | 0.003 | 0.007 | 0.027 | 0.04 |
Table 2. Compositions of molten oxides.
Experimental methods to measure the contact angle θ and dihedral angle α are schematically shown in Fig. 2. Dihedral angle α on the solid/liquid interface was measured by following method. Thus, mixed oxide powder of FeO–SiO2 system was inserted into iron crucibles, heated and melt at certain temperature. After holding time, the crucibles were quenched into the bath of water of room temperature. After the cooling, the crucibles were horizontally cut and their sections were observed with optical microscope. The dihedral angles were measured on the photograph of observation. Contact angle θ was measured by sessile drop method (Fig. 3). Mixed oxide powder was compressed, molded into small briquette and it was set on the substrate of solid iron. Then it was heated and became sessile drop on the substrate. Profile of the drop was observed and the contact angle θ was measured on the photograph of observation.

Electric resistance furnace with carbon heater was used for both experiments, and the conditions in the furnace was kept at 1350°C and Ar gas atmosphere, and the condition was kept for 4 hours. Here, in the case of experiment of preparation for the measurement of dihedral angle α, temperature was kept at 1450°C for 2 hours former, then cooled down to 1350°C and kept at this temperature for 2 hours.
3. Results
3.1. Dihedral Angle α on Solid/liquid Interface
Results of the observation of the sections are shown in Fig. 4. In common to each specimen, the center circle was section of molten oxide and the outer and white area was iron crucible. In any case (Figs. 4(a)–4(c)), the solidified structure of the oxide consisted of the matrix phase of FeO–SiO2 system, dendritic phase of FeO and metallic Fe particles.
The compositions of matrix phase of FeO–SiO2 system were analyzed with SEM-EDX, so as not to include metallic Fe particle in the analyzed area, and the results are shown in Table 3. SiO2 content increased for 5–7 mass% from the initial and mixing state.
Table 3. Analytical results of SiO
2 content in molten oxides.
| Initial | Analytical result |
|---|
| 90 | 16.1 |
| 80 | 25.5 |
| 70 | 36.7 |
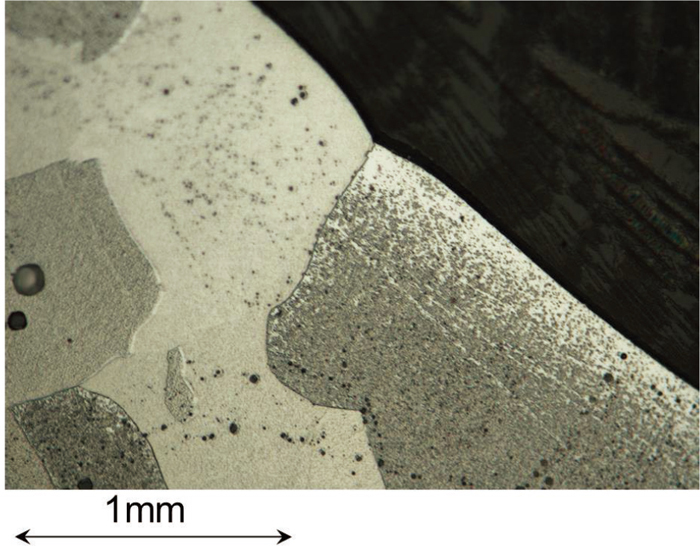
An example of observed dihedral angle is shown in Fig. 5. Typical dihedral angle was observed on the solid/liquid interface where two γ phase grain adjoined and formed grain boundary.
Frequency and its cumulative curve are shown in Fig. 6. The number of measured angles was not adequate and the cumulative curve did not seem to be smooth or symmetry, but the point at which accumulating point of 50% agreed the maximum frequency. In this case, the median can be considered to be average value for each condition.6) Average value of the dihedral angle α was evaluated about 145 deg., and it was almost same in spite of the composition of molten oxide (Fig. 7).
3.2. Contact Angle θ
Observed sessile drop of molten oxide of FeO–SiO2 system on solid iron substrate is shown in Fig. 8. The solid iron got wet quite well by the molten oxide drop, and the state maintained during the holding time.
Relation between the contact angle θ and SiO2 content in the molten oxide is shown in Fig. 9. It seemed that there was a tendency that the contact angle θ increased with SiO2 content, but the range was 3–6 deg., and the change was quite a little.
4. Discussions
4.1. Oxygen Partial Pressure PO2 on Solid/liquid Interface
As shown in Fig. 4, metallic Fe particles existed in the molten oxide of FeO–SiO2 system, and this result suggests that oxygen partial pressure PO2 on solid/liquid interface was controlled by the reaction of FeO reduction expressed by Eq. (5).
|
(FeO)(l)→Fe(s)+
O
2
(g)
| (5) |
As the standard free energy changes of reactions (6) and (8) are given as Eqs. (7) and (9), standard free energy change of reaction (5) comes to be given as the combination of them, Eq. (10). Here, transformation from δ phase to γ phase in the solid Fe is not considered.
|
(FeO)(l)→Fe(l)+
1
2
O
2
| (6) |
|
ΔG°=256 100-53.68 T (J)
| (7) 7) |
|
ΔG°=13 807-7.615 T (J)
| (9) 8) |
|
∴ΔG°=242 300-46.07 T (J)
| (10) |
Equilibrium constant of reaction (5) is given by the Eq. (11).
|
K=exp(
-ΔG°
RT
)
=
a
Fe
⋅
P
O
2
1
2
a
FeO
| (11) |
|
P
O
2
=
(K⋅
a
FeO
)
2
∵
a
Fe
=1
| (12) |
Applying the value of FeO activity from the reference8) and shown in Fig. 10, oxygen partial pressure on solid/liquid interface can be estimated. The result of the estimation is shown in Fig. 11. It can be estimated about 1 × 10⁻¹²~10−11 atm.
4.2. Surface Tension of Solid Iron
As the surface tension of solid iron, some measured values have been reported by Hondros9) and Prince et al.2)
Concerning with the surface tension of δ phase of solid iron, Hondros reported so precious experimental data as a function of oxygen partial pressure (Fig. 12). Because that the value of δ phase can be estimated about 1720 mN/m in the range of 1 × 10⁻¹² − 10−11 atm in this figure, this value is assumed to be the base for the discussion in this section.
Prince et al.2) reported the value of 2150 mN/m as surface tension of γ phase, and this is about 200 mN/m higher than that of δ phase, 1950 mN/m. This experiment was conducted in Ar gas atmosphere, and the Ar gas was treated with Cu–Cu2O system at 850°C and reduction with Ca at 650°C consequently. So it can be considered that oxygen partial pressure in that atmosphere was adequately low.
In this study, difference of surface tension between δ phase and γ phase is estimated as 200 mN/m, and the value of surface tension of γ phase is estimated as 1920 mN/m in the range of 1 × 10⁻¹² − 10−11 atm of oxygen partial pressure.
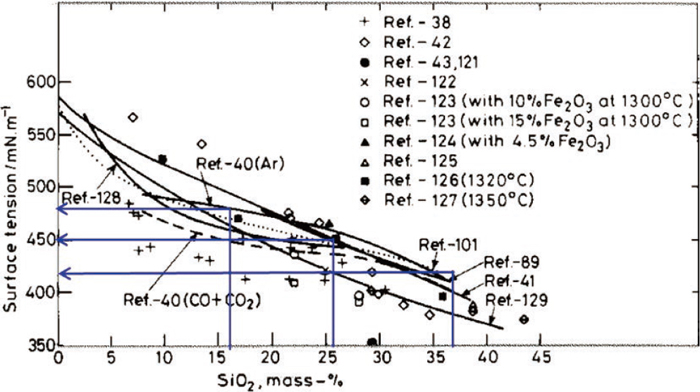
4.3. Surface Tension of Molten Oxide of FeO–SiO2 System
The value of surface tension of molten oxide of FeO–SiO2 system is available from Fig. 13,10) and estimated as Table 4 for the compositions of this study.
Table 4. Surface tension of liquid FeO–SiO
2 for each SiO
2 content.
| SiO2 content (mass%) | Surface tension (mN/m) |
|---|
| 16.1 | 480 |
| 25.5 | 450 |
| 36.7 | 420 |
Solid/liquid tension is shown in Fig. 14. For interfacial tension between solid iron of γ phase and liquid oxide of FeO–SiO2 system, the value of 1440–1500 mN/m was evaluated. Fujiike11) et al. reported interfacial tension between solid iron and liquid slag of CaO–SiO2–Al2O3 system as previous study, and the data is shown in the same figure. Among these plots, a tendency that the interfacial tension decrease with increase of FeO content can be considered.
4.5. Grain Boundary Free Energy in γ Phase of Solid Iron
In the former section, surface tension of liquid or solid, and solid/liquid interfacial tension. Physical property directly evaluated in the balance at dihedral angle is considered to be tension, but this tension is assumed to be average value of free energy, and evaluated value is defined as grain boundary free energy in this section.
Evaluated values of grain boundary free energy in this study is shown in Fig. 15, in comparison with those previous studies (average levels among them are shown with bold line in this figure).2,12,13)
Grain boundary free energy in γ phase of solid iron is estimated in the range of 860–940 (900 ± 40) mJ/m2 and it agrees with the previous ones.
Grain boundary free energy of solid iron was also evaluated as a function of oxygen partial pressure as shown in Fig. 16, in this study. But the dependency of grain boundary free energy on sulfur or oxygen has not been clarified in the previous studies, and this discussion is becoming an important subject in the future.
5. Conclusions
Solid/liquid interfacial tension (interfacial free energy) between solid iron and molten oxide of FeO/SiO2 system (16–37 mass% for SiO2 content) and grain boundary free energy in γ phase of solid iron could be experimentally evaluated.
Values of 1440–1500 mN/m(mJ/m2) was obtained as that solid/liquid interfacial surface tension (interfacial free energy) and 860–940 mJ/m2 as grain boundary free energy of γ phase in solid iron, under condition that temperature is 1350°C and oxygen partial pressure is 1 × 10⁻¹² − −11 atm.
References
- 1) D. Turnbull: J. Appl. Phys., 21 (1950), 1022.
- 2) A. T. Price, H. A. Holl and A. P. Greenough: Acta Metall., 12 (1964), 49.
- 3) H. Yin, T. Emi and H. Shibata: ISIJ Int., 38 (1998), 794.
- 4) N. Eustathopoulos: Int. Met. Rev., 28 (1983), 189.
- 5) Y. Muramatsu, Y. Halada, T. Dan and Y. Isoda: J. Jpn. Inst. Met., 54 (1990), 679 (in Japanese).
- 6) D. Harker and E. Parker: Trans. Am. Soc. Met., 34 (1945), 156.
- 7) D. R. Stull and H. Prophet: JANAF Thermochemical Tables, NSRDS-NBS37, U. S. Department of Commerce, National Bureau of Standards, Washington, D.C., (1971).
- 8) R. Hultgren, P. D. Desai, D. T. Hawkins, M. Gleiser, K. K. Kelly and D. D. Wagman: Selected Values of the Thermodynamic Properties of the Elements, American Society for Metals, Metals Park, OH, (1973), 430.
- 9) E. D. Hondros: Acta Metall., 16 (1968), 1377.
- 10) Slag Atlas, 2nd ed., ed. by VDEh, Verlag Stahleisen, Dusseldorf, (1995), 421.
- 11) K. Fujiike, N. Kawai, S. Shinozaki, K. Mori and Y. Kawai: Tetsu-to-Hagané, 72 (1986), S929 (in Japanese).
- 12) L. H. Van Vlack: Trans. AIME, 191 (1951), 251.
- 13) M. C. Inman and H. R. Tipler: Metall. Rev., 8 (1963), 105.